this is a fundamental buy here based not just on the valuation, but the strategic contract agreements they have, the fact that they're going to start returning uh capital to shareholders soon.
Context
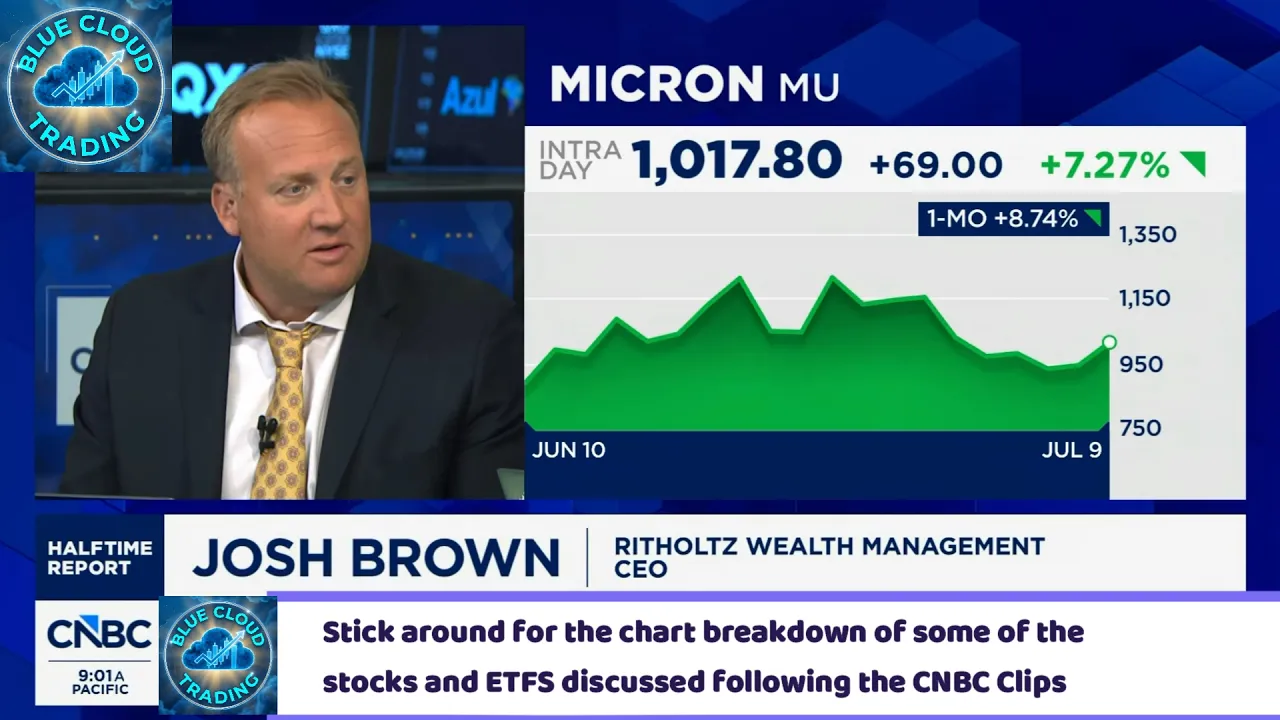
No, I'm saying that fundamentally Micron is a value stock to me. Now, this is debatable. That what I just said is debatable. I've had other value investors come to me and say, "No, it's not a value stock. You shouldn't buy a stock, a cyclical stock like this at low earnings near the top. That that's usually counteryclical." However, I am adamantly saying that I think this is a fundamental buy here based not just on the valuation, but the strategic contract agreements they have, the fact that they're going to start returning uh capital to shareholders soon.
Context
Jim demonstrated that by doubling his position in Micron yesterday. It's like, if I liked it last week or two weeks ago and then it's lower today, well, how can I not like it today?
Once again, I'm in Nvidia. I love Nvidia. I think Nvidia should be higher.
Context
"Stephanie Link joins us now because uh this is a big deal for her. Uh, you bought Nvidia, so it's nice to have you. Thanks for joining. Tell us why. Tell our viewers why this was the time to do that."
Context
"Goldman's reiterates by though today. You want to take that on?" ... "So I think I think for them as it relates to service now they're they're agentic AI tools. They're really embracing the space."
This has been on the best stocks in the market list since last August.
Full Transcript
Blue cloud trading [singing] through the night. >> Welcome [music] back to the channel everyone. In just a second, I'm going to play a few CNBC clips from today's episode of the halftime report. I'm going to pull up the charts and dive into the technicals of some of the mentioned stocks. We're going to look at the key support, resistance levels, momentum, and see if the price action actually backs up what the talking heads are saying. Hit that like button. Subscribe if you haven't already and let's roll the tape on the first clip. >> All right, guys. Thanks so much. Welcome to the halftime report. I'm Scott Wner. Front and center this hour. The latest on the momentum trade. That space continuing to bounce. The committee doing some buying there as well. We'll get to that in a moment. Joining me for the hour, Josh Brown, Jim Leventhal, Jason Sniper, and Talkingington. Show you the markets here. Green across the board. Do have that rebound as SEMA was just talking about in the chip space. That's really the epicenter of the momentum trade. Uh, but it's been mayhem in that in that area. That's what we're calling it. Few days down, few days up. Just when you think it's collapsing, it rebounds. Just when you think it's about to rebound further, it falls. Uh Mike Sani said earlier today that you've only had a couple days in the past month or so where the semis have had less than a 2% intraday move. That pretty much underscores it. Mic uh Micron's a good example of that. We'll show you the one month. I mean, you you can see a fair level of volatility in in that. So, what do you what do you make of of where we are? It's very hard to draw conclusions on anything happening in the market these days because it's been, as I said, up, down, up, down, and who knows where from here. I made the point last week that you've got uh maybe it was Tuesday, I don't know. The days are all blending together for me. Um I made the point a few days ago that you've got $200 billion in um leveraged ETFs. A lot of that is in single stop 2x vehicles. These have become mainstream. That $200 billion is equivalent to 500 billion notional exposure. That's half a trillion dollars. So what that means is on any given day if there are natural normal sellers of these stocks the momentum players may or may not exacerbate that move and make it look even crazier than it would otherwise be. This has changed market structure. We all have to get accustomed to it. The good news is no one is forcing us to actually react to it. So I think if you're in these names and we own you know a whole bunch of these in our porter house portfolio. The thing that you have to just understand is that what comes with the territory of being an uptrending popular great earnings growth story stock sometimes is that a lot of people are affecting buys and sells in the in the uh derivatives that don't really have a meaningful point of view. They're just playing for all right it went down 7% yesterday maybe it'll go to up 7% today and that's actually what's playing out right now. here zero 52-we highs in the SMH today. Um but it is bouncing and uh if you look at the average stock in the SMH it's about 17 about 17% of those are at 50-day highs. So a lot of stocks have been knocked away from their highs but what you got is a momentum reset. Judge to answer your initial question the SMH RSI is now back to a very healthy and cooled off 49. The average 10day rate of change for a stock in the SMH hit negative 15% during this last draw down. That means the average stock lost 15% in that 10day window. And if you've been on the sidelines, you haven't been in these trades, you feel like you've missed out. Well, you finally got an opportunity. Some people won't want it anymore cuz they'd rather buy a stock that's green. But that's the reality of where we sit today. Which is why, Brin, if you like these stocks and you like this trade, your head's going to spin 10 times trying to pick the exact right moment to get in. Jim demonstrated that by doubling his position in Micron yesterday. It's like, if I liked it last week or two weeks ago and then it's lower today, well, how can I not like it today? I assume that's going through your mind as you buy the DRAM ETF. So, take me through that. It was your final trade yesterday and now you followed through and actually bought it. >> Yeah. So after the show was my final trade. It was at $60 yesterday. Josh did a great job walking through the insanity of the levered ETFs which is creating huge volatility which is then in turn for sellers of calls uh like myself and Kevin huge call premium. And so I bought it at 60 yesterday as my final trade. And I said you can sell the September September 70 calls and collect $7. So I have $17 of total upside in the next two months. If not my $60 I got $7. My cost basis will be about 53. Um I did I do think with Micron Micron did touch the 50-day yesterday. So from a technical perspective, and I said this yesterday, I thought Jim's entry point, I know he uses fundamentals really lines with those fundamentals of bouncing off of that. And I will say as everyone is talking about earnings growth, whether it's in emerging markets or the US, Micron should be about 15 to 20% of total earnings growth in the S&P this year. That's one name. And then when you look at the EM SK and Samsung are also around 15%. And think about that. That includes China. That is emerging markets inclusive of China. Two stocks. And then finally, SKH Highix is going to do their listing tomorrow. From what I've heard, it's seven times overs subscribed. So I just thought that was a good riskreward b ratio. That's why it was my final trade and that's why I bought it after after the show yesterday. >> Jimmy is a is a bottom in. Who knows? Like I said at the very top, good luck trying to make that call because when you know people have felt like, okay, the space looks like it's bottomed because it has bounced. 2 days later, it's back down again. And we're witnessing that this week again. But I made the point of what you told our viewers. >> How could you not if you liked it, I'm talking about you specifically. If I made the case that I liked Micron a week or two weeks ago and now it's maybe lower or about where it is because it's been bouncing about. Uh what are you going to wait for? Like what is the signal that you're looking for? Right? You're just looking at the fundamentals and you're like I believe in the fundamentals as much today as I did then. So I'm willing to make a bet that if I don't catch the exact right place, you know, I don't know 6 months from now, a year from now, is it I don't know if you're going to hold it that long. Is it going to be higher than it is today? Well, I believe so. So, I'm willing to double my position. >> Scott, I I can't overemphasize the point that you're making, which is that we cannot call bottoms. All right. And I don't think anybody here does that. We may say things like look like they're turning. Yesterday, I thought I saw a signal in Micron and I added to it. Um, but actually, by the time we were talking this time yesterday, Scott, you'll remember I thought, hey, maybe that signal was a false signal. So, to be helpful here, knowing that none of us are going to tell you where the bottom is because that's not doable. The most pertinent advice I can give anybody watching is stay true to your knitting as far as what type of an investor you are. If you're a momentum investor, don't suddenly become a fundamental investor. If you're a technical investor, don't suddenly become a momentum investor. You in in this rapidly rotating market and it's actually to me it seems Scott like it's every day. >> What do you mean? Aren't you defining what you are you're you're going against what you're doing? >> No, I'm saying that fundamentally Micron is a value stock to me. Now, this is debatable. That what I just said is debatable. I've had other value investors come to me and say, "No, it's not a value stock. You shouldn't buy a stock, a cyclical stock like this at low earnings near the top. That that's usually counteryclical." However, I am adamantly saying that I think this is a fundamental buy here based not just on the valuation, but the strategic contract agreements they have, the fact that they're going to start returning uh capital to shareholders soon. But I don't want to get lost in me personally. What I want to say is with these rotations that are happening every day, you have to stay true to your knitting because if you think you're all of a sudden going to become a momentum investor, you're likely to get the trade wrong. And it's interesting though, Scott, and maybe this is what you were pointing out is that at times certain styles will intersect. So I can be a fundamental investor, a value investor getting into Micron, and yet still it is a momentum play. They're not mutually exclusive. But please don't start changing your cooking along the way because you think you know where the market is rotating next. Nobody knows. >> Marvel, Intel, AMD, uh they're all bouncing pretty hard today. We can cycle through those. As I said, there it is. Pretty good example of what we're talking about as I send it to to Jason. Yeah. How do you how do you see this trade? >> Yeah. Yeah. So, I [clears throat] think I think there's a lot to say here. I think one of the things that I've been considering as I'm kind of evaluating what's happened over the last couple weeks is is this really a rotation or is this a rebalancing? because the the price action has been somewhat orderly on July 1st. You're starting to see um obviously what has gotten us here pull back. We've seen obviously healthcare and and uh financial services uh really start to move forward and then we're seeing a lot of this push and pull over the last few days. So I think to to Brin's point what she what she said earlier about Micron representing 15% of the earnings growth in the entire complex is a significant story. I think muscle memory does come back and a lot of what got us here will continue to pull us forward and I just think we're just in this period where we're we're trying to find from a positioning standpoint where we need to be in the second half but I continue to believe in as as Jimmy is mentioning Micron which is obviously up a ton this year 257% it's trading at seven times earnings >> you think it's a value stock >> so I I I think it could be both right I think at this point because of their earnings picture going forward this is a story where value investors are interested in plays like this, but at the same time, the momentum is there as well. So, I think that's why it's kind of playing in this interesting sandbox where it's getting the price movement that it's has. >> I mean, maybe maybe Nvidia falls into that category, too, just given where it's, you know, valuation uh has gone. It's it's in the, you know, MTUM uh ETF. It's been pretty volatile. Hasn't gone much of anywhere. If you back that out, you know, year-to- date, you'll get a better look at really what Nvidia's done. Uh, as you know, people wait for this stock to to get going again. It had that draw down in the late spring. It had a nice pickup and now it's been back doing a little bit of nothing. Stephanie Link joins us now because uh this is a big deal for her. Uh, you bought Nvidia, so it's nice to have you. Thanks for joining. Tell us why. Tell our viewers why this was the time to [clears throat] do that. Yeah, I I've never owned Nvidia um regretfully, but it's the valuation that is very compelling to me for what you're getting. This is best in breed on sale, and that's what I like to do. It's 18 times PE. It's 15 times EBIT DA. This is the cheapest the stock has been since 2019. It has underperformed the group 53% year-to date. In the past year, it's underperformed the group by 72%. So, it's been a big lagard and I think it's going to play catch-up because the fundamentals are extremely strong. This is a company that has 97% market share in server GP in the server GPU market. They have proprietary software platform. They've got new compute platforms that are coming. They're even getting into expanding into CPUs. So, this is a company that actually grew earnings 130% year-over-year last quarter. Revenues of 85% gross margins in the mid70s and it's sustainable there in my belief. and free cash flow is going to double from this year to next year to $26 billion. So, I think the fundamentals are very strong. I don't understand why the action has been so poor, but I think the valuation now makes so much sense to me um for the long term. >> Josh, good move here. >> What do you think? >> I look, I'm anytime Stephanie and I agree on a stock, I I feel way more confident than when she and I disagree. Um, and Stephanie and I have been talking about Nvidia on this show for the last 15 years, and she's made a ton of money in names like Broadcom that have been rallying right alongside, but we're just on behalf of the Nvidia shareholders, we're thrilled to welcome her with open arms. I I would point out there's a little bit of a shareholder transition in Nvidia taking place. I think a lot of the action that you're seeing in Micron, those are the same people that were attending earnings release parties in Manhattan. two summers ago for Nvidia, >> the the momentum crowd has completely left the stock. I know there's a remnant of it that's still held in MTUM and some of the big momentum strategies, but it has not been a momentum stock in a long time. I think it's better than a momentum stock. I think now what you have um is a fairly uh low risk to the future outlook. I agree with what Stephanie had to say there about the proprietary platform. That's why I've been bullish in the stock for a long time. and uh you don't have to pay a 4050 multiple on this thing like you might have to for some other areas within semiconductors. So I I think it's great that she's in and I hope we make money together. >> Brenn, what do you think? >> So obviously glad to have you in. I've been in it for a long time. I had some of my position get called away at 200. I do think it's important though. I get that the company is cheaper today than it's been in a long time. But I do think when I go back, I want to say in at the end of 2022, it had a market cap, I think, of around 350 or 60 billion. We're just shy of 5 trillion today. So, as a longtime investor, I kind of ask myself, is this four to five trillion somewhat like upper Earth orbit that we can't get past? Because that's such a big number. and that even though they continue to surprise the stock gets cheaper, it is a$ five trillion dollar company. And so that that's that's why I'm comfortable once again still selling calls because the stock just gets cheaper and cheaper. Jensen saw all of this coming ahead of time. So I think the stock should be much higher, but I'm just questioning will the market allow a 5 trillion company to go to 10 trillion? I don't know. It may take a long time to do that. But great ad, but I still like selling calls against it. Yeah. Hey Brent, our mutual acquaintance, Adam Parker, has been writing and talking about Nvidia as though it's not just a company, it's an asset class. And you know, some people will dispute that and they'll say there's more competition coming and they're not just going to own GPUs forever. And that's fine. But um I do think if you look at the earnings growth since that time that you referenced then in 2022, earnings growth is actually outpacing stock price and market cap growth, which is why it's cheaper today than it was four years ago. >> And I think so long as they can continue with reasonable levels of earnings growth, there's no reason why 5 trillion has to be a hard cap. >> Right. Right. But I mean earnings growth typically does outpace stock growth. I mean, the earnings growth of Micron is is three-fold of the stock price over the last year. And so, that to me is is normal. Once again, I'm in Nvidia. I love Nvidia. I think Nvidia should be higher. I'm just saying that it seems to be in the penalty box. So, when I look at it, I'm saying, why is it in the penalty box? And so, this is just anecdotal. Is it because it's just 10 10 or 11xed over the past uh three and a half years? And it's a $5 trillion company. It's like the biggest company in the world that the market's just like, "Okay, that's enough right now." Cuz it shouldn't be in the penalty box, but it clearly is. It's negative for the year. >> Mhm. Steph, I'll give you the last word before we go. >> Well, I mean, I think you've seen massive rotation out of Nvidia, by the way. Also, Broadcom, these were the leaders for years and now they are the laggers. And I think the fundamentals have only gotten better and the visibility has only gotten better and yet the valuations have pulled back. So, look, I own Marll and that thing scares me because it goes up a lot and goes down a lot and I'm up 200% in it. So, I I I own some of the momentum in in semiconductors, but I think the real way I like to invest is buying low and selling high. And this thing is in the penalty box. I don't know if I would use that word. I think it's too strong. They've done nothing wrong. And earnings revisions have gone up over the last three years. And I think that's going to continue. So eventually fundamentals matter and if you can get great fundamentals or even if they're good fundamentals at a discount, I'll take that any day. >> All right, good stuff, Steph. Thanks for joining. We'll see you back on the desk. I'll see you this afternoon, by the way, on closing bell. So we'll get into more of that and your broader market thoughts, too. But that's that's our own Stephanie Link. By the way, guys, I mean more um according to Morgan Stanley Wealth Management's Global Investment Committee, the MAG 7 stocks are the cheapest in a decade by at least one measure that they look at. The valuation premium over the other 493 of the MAG 7 is now at 10%. That's what they suggest is the lowest in a decade. Goldman's desk today, we like buying the dip in the hyperscalers. So, is this a moment to to take a look at a lot of these names? >> I think I think we're leaving a really important chunk of this conversation out. Why is that the low is it at the lowest premium to the rest of 493? Maybe it's because with one exception, they're taking over 100% of their cash flow and spending on capex. >> And historically, the market does not give a premium to companies that do that. In fact, very often it's some sort of an industrial conglomerateesque uh discount to the overall market. So, uh it's not a mystery. Nobody's scratching their head. I think everyone understands the the dynamic has changed. These used to be companies that we celebrated for their assetike business models. They have gone in the other. I'm not saying it wasn't a good idea. Not saying the earnings won't eventually come. I'm not saying there won't be profitability from this activity. But right now we're in the building phase, not the harvesting phase of those profits. Hence why these stocks no longer have the premium valuation they used to. >> There's a good it's a good debate as to whether to look at the declines of say off their 52- week highs of a Meta down 25% or a Microsoft 32% and then Amazon you know Alpha Better about 13 and a half respectively each of those off of their 52- week highs. whether now is an opportunity like some of these desks say to buy the dip or if it's a signal within this market the way that the makeup has changed a little bit over the last month or so to pull back some of your exposure. I thought Black Rockck's Rick Reer who was with me on closing bail yesterday had a really interesting perspective on that. He loves the mega caps. He has. He likes tech. He probably likes it or has at least liked it better than most things. And yet here's what he said. We have rotated within that universe and I would say uh how do I describe it? Some of the companies that are more directly tied to AI, we've pulled back a bit and and rebalanced a bit and some of that are less haven't been associated necessarily with AI per se. I mean, they're all AI related, but the ones that are less acutely focused on AI. So, we've done some rebalancing within that. >> Okay. I mean, I thought that was pretty revealing yesterday from from Rick. um you want to react? >> Well, I think this depends critically on your time frame. If you have a time frame of 1 month, you know, maybe the Mag 7 isn't for you. However, if you have a time frame of 3 months or longer, these things are for the most part buys here. Um, you know, I could look at a Meta or an Nvidia for that matter and say it's a value stock. I could look at the price to earnings multiple on both of those names and say they're below the market multiple. So, by the way, is the PEG ratio, which Scott, you know, is price to earnings over the growth ratio of earnings. And for value investors, that's a critical measure. Um, so I do >> and he's not a one-month investor, by the way. You know, I don't know what you mean about the time frame. >> I I was not imputing Rick Reer. I was simply saying to those people who are asking, is it a buy? Is this sector a buy right now? I wouldn't make that call over the next month. But past that, I would. And here's the important point going back to what Josh said. Absolutely right. These stocks, these companies are sinking all of their free cash flow into capex. Think about what it's going to look like a year from now when they're reaping the reward. When that free cash flow reverses the other way, meaningfully positive. These companies, we're going to look back on these prices and say, "What were we thinking not buying them here?" >> I don't know, right? Unless you think that there's been a a sea change within the the market, uh the makeup of the market, if you truly believe that it's changed and there's, you know, more money going to go towards other areas like financials and healthcare and some of those more underperforming areas, then, you know, maybe they're not such a clear-cut buy today. I think that's what you extrapolate from reader and how you would counter, you know, Jim's argument that how could you not like these here? Of course, they're they're buys if you're a longer term investor. Well, maybe not if you think that over the next for the next 6 months the makeup has has truly changed. >> Yeah, I think it's an interesting place. Obviously, $700 billion in capex sticks here. It's only going higher. You know, the plan is 900 to a trillion next year. And uh to to Josh's point, I mean, typically we're not giving a market premium to stocks that are spending in the way that they're spending. However, I do think um the multiples have come down enough where they become interesting to to the to my point earlier, they they are more appealing to different types of investors, not just growth investors, potentially value investors that see the opportunity in the long term and see there's maybe some visibility on profitability. So, I think that that's what makes them interesting to me at this point. >> This is the question. There's only one question that matters. Where is the value of all of this capex most likely to acrue in the end? >> Mhm. >> I gave you my answer. I've been saying all year. I gave you my answer. It's Apple. Apple has 2 and a half billion uh users that I think they will serve as the gateway to consumer AI through those devices. Um that's that's my and Apple's not spending the way that the other six. >> That's probably why it's only three bucks off of its alltime high. >> Well, I think it's going to print an alltime high right now. But look at um look at the way it has separated itself from all of the AI capex spenders. >> So like who built the internet? AT&T, Verizon, the like who built that out? Who benefited? Kevin Cystrom sold a company with seven employees for a billion dollars called Instagram to Meta. Like where do the profits of this buildout acrue? I I I really think it's going to be the companies that own the other end of it. I I'm not saying they will not make money. Uh and obviously some of them have the double benefit of we're also the LLM like Alphabet, right? So Gemini will profit heavily from the expense that Alphabet, the parent company, is is plowing in. But it just gets murkier. It's harder to figure out. So I think the market is asking this question and trying to answer it every day that it opens up. Where will the profits of this buildout acrew to? We know a lot of them are going to the semis already. Mhm. >> We know the semi- capital equipment names. We know the memory names. We know the electrification of the data. We know that a lot of profitability is acrewing there. >> How much of it will be left with Microsoft for the buildout and all this capex? I'm not sure that the market is as confident. >> R. >> Yeah. I think that to turn Josh is to think through where will they not acrue to me is an easier kind of concept to think through. And I think from a consumer perspective, Josh is spot on. We don't want another device. I definitely don't want an open AI device. Okay, Apple from a consumer, I think they crush it. We're going to spend more time. The enterprise level though, to me, the big question, and I own Microsoft, is I don't know if Microsoft can execute on this, right? because I'm more and more feeling that their version is more like Teams and Zoom should not exist as a publicly traded company with a $28 billion market cap because there's teams but Teams is so mediocre and so I I think that if you think Oracle that's a big question they are tied to open AI and so I think when you think through who are the winners that that Apple from a consumer I think the enterprise is much more complicated and to me I think Microsoft their cloud business is fantastic but the money they're spending. I just don't see the output because we use it uh that that you're getting with the other LLMs. So, to me, that's an easier way for me to put my arms around is who are the losers, not the winners. >> Just Jason, is this the winner in the group? Apple, I mean, it's funny narrative, you know, it's changed. The stock charts changed, too. For for a while, as everybody knows, it was they have no AI strategy. What are they doing? What are they doing? And you saw the stock kind of, you know, not not give them much. then they get the benefit of the doubt because they're getting it together at the same time that they're doing what Josh was talking about, not spending to the level even close of what everybody else is doing. And now I think in the long run they've been rewarded. That's why the stock is less than 1% away from from an all-time high. >> Yeah, I think I think that's absolutely the story, right? And that and that has always been the narrative around Apple, right? Kind of wait and see and evaluate what the others are doing and then we kind of seize the moment and do what we need to do from an execution standpoint. I definitely think they're getting uh you know market favor and not spending to the to the likes of what the other hyperscalers are doing. I think this transition to Turnis who is a software engineer um and and looking at their product mix I think is going to be an important story too going forward. So, and this these multi-million dollar buybacks, rinse and repeat. I think that story continues. And I think that's why >> it's a hundred billion dollar buyback now. And September 1st is the first day of John Turnis officially taking the reigns >> and probably the announcement, his first keynote, probably the announcement of the foldable. >> The foldable will move the needle on earnings because they're not going to be able to make enough this year. Talking about half a million maybe to a million units shipped um by the end of the fourth quarter. But iPhone 18, it'll be 20 to 22 million units shipped. Um, should be a significant improvement in Siri AI. Aentic Siri, bring your own LLM. Tell the consumer, "Okay, what do you like? You like uh chat GPT? Great. We'll we'll layer right on top of your existing Chat GPT account. We're getting paid in the app store either way." Oh, you don't like that? You like Claude? Hey, we can work with Claude, too. That's what the consumer wants. To Brin's point, the consumer doesn't want a walnut shaped uh box that Sam Alman built sitting in their living room. I don't know anybody that's looking for that. So, I think Apple by by not playing the Capex game, swoops in and says, "Hey, great job. Thank you for building um thank you for building all these LLMs. We really appreciate it. And thank you for building the data centers that will distribute them. we're going to give our two and a half billion devices access and uh we're going to get paid. We don't really care who wins. From my perspective, that is what the market is figuring out. That's what this chart tells you, which is not even a V-shape. It's like it's even better than a V-shaped uh recovery in the stock. >> Yeah. About to make a higher high, too. All right, that's Apple. We'll watch it. We'll take a break. Calls of the day coming up to debate. Plus, Josh Brown's best stocks in the market, the one big bank he is watching ahead of earnings next week. we're back into. >> Okay, so that was the very first clip and we will show the second one right after I do a quick analysis of the stocks and ETFs that they just discussed. Uh there were 15 listed here and just one of them actually passes the technicals test using this indicator Ichimoku AMD. All right, so I'll explain why. Let's take a look at the weekly chart here. AMD advanced micro devices price is above and we'll get rid of some of these lines just so you can it's more clear. It's above the the tenkinen which is the nine period the midpoint to the last nine periods. It's above the 26 period the midpoint of the last 26 periods. It's above the ichimoku cloud what you see right here and that is comprised of two lines the synchan and sync span b they are in the correct order and then the lagging line is above price. That's the chico span. So the fact that we have price uh this line above c the candle here that's very important. That's the current price projected 26 periods into the past. So, I like what I'm seeing here on the weekly. I like what I'm seeing on the daily. Um, the only thing with, you can see here, it broke above the 9 period on the daily chart as well, and it was up 5.66%. The indicator below, the directional movement index is starting to show some strength. You can see the ADX slightly moving up, the green line is moving up, the red line is moving down. That's what you want to see with this particular indicator. That's very positive. And uh we already have that here in the weekly with the green line above the red line and ADX moving up. It has slowed down a little bit like I said it's been for the last four weeks AMD if you look closely here has been stuck in a box right has just been in a range but it is holding up nicely still on the weekly chart because it has not broken that tenins yet the 9 period and on the daily chart it's above right now. So this is really good. Let's look at the rest of these and why don't these meet the criteria necessary uh to get that blue flag. Well, although it was up88% Apple, if we throw on this um level of 31740, it's based on this prior high um is it that level or that level? Oh, it's that one right there. Okay. So, it's from June 8th. You see that shooting star type candle led to this decline. We are re kind of trying to retest that area. We're we're right under it at 31616 is where price closed today for Apple. It needs to break above that 31740. That's my opinion. [snorts] Um the ADX below is still moving sideways. So I'd hold off on Apple for the time being. You look at the weekly chart, it looks pretty positive except again for the daily which is not quite there yet with that faster moving average under the slower one. Okay, that's that's the negative right there and it's under this resistance level. Amazon is inside the cloud. One of the rules of Ichimoku is you don't want to be adding positions when price is inside the cloud. Why? Because it's still in a in a established downtrend. I recognize that you might miss some of the move, but you're taking a higher risk trade when you do this. Okay. So, yes, we have uh actually moved up about 8.7% 9% almost from the lows here from June 26th. And the fact that we broke above that 26 period is also quite bullish. There are some traders out there that like to take small positions. Maybe you start off with a half position as a tester to see if Amazon can continue to the upside, but there are a lot of negative things going on with this chart. And so personally, I wait for everything to clear. And so the cloud itself is still bearish with the single span A under the single span B. You get the lagging line is still under price. That's not good. And the faster moving average is under this slow one. The one positive is we are above that 200 and that's really important and uh the momentum is not hasn't really started to to move up quite yet. You can see the white line is still dropping. So Amazon's not something I'd be uh interested in at this point. DR AM is not something I'd be interested in. This is the memory ETF. You can see it's in a downward sort of um pullback here still even though it was up 3.71. It's right under that moving average. Google. All right. Um, as you can see here, is also inside the cloud and so I would hold off on this one, too. Now, the good news with Google is it did break this um this trend line here. Okay. And it seems to be it came right down re is retesting that specific trend line. You can see that right there. So, we might see a bounce here and break through the cloud, but I would not be adding personally myself. INTC um is looking interesting because it found support right at the cloud and gapped up 2.09%. Right? But the directional movement index is still negative. Red line is above the green line. And uh the other thing I would say also is um if you look at the weekly chart, we're still under that 9 period. So no on Intel, the MAGS ETF. Let's look at this on the weekly chart. What does this look like? Well, we just broke above that 9 period, which is good. Uh the daily chart, it's see that high right there, the high of 6692. We're right under it at 6676. It needs to get above that level. All right. And it's still inside the cloud. So, no on this ETF for the time being. Meta broke through the cloud, but it has more resistance right above it. actually this declining 200 which is a very strong level of resistance. So Meta is not something I would be touching at this point. The cloud itself is still bearish and so yeah that's the daily chart and here's the weekly. It's right under that cloud. [clears throat] So that's why it's important to also look at that weekly chart so you can kind of get a sense of what's going on on a longer term time frame. Right? So the trajectory here is still negative. We're in a downward channel and that's not positive guys. It's not positive. So, you don't want to see these lower highs and lower lows. It's not good. Now, this is this might turn into something because you can see that we may have right here that we actually do have the very first higher low, okay, for meta. Um, but what we what this also creates is something called a symmetrical triangle. And so, it needs to break through that as well and get above that cloud. Marll has pulled back on the weekly chart. It's still currently under the 9 period. We'll see what happens tomorrow on Friday. Okay, here's the daily chart. Still under the moving averages. No, I would say no on Marvel, even though it was up 4.99%. Look at that red candle. What that represents is that it gapped up and then the sellers pushed it down slightly. Here's a three-minute chart that shows you exactly what happened. Here's the gap up today. All right, in the morning, price moved sideways and then started dropping. Let's take a look at the next one. Microsoft, which is still under the cloud. So, this is certainly not something I would be considering. It's in a downward channel on the daily chart. Okay, we were seeing a little bit of strength, but it's just up 27%. Nothing to get excited about here. Micron also gapped up 4.52%. But notice what happened by the end of the day. It developed a red candle and that is not positive. Again, switching it to a threeminut, we can see exactly what happened. We we'll see the gap up and we'll see the decline throughout the day. Here's a three minute. There's the gap up and the decline, right? So, from the high of the day, which was around 10 a.m., it dropped about 4.39%. That's a pretty big drop. It still managed to be up 4 and a half% because of the gap up that happened, you know, pre-market after hours. So, let's look at the next one. Nvidia. Okay, so that's a threeminute chart, but let's look at the daily. Here's the daily. It's entering the cloud. It entered it yesterday, but it's and it's still in it. It was down66%. The chico span here, the lagging line is under price. The cloud, the future cloud is bearish with a seno span a under seno span B. You look at the weekly chart here. It looks a little bit more bullish. It has more potential. Uh but it's still a messy looking chart on the daily and you can see I mean very clearly that this is still in a downward channel. Okay, what else? We got SMH here. We'll look at this. the semiconductor ETF which is still stuck inside this box. It's under the moving average here. The nine period and the 26 which have merged the red line and the green line have merged right there. Uh and again selling happened towards the end of the day around let's see what when did that start happening around 2 p.m. or so price just dropped about 1%. The socks SOXX which is a semiconductor sector index fund. Okay this is was up three and a half%. Let's look at the daily chart. Same type of chart, right? They all look pretty similar because they're all in the same space. Zoom. Okay. Jumped a little bit. 2.84%. Got above that 200. But, you know, we've been stuck in this range for a little while now. And I would not be touching this. It's still under the cloud. Still under the 26 period. And the cheek span here is still underpriced. So, no on Zoom. Let's get back now to the next clip and then I'll do analysis of those stocks right after. >> City's got a call on software today. Top picks MongoDB Snowflake and Palunteer. I don't know how you guys feel about this space. Jason, I'll give you that. You You have Snowflake. Brenn has Palunteer, but go first with this one cuz you have Service Now, too. >> Yeah. Yeah. Yeah. So, so for me on Snowflake, um, you know, the early part of the year wasn't great. Wasn't a great start to the year, but they really had a strong report last quarter. EPS was up 68% 33% revenue growth. The northstar for them in terms of revenue growth is 30%. um new deal with AWS. I I what I will say in terms of their consumption model, those results can be fairly inconsistent. Um but this is a stock in terms of data warehousing and all the capex spend that we're seeing in this in the whole ecosystem is one that's worth pumping. You wouldn't if you if you listened to the the whole narrative and debate about software, you wouldn't think that that any of these names are are having a decent year. This one's up 21% year to date. It's been really easy just to think that all all of software X cyber >> right >> have been dogs right this this one has not >> no there's no doubt about it and and you can't be I think what we've seen in the early part of this year and you know year to date you cannot be indiscriminate in this space right there there are certain names that are working far better than others obviously Service Now is on the other side of this right but I do think there's continued upside but I just think Snowflake the space that they occupy um is a strong one so I continue to like it service is down significantly on the year about 30%. Goldman's reiterates by though today. You want to take that on? >> So I think I think for them as it relates to service now they're they're agentic AI tools. They're really embracing the space. I mean I think what we talked about early part of the year is AI is going to replace these traditional SAS models blah blah blah blah blah. I don't think that's a story with these particular companies. I think now the price action hasn't been nearly as strong but you're starting to see some momentum over the last couple months. It's just pulled back recently but there is some momentum there. And I think this one is also worthy of ownership. >> Talk about things that have roared back. >> Yeah. >> Uh cyber. Okay. Crowd strikes up 68% year to date. You go through almost almost all of these names. Paulo uh Fortnet crowd's target goes to 235 at needm today from the the anthropic news killing cyber conversation that's feels like it lasted about 10 minutes cuz the stocks have come back so strong. >> No, that that's right. Jason's right. The SAS the SAS apocalypse phase where everything just in indiscriminately if it was in the software ETF it was being sold. Some of that was people having genuine concern about certain business models and like Salesforce being the poster child or Adobe maybe. And then some of that is just like wrong, you're in the wrong neighborhood at the wrong time of night and you're just getting mugged. But I I don't think we're doing that anymore because Crowd Strike is a great example. This is a company that has effectively made the case to the street. More AI means more cyber security threats. Ergo, more AI means more uh cyber contracts and more pricing power and more stickiness of the things that they sell to the enterprise and government customer. And that's what's borne out. A arr grew to 5.51 billion, up 24% year-over-year in the last quarter they reported. Free cash flow hit a record 468 uh million which is 34% of revenue. Operating income, another record. Um, the rule of the the rule of 40 score here is 59. There's like maybe three other companies you could point to in the public markets that have done what George Curts has done. So, I'm a long-term shareholder. They just did a four for one split. I haven't sold any, will not sell any. And I think it's a great example of how the market is getting smarter about disruption risk and stratifying the software names rather than just universally hating them all. >> All right. All right. We're back. Josh Brown's best stocks in the market. What's that? >> Thanks for that. >> Yeah, that's just >> Scott's like, "All right, here's your big segment coming up. Let me read some mean tweets to you." Commercial break. >> I thought it was funny. [laughter] >> I'm going to read some tweets to you on the next break. All right, City Group, give me like the ultra long-term chart real quick. This was a very, very, very impossible to own stock. This was an ugly duckling coming out of the great financial crisis. They basically spent 15 years attempting a turnaround in fits and starts. And then finally a few years ago, um Jane Fraser is the new CEO, somebody who behind the scenes had been pulling off deal after deal after deal to streamline this bank, not in the CEO role. She gets the role and all of a sudden Wall Street, look at this, uh off a cliff. No L-shaped recovery they call this. Um anyway, that was then, this is now. city is up 65% over the last year through July 7th. Congratulations to Jimmy uh Labenthal who's been a believer here. Um that's versus 33% for PNC, 25% for BFA, 18% for JP Morgan. So this has been a standout name in a group that's starting to catch fire. Um but again, the 20-year annualized return is -4%. The only negative number amongst the large cap banks. So I still think there's room here. This is a very different company. International services is the crown jewel. They have doubled and tripled down on that while getting rid of uh businesses where they don't really perform very well. And that's been the secret shrinking in order to grow more profitably. The company has earnings at the end of next week. Um this has not been a consistent like you want to be in before the earning story. We've seen it go up a lot. We've seen it drop a lot. So don't use that as a catalyst. I think instead focus on 110 to 115. You can see in this chart that's the 200 uh day moving average give or take. The stock has obeyed that trend all year. This has been on the best stocks in the market list since last August. It's been in my porter house portfolio at my firm since inception and it has not gotten anywhere near that longerterm trend lines. That's where I would manage risk from. Whether a trader or an investor, I think it'll it'll just fine as long as it stays above. >> Jimmy, >> um I agree there's more to come. Uh there's a lot more to We've got the Banamex spin out coming out sometime in the next 6 to9 months or so. And when Cityroup announces that it's coming out from under the thumb of the Fed and other regulators because there's various consent orders out there, I think that will move the stock higher. It's still attractively priced. Importantly, Josh, this is another one of those areas where different styles of investing intersect. So, this is one of your best stocks in the market. You have the metrics by which you define that. This is uh still a value stock for me. There was a period of time when it was a deep value stock, which is the technical term, Josh, for ugly duckling. Deep value equals ugly duckling. Um, but these styles of investing can intersect. There's a lot more to come on this. As I've said, it's still attractively priced. >> Yeah. Best quarterly revenue in a decade last quarter. 56% jump in earnings per share from the prior year. You like you can say this is still cheap based on that kind of earnings growth. um and have room to say and also I respect the trend here in the momentum. You can say you can walk and chew gum at the same time. >> Really do have to give a hat tip to Jane Frasier. She's done a fabulous job. The first three years in the seat she was given no credit. Finally, the last two years they've given her credit. >> Financials are sort of one of the top sectors this month. We know that bank earnings kick off next week. Is there a reason why we don't have more buying in this space on the committee? Jason, you've got Goldman, you know, Josh is JP Morgan >> and Citizens. >> Jimmy, your your city and and JPM, but you know, there's a belief that what's been a what was relative to tech, obviously, a a lagging sector is now woken up. >> Why isn't now ahead of earnings the time to get a little more exposed here? >> Yeah. Well, traditionally, we don't um just because of the potential volatility and stuff, but I but I do I'll I'll say this. Um, from a positioning standpoint, let's guess what? Financials were up about three and a half% last week. Goldman is my name here. I mean, IB revenue was up 48% last quarter, right? And I think capital markets will continue to surge. Um, the stocks up 20% year to date. It there was some pullback on recent weeks, but it's starting to get back some of that momentum. Um, but it's it's just not what we do. But I continue to like the space and IB is our favorite name in the in the >> I financials are expected as a group to grow earnings by 10.7% over the next 12 months. That's not screeching hot growth and it certainly doesn't look like the tech sector, >> but it's growth nonetheless. And these it's not as though these stocks were selling at above market valuations or even above their own historical averages. The earnings growth again has been outpacing the share price growth for a lot of the biggest components in the financial sector. >> All right, Brent Hawington, what's your final? >> CBRE looking for 26% earnings growth at the end of the month. >> Thank you very much. The sniper, >> Nvidia's trades here, 87% earnings growth. The farmer >> city group just repeating earnings are coming up. >> JP Live Nation two price target lifts today. One from Wells Fargo at 2:22. >> All right, good stuff. I'll see you at 3:00. All right. So, in this video, we're going to take a look at some of the stocks, ETFs I just discussed. Not all of them, seven of those right here. We'll take a look at 12 additional ticker symbols. Gold, silver, Bitcoin, Ethereum, Copper, the Q's, the Russell, the SPY, the Dow Jones ETF, DIA. There's been some changes that happened recently. So, this is a really important. Let's look at the technicals. Let's start off with the Crowd Strike. And it was up 3.81% today. This is the daily chart we're looking at right now. it actually broke above this resistance level of 19641 based on this prior candle going back to June 1st. And so that's that's an important thing. The only problem is we still have an additional layer of resistance 20950 based on this candle on the daily chart. So if you look at uh the July 6th uh candle, we had a high of 20950. We have been stuck in this little range now for the la for the next 3 days since, right? And so it needs to clear that that level. Um and once it does once it clears that area, let me just show you guys something. That'll be all-time highs for Crowd Strike. So that's that's really important. Um in fact, from the high here of 1995. Yeah, I mean we'll be we'll basically be doing pretty good with Crowd Strike. So that looks pretty strong. I like XLF as an ETF, the financial sector ETF. You can see the pullback that we had these last few days. So this all started on July 7th with this reversal candle which led to the decline yesterday. Price stalled right on the 9 period. Whenever price is above and pulls back a lot of times it will find support right at that level. If price is under gets underneath the green line it usually finds resistance at that same level and then once it breaks through it has basically um you know sort of open space to move up. Now, the good news is we've got a bullish harami on the daily chart. Let me show you guys what the weekly chart looks like as well for XLF. So, XLF we did it looks like we might end with a reversal candle by the end of this week on Friday. We need to wait for Friday, of course, for tomorrow's uh action to come through. And, you know, you never know. The financial sector might pop even more and then break through that 5651 level. That's very possible. Uh that's a a weekly level. Let me change the color so we can it represents that more clearly. It's based on that candle. And then we'll be hitting all-time highs for XLF. So very really important to to pay attention to this. In fact, actually, I'm going to start using uh yeah, that's a that's a uh the high there is 5659. I'm sorry. Let me fix that. We want to be specific and exact on these levels because this is the most recent high that it needs to clear. 5659. Okay, which is pretty close to that level right there. Anyway, um I like it. And let me show you guys something. This is the bullish harami. Let me show you guys what that looks like. By the way, look at the markets today. All indices were up. We're going to get into that in a second. But if you come to my X page at BlueCloud Trader, you scroll down, you hit that highlights tab, and you scroll down a little more, you will find this candle pattern reference sheet, which is very useful. So, I'm going to show you guys the pattern I'm talking about. The bullish harami would be found under the bullish column here. You look under the double candle patterns and it's this particular pattern right here. It's a large red candle followed by a smaller bullish candle that sits within it. Okay, so like think of um Harami in Japanese stands for pregnant. There's the big body and the small body right there. So that's really bullish. Okay. Um let's get back to that chart. That's what we have right here, a bullish harami pattern. So there's a higher probability. Okay, there are no guarantees in the market, guys, but there's a higher probability more than 60% that this thing is going to move up tomorrow. So, I like XLF. Let's look at the rest of these. And and uh you'll notice they do not have a blue flag because there's something off about these on either the weekly or the daily chart. Snowflake. Well, let's start off with the weekly chart here. On the weekly looks quite bullish, actually. All right. Um price is above the tenkensen the keyunen above the cloud. Chica spin is above price on the daily chart. The only negative thing the only negative thing I'm seeing on this on this chart is the lagging line. The white line is actually within the candle. It's not above it. Otherwise, I kind of like what I'm seeing with snowflake. I think this it has a high probability here of breaking through that 284.99 level. Just today we had another bullish crossover here where the faster moving average crossed above the slower one. So that's really that's really important. Uh you know Snowflake as a company we look at a monthly chart their highs have been 429. you know it has had dropped from those highs there quite a bit and uh you know even from this from this high here for example it had dropped approximately 73% you know over the la over the last three four years or so I mean literally four years and we've been down 70% but since this low it's actually moved upund at some point uh around the $119 level it started moving up and it's moved up 124% right now you look at that monthly though it's still inside the cloud on the monthly. I personally like to use the weekly and the daily time frames for my trading. So, uh I don't put as much emphasis on the monthly. That's just too far out. Uh so, yeah, I like what I'm seeing so far. We'll see what happens with Snowflake. Uh I would wait a little bit longer for the breakout against above the 284.99 just to get some, you know, more confirmation. Service Now is currently under the cloud and that's bearish territory right now. We're still under that declining 200 day and we have a bearish cloud. So no on service now that's the daily chart. Here's Croup. It's currently under the 9 period but above the 26 period. One other negative thing I'm noticing here with with Croup is the um the negative DI9 has crossed above the positive DI9. That's not generally a good good thing. Uh you look at the weekly chart for Cityroup however and it looks more bullish. Um but these last three weeks it's just been um actually for the last four weeks we've been staying under the the high there of uh 14796. We're at 13957. So yeah, it's a it's like a pullback on the weekly and on the daily chart. It's a it's just uh right now I would hold off. That's all I would say on that. KBE yesterday. It gapped down right under the 9 period. Okay. And then today we got a bullish harami. Another one of those bullish patterns, but it st stayed under the nine period. So I'd hold off on KBE. Here's the weekly chart. This is the uh Spider S&P Bank ETF. It does still look very bullish on the weekly. Um CBRE. So this is in a downward channel on the weekly chart. I'll just show you guys what I mean by that. There's a high. There's the second high which is lower. And there's the third high that's lower than the prior one. So, we have a series of lower highs. It's stairstepping its way down. We got a series of lower lows. Do you see that low is actually this low here, I'm sorry, is lower than the prior one. That's not good. So, we got ourselves a downward channel basically. And we are currently inside the cloud. Uh this is the real estate sector. Uh one positive thing is we looks like we might get a positive crossover here. It did move up 081%. Uh let's this is the weekly chart. Let's look at the daily. Yeah, so the daily has been showing a little bit of strength recently. And look, there are some traders that uh don't want to pay attention to that weekly. I think that you're doing yourself a disservice if you don't also review the weekly chart and include that in your analysis. you'll have a higher probability trade on the daily if the weekly, okay, is also bullish and looking strong. Um, so yeah, we're starting to develop uh higher highs, higher lows on the daily chart and and it's in the beginning stages, okay, but it's not it's still right under that 200. It's about 5.5% away from the from the 200 day moving average right now. All right, let's look at the rest of these folks. And before we do that, I want to show you guys how the markets did very quickly. The Dow was up 27% at the end of the day. It's 4:53 p.m. Eastern time on Thursday, July 9th, as I'm recording this. Uh NASDAQ is was up 1.3%, S&P 500 up 81, and the Russell 2000 was up 1.28%. Um and you can see here the US stocks closed higher as AI and semiconductor rebound weighed outweighed easing oil prices and muted the US Iran tensions. But the US tensions of Iran are still there. It's just muted those tensions. And so things could over the weekend spike up. You never know. We shall see. Uh let's look at the heat map. You can see the consumer defensive stocks did not do so well today. They were mostly in the red. Okay. Except for MNST, the Monster drinks. Energy stocks didn't do so great today. And but the semiconductor stocks do well. Look at the grain except for Nvidia which was down66. Palanteer was down 2.4 but the majority of the software infrastructure stocks and semiconductor equipment and material stocks did well. Computer hardware communication equipment like Cisco was up. Uh so yeah I mean overall we had positivity in the markets here and if you look at the groups here we can see the sectors. You'll notice that today at least um let me make this up bigger. [snorts] At least for today, technology was up the most 1.71% followed by consumer cyclical and basic materials. Energy consumer defensive were the lagards. Looking at the one week performance however energy has been in the lead up 4.21%. Followed by healthcare, financial and utilities. Whoops, clicked on that by accident. So that's what we have there. Let's take a look at uh the Q's. And here's a QQQ ETF up 1.66%. See the symmetrical triangle right there. It's still inside of that triangle. Interestingly enough, even yesterday, you'll notice that uh we basically kind of stayed right above the cloud. We bounced off of that. So, this is really bullish actually for the Q's. The Q's and the Russell are the only two that get a blue flag because they they're bullish on both the daily and on the weekly as far as the Ichimoku indicator is concerned. We are still under resistance levels like 74865 for the Q's uh under 29949 for the Russell IWM ETF. Now the rest of these ETFs guys there's something off like the SPY for example. It looks good on the weekly. Okay. Although it has been for basically a couple months now. Uh just been stagnant in this little range. You can see this these are weekly charts or weekly candles. Sorry. So that's two months right there. Here's a daily chart that shows you even more clearly, right? It all started entered this box area probably around sometime in May, May 6. We have May, June, and we're getting into July now. July 9th. Here we are. And we're still basically in this range. The Dow Jones is currently uh under the the 9 period. Okay. The VIX dropped 6.45%. That's a bullish sign. The volatility basically came out of the market a little bit today. FEZ, the Euro stocks, it gapped up 49% um but stayed under the moving averages. So, I would not be considering adding a position here on that one. GLD, although it was up 1%, you can see we had a reversal type candle here, it's still under the cloud and still under this 26 period. We're still in a very embedded decline here on the daily chart. You look at the weekly chart. All right, we're still Let me just get rid of some of these lines. I have a lot of lines there. Uh the one positive thing, as I've mentioned before, is on the on the weekly chart, gold is starting to stabilize. And whenever price starts to stabilize like it is here for three weeks now, stuck around this range here, there's the option and possibility here that we might bounce. And it almost seems like that's exactly what's going on here. Um, by the end of this week, Friday, it looks like there's a higher probability we're going to stay above that cloud and maybe move up slightly more. Let's look at silver, which was up 2.48%. Silver's also finding some support right within the cloud, which is interesting. Okay. So, yes, it's in a it's been in a decline on the weekly, but it's it's finding support. And uh oil K that's under the moving averages still, but also stabilizing here for the last 3 weeks. Uh I think there's a lot of indecision about where the prices of oil are going to be. And so when that happens, price just kind of like starts moving sideways because it's all dependent on what happens and transpires in the Middle East. Bitcoin IBIT ETF up 1.6 65%. Here it is in the weekly. You know, these last few weeks, it's been moving up slightly, but on the daily chart, you know, it's still in a embedded decline. It's still under that 26 period. It's still under this prior high. We still have a lower low here. I wouldn't touch that. ETH, same thing with Ethereum, uh, under the 26 period here. It's been, how it's been stalling right at that 26, interestingly enough. That's the daily chart. Here's a weekly chart. still in a very embedded decline. And so, you know, you start taking trades in a place in a state where the price has been depressed for so long, how do how do you know it's not going to continue to the downside? There's no evidence here suggesting that there's a a change in the sentiment, right? Like a break above a prior high or a higher low. Okay, we don't have that. We're still in a decline. And so as long as that's in effect and in place, it just doesn't make sense just because price dropped because it can continue dropping. You can buy it cheaper maybe in the future. All right. Hard to to call the bottoms the exact bottom. You you we need to have enough data to to to establish at least the beginning stages, right? And that was something interesting that uh Farmer Jim said in the show, too. you know, it's almost it's impossible to like call the exact bottom um or the reversal point, right? Nobody can call that. But what we can do is observe what's happening in the markets and then if we see that the sentiment is changing, we see the volume start to come in. I mean, look at let's look at the volume here in Ethereum, for example. It's been it's been just kind of, you know, subpar. Look at that right there. There's nothing happening. It's under the 50-day over here where the volume spiked. It wasn't positive. It was negative volume because it price dropped. Right? So, that's my point. Let's look at copper. See, OPX is the uh ticker symbol for the Global X Copper Miners ETF. And this on the weekly chart is still under the moving averages. We also had a negative crossover here on the daily chart. Let me just throw in some support levels. We Okay, actually there's a lot of lines here. Let me get rid of that for a moment. I just want to show you guys this candle here is a bullish hammer type candle. That's when you have a long wick at the bottom that represents a lot of buying happening at the end of the day with price closing. The bulls won that battle. The very next day today, price gapped up and continued moving up. The problem is it's it hit its head right at that 200. So, this is not a buy signal. We're selling to the cloud and so I'd hold off on the COPX ETF. Now, uh if you guys are interested in also getting access to some of the exclusive member only videos that I produce, all right, these these videos here, if you're on my YouTube channel and you click on one of these, all right, you do need to become a member to access these. In order to do that, you need need to click the join button here. You click the join button. Uh now there are three tiers. You won't be able to see them the videos under BlueCloud supporter. You do need to select BlueCloud Trader first or BlueCloud Legend. Under either of these levels, you can see it. What's the difference between these two? Well, under BlueCloud Trader, you'll get that video once a week. Under BlueCloud Legend, you'll also get daily trade updates that I post on my port in my port, you know, for my portfolio. So, BlueCloud Legend, where do you get those posts? Once you become a member, there'll be a new tab that pops up over here next to posts. It will look like this. We'll say membership. And you click on that. All right. And um that's how you get access to those videos. And if you want to see some of the other links that I have, click on this right here. It says 10 more links. Find out a little bit about the channel. Scroll down. Here's the link for to become a member. So, here's a $25 coupon for the TC2000 software. That's this software that you see right here. You can get a $25 coupon for that. I strongly recommend you check this out. Um, because you can use it, try it out for a month for free with this coupon. I I'll show you what I mean. Once you click on this link, this is what happens. Brings you to this page. You enter your email here and you can download it for Windows or you can also run it on web or Mac. Okay. Now, you'll notice down here it says you will receive a $25 coupon towards your TC2000 service courtesy of BlueCloud Trading. All right, as long as you haven't used the service in the last 12 months, that's the key thing. Now, next, click on pricing, hit software plans and data. All right, click on monthly and see the basic is $24.99. So, that covers your first month as a basic. I would recommend that you try the premium though. There a lot more features here, including real-time scanning and sorting, being able to draw on the charts. That's an important one. The easy scan wizard for scanning through thousands of stocks. And you can build your own conditions like I have. I have a proprietary scanner and I share the results of that scanner with members every day, legend level members, uh, every single day, um, before the market closes. [snorts] So, it's stuff like that. And then you can also track uh alerts and everything else with this premium member membership. All right, let's get back for a moment. And then another link that you might want to check out is my Twitter page. There it is. As well as the Finn Viz Elite link. Finn Viz Elite of course is this platform that you see me uh showcasing a lot. And you can get home, you know, this is where it shows the charts live. Okay, so the data for the Finn Viz Elite is actually uh up to date. It's not delayed. If you're using the free version of Finn Viz, it's delayed by 15 minutes from what I understand. So just keep that in mind. Um you get access to the news, all right, from different sources. You see all the different sources there. Um, if you want to do a screener, you can do you can scan for different using fundamentals fundamental stuff, fundamental um, data. There's a technicals. You can actually scan for candles specific type of candlestick here. Check this out. Hear me talking about the hammer for example, right? Click on that hammer. Now it's only popping up all the stocks that are showing that the most recent candle is a hammer. Maybe you add a couple of other things. Um, let's take a look at some of these for a moment. Let's take a look at something that we're familiar with. Arch Capital, I guess. All right, let's look at this. So, there's the hammer. You see that last candle right there? Even though it's red, it's it is a hammer. Uh, let's look at APBO. There's another hammer right there. And it might not be the perfect location because it's under the cloud, but at least it's telling you something. And you can also throw on some other types of um technical. Going back to technicals, you can also, for example, um let's see, look for stocks that are above the 20-day moving average. Price above the 20, the simple moving average right there. Price above the 50-day moving average. Okay, price above the 200. And that sorts through many different stocks. It makes it a little easier to find some of these um these companies. All right, guys. That's going to do it for this video. Thanks for watching. I will catch you all in the next video. Oh, the ichimoku guiding light. Blue cloud [music and singing] traing through the night. >> [music] >> You

Comments 0
Sign in to join the discussion.
Sign inNo comments yet. Be the first to share your thoughts!