Nvidia NVDA Multi-Timeframe Analysis | askSlim Office Hours

- Video return
- -9.09%
- Calls
- 2
- Buy / Sell
- 0 2
- Published
Recommendations
Entry is the asset's closing price on the publication date. Current is the last close on record.
-
Entry $200.75 31 Jul 2026Current $218.99 06 Aug 2026Result −$18.24
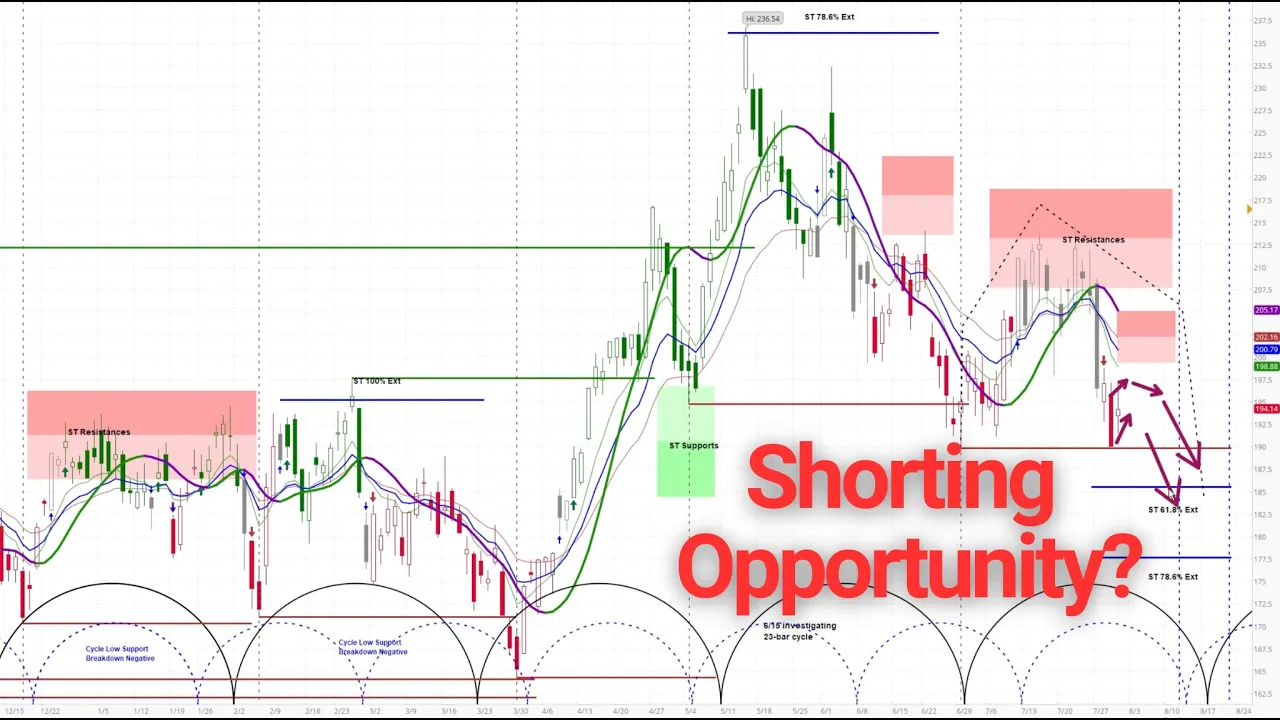
higher odds play for a little bearish play down on the downside into that low
Context "I think, you know, fairly good odds of a move down to that 18550 to 178-ish area. ... I'm going to be watching this closely in the early part of August for a shorting opportunity in NVDA."
-
Entry $200.75 31 Jul 2026Current $218.99 06 Aug 2026Result −$18.24
I'm going to be watching this closely in the early part of August for a shorting opportunity in NVDA
Context "I'm going to be watching this closely in the early part of August for a shorting opportunity in NVDA."
Full Transcript
Nvidia, let's just pull up the monthly here in NVDA. So, overall still holding up okay, seeing a little bit of stalling, but nothing too significant yet. We have a low that's due right around Feb 2027 to Sep 2027. Weekly, a low 810 to about 921. Clearly in an intermediate term corrective mode, makes sense based on what we're seeing in the other semis, but this is continuing to show relative weakness. Very important chart here, I think on the short term to keep your eyes on, okay? Um We have this blue 23 bar, which is really very close to what I'm I'm also looking at and she's she's also got this uh this 34 as well. They all sync right around mid-August. So, we saw it move right back to lows, right? But is this having any kind of huge move on the upside? No, it's only up 2% and this is to me looking like a higher odds play for a little bearish play down on the downside into that low, which with I think, you know, fairly good odds of a move down to that 18550 to 178-ish area. Now, what would change the overall picture? What would change the picture is is if you hold in range, right? Makes sense. If you hold inside of that range, there is no real selling. If you can get a clean few-day pattern here that then sets up back down and then loses that low, then clearly this has uh still lower to go, right? Because you have shown that there is price acceptance lower, right? If you actually see this turn up quickly and start to go back up there, there isn't anything happening. So, I'm going to be watching this closely in the early part of August for a shorting opportunity in NVDA. If it can hold tight at lows, put some pressure on the market at lows. Very similar to what happened back here. It moved down, pressure stayed on the market, sellers came in at the 21, and then a final flush, right? Very similar to that, really. Not all that much different. Look for this to hold tight and then get hit. Obviously, you can see I'm interested in NVDA. Jump over.
Comments 0
Sign in to join the discussion.
Sign inNo comments yet. Be the first to share your thoughts!