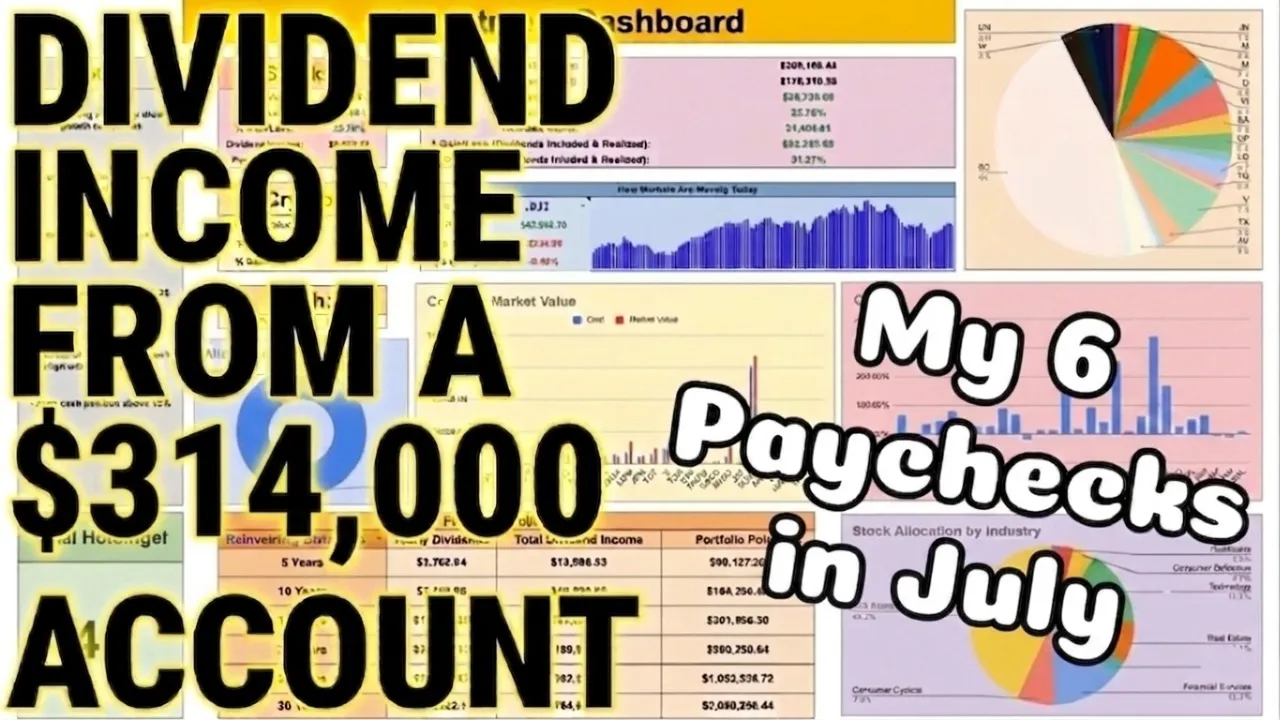
How Much My Dividend Portfolio Paid Me in July! ($314,000 Portfolio!)

- Video return
- +0.59%
- Calls
- 5
- Buy / Sell
- 5 0
- Published
Recommendations
Entry is the asset's closing price on the publication date. Current is the last close on record.
-
Entry $418.28 05 Aug 2026Current $420.57 06 Aug 2026Result +$2.29
I talked about this in previous videos this year, but I added a lot more Broadcom to my portfolio, and now we've seen it run up all the way to $418 once again.
-
Entry $1,678.22 05 Aug 2026Current $1,704.37 06 Aug 2026Result +$26.15
ASML, one of the stocks I added heavily last year, up 156%.
-
Entry $37.72 05 Aug 2026Current $38.05 06 Aug 2026Result +$0.33
My position on EPD now, a stock that was yielding over 9% when I originally added it, is up over 100%.
-
Entry $68.44 05 Aug 2026Current $68.44 05 Aug 2026Result −$0.01
My Altria Group, stock ticker MO, another high yielder I was adding when it was yielding 9% up over 83.7%.
-
Entry $59.29 05 Aug 2026Current $59.16 07 Aug 2026Result −$0.13
And then my most recent addition in the high yield space was MPLX which I added it just this year and I'm already up 25.38%.
Full Transcript
In this video, we're going to be going over exactly how much dividend income I made in the month of July from a $314,000 dividend portfolio. And to break this down, we're going to be jumping into the do-it-yourself investor toolkit from tickerdata.com. We're going to look at the investment dashboard, the dividend dashboard, dividend calendar, and the daily dividend calendar. And then like always, we're also going to be projecting out what my portfolio will look like in the future, so we can see exactly how far away I am from achieving my long-term goal of one day living off dividends. And again, like always, if you'd like to be able to download this spreadsheet and also get access to the ticker data add-on in Google Sheets that allows you to automatically import stock financials directly into your spreadsheet, then you can head over to tickerdata.com at the link in the description. Now, let's go ahead and dive in. But first, I'd like to say thank you to Dividend Wealth for sponsoring this video, where you can currently get a 14-day free trial and 40% off at the link in the description. If you're tracking dividends by hand, then you're still making a huge mistake. Dividend Wealth just released a huge update where you can automatically connect your brokerage with your dividend wealth account. This makes it incredibly easy to see the dividends you have coming in, the future dividends that you'll collect, and to see exactly how far away you are from achieving your income goals. Dividend wealth doesn't just break down your portfolio allocation, but perhaps just as importantly, your income allocation, revealing some potential risk in your portfolio that you may not have been aware of. You can run different models to see exactly how far away you are from achieving your income goals. And with the dividend calendar, you'll know exactly when those dividend payments are going to be paid. They also just updated their three model portfolios, the dividend income strategy, the income growth strategy, and the balanced dividend strategy, where you can get deep insights into what developing an actual dividend portfolio should look like. So again, check out Dividend Wealth at the link in the description to get a 14-day free trial as well as 40% off. Now, there's no doubt about it. July was an absolutely incredible month for my portfolio, but really for the market in general. In fact, if we look at the heat map of the S&P 500, one of the things you'll notice is this is a stock pickers market right now. Why is that the case? Well, most people already understand. When we look at the Schiller Cape ratio, the PE ratio for the S&P 500, we're essentially sitting right at all-time highs with the exception of the peak of the.com bubble. Valuations are very high right now. So, naturally, you need to be looking where the opportunities are in the market. Some semiconductor stocks are performing really well. Some have seen a pretty drastic pullback. That same story is true when you look at tech or healthcare. And so, personally, my portfolio has been a major beneficiary of the runup we've seen. I'm hitting all-time highs. Last month, I was below 300,000. Now, I'm at 314,000. And get this, that's without adding any new capital to my portfolio this month. In fact, when we include dividends and realized gains, I'm up almost 56% now. So, the portfolio is doing really well, which brings about an important point. A lot of people hear the term dividend portfolio. The reality is this is a dividend growth portfolio. And that's very different from strict dividend investing. Essentially, what we're doing is we're looking for stocks that can grow their dividend payments over time. So, how does stocks grow their dividends? What allows them to do that? Well, ultimately, dividend growth is driven by free cash flow growth. So, let's look at Mastercard for example. What most people see is this low starting yield for this type of stock and immediately dismiss it as a dividend stock. But over the past decade, their 10-year dividend cacker is sitting at 16%. So think about the type of difference that makes. 2015, they're paying out 64 cents per share. By 2025, $34. So the amount they paid out in dividends in just a 10-year time period essentially 5xed. So this is a great example of dividend growth. And this is only sustainable if it's backed by growing free cash flow. Because if the dividends growing at a high rate, but free cash flow is not growing, naturally what happens is the free cash flow payout ratio climbs higher and higher. But because free cash flows grown at a rate as fast, if not even faster than dividends, naturally the free cash payout ratio has stayed very strong, just 16.3%. So what does that mean? Well, it means when we think about capital allocation, Mastercard can also do a lot of things like reinvest back into the business. They can buy back shares. they can attempt mergers and acquisitions or even pay down debt if they needed to. So, more than anything, this is a dividend growth portfolio we're talking about. It's a total return strategy that maximizes income over the long term. And that's an important caveat to make. We're not sacrificing income in itself. We're maximizing dividend income over the long term. And I'll show you what I mean here in just a moment when we look at the dividend dashboard. But if we keep moving forward, we can see total holdings currently sitting at about 27. allocation. I'm currently sitting on about a 6% cash position. Now, if we go ahead and zoom in, we can see what the gains for the portfolio actually look like. Here we have our cost and market value, but we'll break down the allocation in a moment. Let's talk about the growth. What we can see is the vast majority of the stocks in the portfolio have done quite well. We have a few losers that we've added over the last few months and over the last few years. For example, we can see the S&P global position right now is down by about 14.8%. That's a relatively new position. Novon Nordisk, which is a very small position in the portfolio, is down by 24%. The thesis has certainly not played out yet. And then we can see Louis Vuitton, one of the few international stocks in my portfolio, down by about 17.3%. So, as of right now, those are the losers in the portfolio. But fortunately, position sizing matters. And my biggest winners also happen to be some of the larger positions in my portfolio. So, let's talk about some of the big winners. To start, Caterpillar Stocks has been one of the major beneficiaries of the AI boom. They're powering the AI boom, up almost 400%. JP Morgan, this stock was way undervalued back in 2022. I was making videos all the way back then about it. We're now up over 244% on this position. And then Broadcom, a dividend growth stock that I've been talking about again for a long time now that I'm a huge fan of. On my original shares, I'm up over 700% now, but on my average cost basis, I'm up 237%. which brings about a really important discussion. One of the things a lot of investors struggle with is known as price anchoring. Now, what is price anchoring? Well, Broadcom is a good example of this. Remember how I said on my original cost basis, I was up over 700%. So, the stock has split since then, but if you look back in around 2022, late 2022, the stock is trading around $40, $50 a share. What essentially happens to a lot of people is if you added shares during this time and you saw the stock run up to around $100 a share, you think, "Wow, I've essentially doubled my investment. The stock must no longer be undervalued." However, the share price movement of a stock by itself doesn't tell you anything about what type of opportunity the valuation presents because obviously the stock kept running. Why is that the case? Well, it's because the stock was growing free cash flow at just a tremendous rate and they're projected to continue to do so. Take a look at the stock screener. Zoom out just a little bit. We're already looking at Broadcom. Look at how revenue per share has grown just since 2020, going from $5.94 all the way up to $13.56. So, it's more than doubled, almost tripled. The same is true with free cash per share, going from 289 all the way up to $571. And look at the way earnings are projected to grow in the future. If we look at earnings estimates here on Seeking Alpha over the next year, 70% year-over-year earnings growth. next year 67%. So naturally, because the stock is continuing to grow revenues and earnings and is projected to continue to do so, the stock was still trading at a great valuation at $100 a share, at $200 a share, and even $300 a share. So when we saw the market pull back significantly this year, I talked about this in previous videos this year, but I added a lot more Broadcom to my portfolio, and now we've seen it run up all the way to $418 once again. So naturally, my average cost basis, it did increase, but it's because Broadcom trading at $300 a share was still an incredible opportunity, even though I was adding shares all the way back below $100 a share. So, we have to be careful. We don't want to get caught price anchoring. We don't want to just pay attention to the share price movement, but what's actually going on with the company's fundamentals. Again, Broadcom's a great example. We can see a small position with Cisco up about 189%. ASML, one of the stocks I added heavily last year, up 156%. Apple, another winner. I haven't added in a while, but I've held it for a long time, 125%. And then one of the things that's interesting is just because I'm a dividend growth investor doesn't mean I ignore total return opportunities, particularly in the high yield space. My position on EPD now, a stock that was yielding over 9% when I originally added it, is up over 100%. My Altria Group, stock ticker MO, another high yielder I was adding when it was yielding 9% up over 83.7%. And then my most recent addition in the high yield space was MPLX which I added it just this year and I'm already up 25.38%. Now when you're analyzing the high yield space you have to be careful because the way we analyze a lot of alternative high yield asset classes is a little bit unique and in the case of MLX this is an MLP. So naturally we need to look at how much distributable cash flow per share they're producing relative to how much they're generating in dividends. And what we can see is distributable cash flow per share is easily covering those dividend payments. And here's what's really impressive. They just released their latest quarter's earnings report and management is guiding towards 12.5% dividend growth over the next couple of years. So we're talking about a position that's yielding over 7% as of right now and it's going to see doubledigit dividend growth over the next couple of years. That's an incredible combination of yield as well as dividend growth. So overall, you can see my winners, you can see my losers. I've been transparent about this for a long time. Now, if we come up here, let's talk about position sizing. Naturally, what's going to happen is because we have some big winners, they're going to take up more of the portfolio. Microsoft is about 9.5% of the portfolio. Broadcom 5.6, Visa around 6.4. Other than that, it's fairly well diversified. And then we have a nice chunk of change in the dividend ETF CHD. Now, this is an entire conversation in itself, and people have strong opinions about SCHD. But here's the reality. What we've seen so far in SCD is just tremendous total returns yearto date. It's up 23.7% outperforming other dividend ETFs like DGRO and VIG and even outperforming the S&P 500 by a wide margin. If we zoom out over the last year, SEDD now has a total return of nearly 32% outperforming all of its peers. Now, here's the push back that I know a lot of people are thinking, and it's very fair push back. I completely agree. SHD has definitely underperformed over the last decade, at least relative to the S&P 500, but not by nearly as much as you would suspect. But here's what a lot of people miss. For a lot of the last decade, SCHD was actually outperforming the S&P 500. But then when we had the AI boom, starting in late 2023, tech started to run and that's what pushed the S&P 500's performance past SCHD. But here's what a lot of people have never really come to understand. It's because it doesn't get discussed very often. SCHD has only existed since 2011, but the index that it tracks, the Dow Jones US Dividend 100 index, has back tested data going all the way back much further. So, here's what we have to understand when we look at the returns from 1999 to 2025. The Dow Jones US Dividend 100 index has a 10.5% annualized total return, while the S&P 500 during that same time period 8.2% annualized total return. So the reality is if you look at the performance of the index that SCHD tracks since 1999, it's outperforming the S&P 500. Now this really shouldn't come as a huge surprise because most of the time the outperformance for funds like SCHD that have more value dividend style holdings versus the S&P 500. The outperformance happens during market pullbacks. So, in a sense, SCHD is a hedge against the S&P 500 while also producing incredibly strong total returns, providing a very nice starting yield of above 3% and of course, dividend growth that historically speaking has been in the double digits. So, it's easy to see why someone looking to one day live off dividends would make SCHD a large holding in their portfolio. Now, if we scroll down, we can see my allocation by individual industry. I'm pretty heavily into tech. A lot of great dividend growth opportunities there. financial services, which keep in mind, Visa and Mastercard fall into this category. Some would argue it's somewhat of a tech stock, but other than that, fairly well diversified. So, let's go ahead and jump into what everybody wants to see, and that's how much dividend income did I make in the recent month. So, if we look at the dividend dashboard, let's go ahead and blow it up. We can see in the most recent month, I generated around $36,821 in dividend income. Now, here's where a lot of people have concerns. They make comments. They don't understand the full picture. They look at the total size of the portfolio, how much it's generating in dividend income, and they realize it's not very much income relative to the size of the portfolio. But remember, we're not pursuing a high yield strategy. We're pursuing a dividend growth strategy that maximizes total returns and maximizes dividend growth over the long term. So, here's the chart I have to show in every single video that helps you better understand it. In the short term, yes, high yield investing pays out more in dividends. We see that in the blue. But because in the red, dividend growth stocks continue to grow their dividends at a high rate, they eventually surpass high yield stocks in the amount they pay. Now, even if we reinvest dividends, that continues to remain true. It just takes a little bit longer for dividend growth to actually surpass high yield investing. So, that's the thesis. That's why we're dividend growth investors. It maximizes total returns and maximizes dividends over the long term. So, if you're still quite some time from living off dividends, really, you should be pursuing more of a dividend growth strategy. But as you get closer to potentially living off dividends, that's when you start to look at more high yield opportunities. Now, with that being said, we can see my expected yearly dividend income now sitting at about $8,179, meaning the average monthly dividends, which really this is the number we should be paying closer attention to, this is sitting at about $681.60. My portfolio dividend yield on cost continues to go higher as well as the underlying holdings continue to grow those dividend payouts. So if we look at my portfolio value over time, blow this chart up just a little bit. Again, you can see it was a record month. We went from around $296,000 all the way to $314 in a single month without making any new contributions to the portfolio. Now, despite that, you'll still notice that my projected annual dividend income, which I track every month, still went up in the previous month despite no new contributions. Well, remember that's due to the dividend snowball effect. Not only do your dividend payouts grow because of increased investment activity, but because the underlying holdings grow those dividends and because you reinvest dividends. So regardless of market performance, regardless of what's going on in the market in general, we continue to see the amount paid out in dividends grows higher every single year. So yes, this is why we can sleep well at night as dividend growth investors. Even though the S&P 500 Schiller KPE ratio is sitting very close to all-time highs, what do we know? We know that regardless, our portfolio is going to continue to generate more in dividend income. So the reality, it doesn't impact our plans of living off dividends. This is the beauty of dividend growth investing. Now, on top of this, we can see my dividend yield on cost for different positions. For a few of them, it's actually approaching 10% because I added a great valuation. I've seen great gains, but they continue to grow those dividend payouts. So, we're approaching yield on cost of 10% for Altria and for EPD. Now, now some of these positions such as JP Morgan, my yield on cost is 5.5%. Why is it so high for a stock that's yielding significantly less for that? Well, again, it's simple. I added a great valuation when the yield was higher and the stock continues to grow those dividend payouts. Now, if we keep moving forward, let's take a look at the dividend calendar and see exactly which positions paid me dividends this month. And really, I say this every time, but the beauty of these dividend calendars is you can visualize dividend growth over time. It helps you to better understand the compounding effect. And the easy example is realy income because they pay out dividends every single month. So, you can see as we move forward in time, those dividend payments are getting larger and larger every single month. So if we scroll all the way over, we can see right here. Here's the month of July. Which stocks paid me dividends? Well, Coca-Cola paid almost $25. Altria around 111. Realy income 31. Vichy Properties 182. JP Morgan 1636. Cisco a small position $1.85. So that's it. Just 1 2 3 4 5 six payments in the month of July. So now if we look at the daily dividend calendar, let's zoom out quite a bit more. We can see total dividends so far this year sitting at 4,284. So just a little bit past halfway mark in 2026 and we've already surpassed where we were back in 2023 and easily surpassed where we were in 2022 and we're quickly approaching those 2025 numbers as well. So we can see overall the compounding effect is really starting to take place. So, there's only one more question we need to address now, and really it's how far away are we achieving our long-term goal of one day living off dividends? Well, again, we can calculate that. If we jump over to our dividend portfolio projections, you can see essentially the assumptions we're making right here, but they're not overly aggressive. We're assuming price growth and dividend growth of just 7%, which to be honest, I think it'll probably be a decent bit higher, but I'm not trying to be overly optimistic. Now we have monthly contributions assumed but that does fluctuate. So keep that in mind. So the goal is to get our monthly dividend payments above this cost of living and stay above the cost of living. So we can see the point at which that happens right here. The red is our dividend payments. The black is our cost of living which keep in mind grows over time due to inflation. So where is that crossover point? Exactly how far away are we from achieving this goal? Well, if we start to scroll down, we can see right here by year five, yes, we're generating around 2,200 in monthly dividends, but that's still not enough to live off of, obviously. If we keep scrolling down, by year 10, we're at about 4,380 in monthly dividends, which is absolutely incredible. That's over $50,000 a year, but we can see it's not till around year 11. That's the point at which we could live off dividends forever because monthly dividends surpasses monthly cost of living. And here's what's interesting. I always get the question, but yes, what if we stop reinvesting dividends during that time period? Well, the reality is, as long as your dividend growth rate of the overall portfolio is higher than the rate of inflation, then you could still live off of dividends absolutely forever. You could do it indefinitely. Now, let's get more of a grand overview of what this actually looks like when playing out. We can see 10 years from now what yearly dividends will look like. If we don't reinvest, it looks quite a bit different down to 36K. 20 years from now if we don't reinvest around 87K but if we do 154 and 30 years from now if we don't reinvest around 186 but if we do it jumps all the way up to 450. So that's the compounding effect taking place. It's pretty incredible what's possible. So there you go. That's how much dividend income I made in the month of July from a $314,000 portfolio. Go ahead and let me know what you think of this portfolio in the comments down below. And again, like always, if you'd like to be able to download this spreadsheet and also get access to the ticker data add-on in Google Sheets that allows you to automatically import stock financials directly into your spreadsheet, then you can head over to tickerdata.com at the link in the description. So, with all that being said, thank you guys so much for watching and please don't forget to like and subscribe to the
Comments 0
Sign in to join the discussion.
Sign inNo comments yet. Be the first to share your thoughts!