Context
Google on the weekly chart... not the time to be adding positions in Google according to this indicator. ... I personally wouldn't be buying it right here.
Nothing interesting. It's just stagnant as I like to call it. So, why put your money into something that's not moving?
Context
What about Bitcoin? ... Nothing interesting. It's just stagnant as I like to call it.
Full Transcript
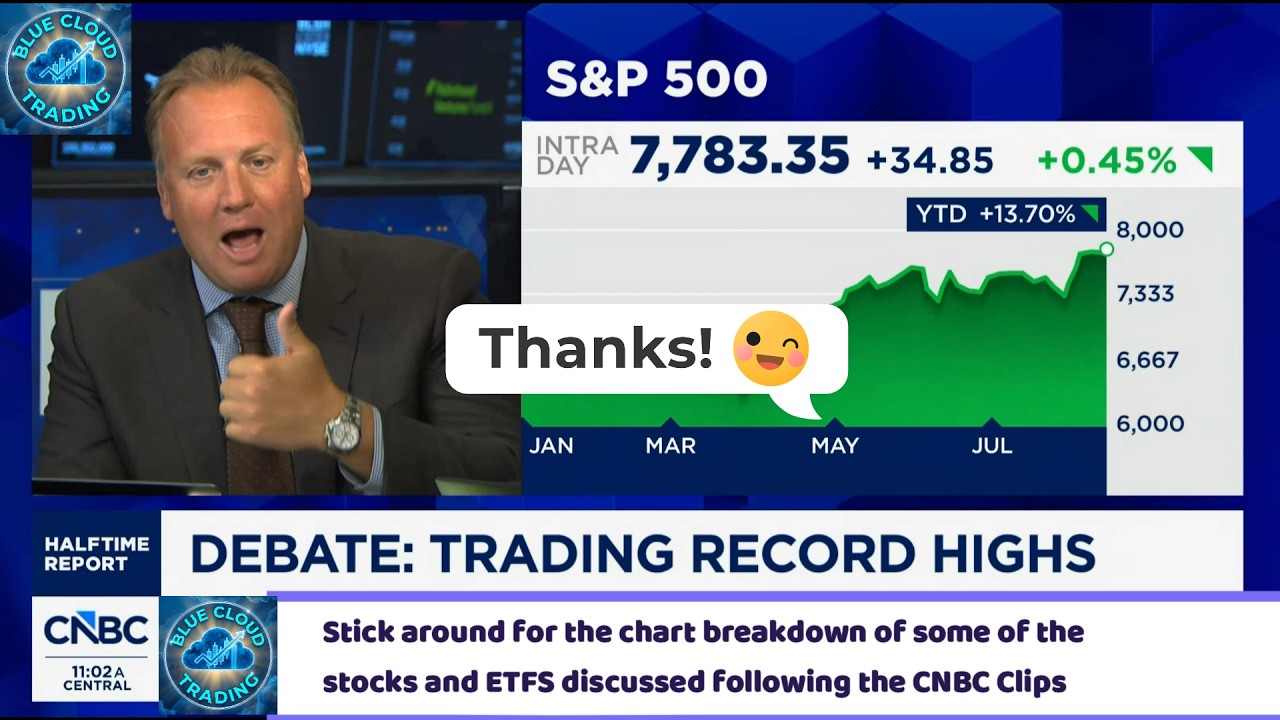
Blue cloud trading [singing] through the night. >> Welcome back to the channel everyone. [music] In just a second, I'm going to play a few CNBC clips from today's episode of the halftime report. I'm going to pull up the charts and dive into the technicals of some of the mentioned stocks. We're going to look at the key support, resistance levels, momentum, and see if the price action actually backs up what the talking heads are saying. Hit that like button. Subscribe if you haven't already and let's roll the tape on the first clip. >> Carl, thanks. Welcome to the halftime report. I'm Scott Wapner front and center this hour. Record highs for stocks after the latest inflation [music] read comes in light, yields falling. We're trading the markets with the investment committee. Joining me for the hour today, [music] Josh Brown, Stephanie Link, Jenny Harrington, Malcolm Ethridge. PPI was cooler, yields are lower, oil was down. We were 50/50 on a rate hike for September. Probably a hold seems more likely today after these most recent inflation prints. Decent mix of sector performance today. 8,100 remains in the line of sight. That according to city and they lift their earnings estimates as well plays right to the theme we've been talking about. 8,000 seems to be the floor on the street. They keep bumping up their numbers. Why? Because earnings remain so robust. Fact set today. The S&P's highest revenue growth since the fourth quarter of 2021, the highest net profit margin since Faxet began tracking that metric all the way back to 2009. That's the story. >> That is the story. You're absolutely right. Look, uh there are people in this business who choose to direct their energies focused on Fed gossip and uh what two words might be missing from the statement this week or they will look at one data point that agrees with their priors like a retail sales miss or something to do with ISM which I don't even know what that stands for. I'm only around for 30 years. I'll figure it out at some point. There are people that choose to spend their time on that. And then there are people I think like the people on our panel that look at earnings, listen to what companies are actually saying to their shareholders when they report, focus on price and trend and mostly get things right. This has not been a difficult year. We had a couple of thrills and spills. Um we had uh we had a a January February selloff. We had another one uh in March. We had some geopolitical stuff. What else is new? But overall, the earnings story has been so obvious, like a smack in the face. Every time we go through an earnings quarter, it's the same story. Beat, raise, uh, above everyone's expectations, companies spending more on capex than even we would have thought the prior quarter. And every sector is now participating. It's 10 of 11 sectors with earnings growth. It's all different companies, all different walks of life. It is not a tech specific rally, although tech looks unbelievable right now coming back from the lows of July. And if you get those big picture things right, you don't have to do Fed gossip. It's spend your time doing something else. Read a book to a a child. Like [laughter] literally anything other child, read a book. >> Trend is higher. Stocks are acting great. The advanced decline hit an all-time high last week. Earnings are outperforming in every sector. You need another data point or can you just go with what's happening right now? I don't need another data point. I'm good. >> Knocking on 7,800 on the S&P, >> right? >> Yeah. So, the Atlanta Fed tracker is at 5.8% GDP growth for this quarter. Now, it's going to come down probably over time, but we're still well above trend and that's an acceler a massive acceleration from the second quarter. So, even if we we wind up at 3%. That's double of what the second quarter came in at. So to me it's it is about the economy because that flows into earnings. Now the inflation reports are still high. They're still elevated but at least they're not accelerating from here. And I we talked about the unit labor cost last week which I pay more attention to than the CPI PPI. And also the productivity numbers 1.7% productivity. We averaged 2 to 2 and a.5% over the last 10 years. In the 50s and 60s the industrial revolution it got to as high as 5%. So we have a long way to go on productivity and that will help inflation too. So it's the consumer and I'm and we get retail sales this week so that'll be a big one. But also the banks are telling you that the consumer is fine. The H8 data comes out every week and the loan growth is anywhere from 8 to 10% for the big six banks. But not only that, credit quality is better. Delinquencies are coming down. Net charge offs are coming down. Capital is going higher for the banks. So the consumer is consuming. And of course, we all know about AI and the food chain. That's alive and well. We've got a number of companies this week that that told us once again, and that is having a very positive effect on the overall earnings profit margins. Yeah. I mean, for the S&P 500, up 250 basis points year-over-year for the S&P 500. >> The highest since Faxet began tracking the metric. Yep. >> All the way back to 2009. >> Even Even Jenny Harrington's bullish. [laughter] >> I don't know what to tell you. Make a full screen. You just want you just I feel like you want to argue, but you are bullish. >> No, she said as much last time. >> Makes me very uncomfortable. >> You're like, but what? >> Wait a minute. I'm bullish. [laughter] >> What was I going to say? [snorts] >> Seriously, you you're you're pretty you're pretty bullish in the near term. You said last time you were on. >> Well, I think Josh, you know, Josh said it in a funny way, but it's serious. and you said do something better, you know, and I've spent years waking up every morning and having something, you know, something kind of like jerk you awake with some horrible market news. It's been quiet for 2 months now. It was quiet through June. It was quiet through July and it's been quiet in August. And um and that's real. And I was thinking I said to someone, "Oh, well, it's August and it's actually quiet this year." And they said, "Isn't August always quiet?" No. Last year we had the Japanese yen carry trade unwind. And that was really scary. But every morning it's been like news that's expected. >> We had the hedge fun blow. We had the hedge fund uh blow up and the margin unwind. But you don't feel that in your portfolios. >> No, but also it didn't really do that much, you know? >> Well, that's part of the resiliency of the market, right? Exactly. Like the the the bears, the sharks, right, have gotten some chum in the water from time to time and they attacked it and they thought that there was going to be then this endless supply of stuff to go after >> and then the the tuna disappeared and the sharks had to swim away and then the waters looked calm again. >> This is a great analogy for summer. Yeah, I'm sure everyone wants to go swimming now. >> Up on the Cape. [laughter] >> Up on the Cape. Adam, >> do people actually go in the water up there? >> I think they do. They do. >> I would. I take the risk. It's surprising. >> They have big signs on the beach up there, like literally >> with the p big pictures of sharks. >> Yeah, [laughter] >> I've seen it. >> That's funny. Um, but I think I think the thing is there's a mechanical nature to the earnings that are coming in. So, when we see these huge profit margins and when we see these beats, there's not risk of them disappearing, right? There's not risk of things just of some one big thing swooping in and knocking everything off the rails. So there's a calm and a comfort right now. I'm trying, you know, to >> have pricing power. These companies have more pricing power than ever before in AI, in the food chain, in consumer. They have pricing power and they're taking it and that's why margins are going higher. That is so powerful because you get the operating leverage. You have 50% earnings. You get 15% total revenue growth and the margin expansion. I mean, that's that's the answer. That's the 50 that's why you're getting 50% growth. >> Yeah. And I think the challenge, all all kidding aside, for someone like me is staying calm and just accepting it and saying like, "Yes, we're in this moment. That's okay." And I had a client call the other day and he's like, "Jen, like shouldn't we be getting out? Aren't there storm clouds on the horizon? I feel like everything's terrible, you know, but and all that." And I said, "Yeah, but for now and for the next 6 months at least, like we're okay. You have to just live with that and you have to tamp down the fact that we all have a little PTSD from wild markets and you just have to tamp it down and say, "For now, we're okay." >> Malcolm I think Tony Pascarella's note perfectly captures my feeling on this. There's a lot of distractions out there that have happened post earnings that could take you in a bunch of different directions, but the only thing that really mattered during this earnings period was the fact that cloud growth accelerated so substantially that it justified all of the capex spend that we've been talking about on this show for years on end at this point. So, as long as you say more of what he said, I'll come right back to you too. So, this is Goldman's Tony Pascarelloo. He talks about tech in his note today and he says quote if there was one other takeaway from the reporting period that struck me it was the growth rate of cloud revenues for the hyperscalers. Part and parcel of that Microsoft and Amazon drew a clearer link between AI capex and return on invested capital. As long as that linkage exists and the stock market rewards it, I have a hard time seeing any slowdown in spending. So that's what you're referencing from Tony today. It is those two companies Microsoft, Amazon along with Google and Meta are spending at a wild pace 800 billion dollars or so this year uh expected. As long as that continues to go and as long as any of those four companies continues to show the cloud growth that justifies that level of spend, we've bought ourselves another two or three months until the next earnings period. That's really where we are right now. >> You know, as we said, are having a pretty nice week. I mean, Nvidia reports in less than two weeks. Malcolm, BFA raises their CPU TAM today to 210 billion plus from 170 billion. They reiterate that stock as their overall sector top pick. It speaks to the level of demand that we think we're going to continue to get. if you needed more evidence of that, maybe you got it as well when you had Jensen and company in that extraordinary event on this network a couple days ago um on what they plan to finance in terms of this buildout. >> Yes. And um I am starting to feel like the only sane person in this crazy market looking at this chip tree. Like basically what the announcement from Nvidia and others is telling us is that we're going to start talking about collateralized chip obligations as a separate asset class at some point, right? Like that's how far into crazy town we've now gotten. you have moves of 5% or more in each one of these chip names that a lot of times the investors in them or the people trading them more realistically uh don't even necessarily understand the difference between the GPU versus the TPU versus the next thing and the next thing. It's just that the stock has gone up and so I expect it will keep going up and so I'm going to buy this one. And so not to say that the demand isn't real right now within the space, but we have to also consider how long it takes to build out the foundaries to actually deliver the chips and how long it takes for the data centers to actually get connected to power. And by the time all of those things happen, the demand that we're seeing that we're so excited about today has waned and we've moved on to the next thing. And so I think that anybody who's buying a lot of these companies that we're talking about, not talking Stephanie specifically because she's been in a name like Micron for a while and is just adding to a position that has already done well. But the people chasing this trade so late in the game, it it it just looks nuts. >> Are there are there still chasers? >> I mean, look at Cerebrus yesterday into the earnings. I mean it was 15% on a stock that is basically trying to do the opposite of what Nvidia does and unseat uh the incumbent basically. And so you had a lot of people who had wild expectations because the stock had already gone up so hard uh trying to catch that wave but I don't I don't mean to sound disparaging but I don't think people really understand what the company does right and and I mean that in terms of its place in the chip sector. I think people were looking and saying semiconductor stocks are going up. I need to buy a semiconductor stock that has been doing well recently. But just look how recently the company came public and it's still operating at a loss according to their own earnings. >> But you own the stock and I own the stock and you said yesterday that you would be inclined to add to it if it pulled back. Well, opportunity knocks >> it hard enough. So, I thought this stock was actually going to get slammed based on the earnings report that we got because basically the guidance said we're operating at a net loss of about 30%. We're going to take that down to about 18% going into the next quarter. Well, the company's still operating at a loss. It's very early days for this company. So, I set my high water mark 175 after it came down from its IPO peak. I said that is the most I'm willing to pay for this stock and I actually expected that it would get crushed based on that print and I'd have an opportunity to buy close to its June lows which didn't happen. It's still actually trading pretty positively today. I think we're somewhat not we on the desk but just in general I think sometimes we have a tendency to overthink things a little bit too much. If you're playing in these names and Malcolm makes a a a valid point. There are a lot of people, they're just hitting the buy button cuz it's green and somebody else hit it. And I totally understand that. I just don't think that's any different than it's been on Wall Street since the 1700s. I just think that's human nature. Um, people just feel safety in crowds. The whole crowd is buying memory stocks. I'll buy it and I'll research it, you know, when it goes down 10% to make myself feel better. Like that's it's just I don't care. I I guess my point would be like I'm not trying to correct anyone's behavior. It doesn't matter to me. Big picture, we have a a strategy called Porterhouse. I look at the top 10 uh names today and I'm looking at SanDisk and Western Dig and Micron and Sienna, Astera Labs, Dell, Jable, KLA, AMD. These are the stocks um in our portfolio. Those were also the top stocks yesterday. >> But what is the likelihood that all 10 of those stocks continue to go up and to the right in a succession? >> Not at all. >> That's the way they're being traded. >> I agree. That's not the question that I want to ask though. The question I want to ask is, do I have risk management in place so I can be in those names in a concentrated sleeve within a larger portfolio? If I don't, I'm in big trouble. To your earlier point, I think the people who are in these names, they have some discipline. It's hard for me to believe professional investors are in Dell and Astera and Sienna and they're just in there naked and they plan to hope for the best. I think people are are utilizing stocks. are utilizing options and uh we know that we're not going to see doubledigit moves every week out of this group of names. But we also know a lot of people want to be in them. I want to be in them when they're acting this way. I think we have to give the market some credit that not everybody is running a 4:1 leveraged hedge fund like the one that blew up in July. >> So why do you think Nvidia has underperformed the socks by 59% >> multiple compression? Well, I understand that, but I mean, why the fundamentals are strong? Because I recently bought it because it's it it has I refuse to sell it and I understand that, but but is it that they're selling are they are they selling Nvidia and Broadcom because both of them have lagged? >> I'll give you the three selling them and they're buying this other stuff which has much more alpha which is a little scary >> because how do you make a $5 trillion stock go to 8 trillion? It's really hard. >> I understand that. But the growth is still there, Josh. And the stock is has is trading at 14 times for 85% revenue. >> We're on the same we're in the we're in the same trade. The question is though, the question is though, can you envision can you envision a $40 billion component supplier to the data uh center getting to 80 easier than a $5 trillion? So I think we we understand like it's harder at a larger market cap to get at. Now, in my opinion, you're right. And that Nvidia announcement with the Justice League of Private Equity, >> Yeah. >> the the stock should be 275, right? >> Okay. Immediately. And if it wasn't a $5 trillion market cap, it probably would already be there. >> Well, right. And then we also talk about free cash flow. And this these guys have enormous free cash flow. 90 billion. It's going to double between now and the end of next year. So, the hyperscalers are right. But the whole point is everyone was concerned about the hyperscalers and the free cash flow that that is we're seeing depleted. these guys. It's actually accelerating on top of that. >> I think it's interesting though because when Josh said like the professional investors, we're staying put, right? You're staying put. But what I what I've seen in the last few weeks is these crazy moves on Cerebris, right? On Cororeweave. That has to be the marginal investor. So with a $59 billion market cap on something like Cororee, right, the marginal investor can make a huge impact. The marginal investor can't make any impact. >> I think that's pods. I don't think retail I don't think retail is moving. You think you think pods are moving those stocks up 20% one day? >> There's a little bit of 2x there's a little bit of 2x ETF but I think but I think the buyer of the buyer of coreweave that takes the stock up 20%. And then it gives nothing back. I think I think though the thing is the majority of holders in Nvidia now are the Stephss are the Josh's are the mature you know buy and hold going with it for a long time and then and they just don't have as big a component a marginal investor in them so they can't move as much and I think a lot of that move up is just like the crazy town moves right it's not that hey this is a substantial company >> the crazy town stuff though is happening in smaller market cap stocks higher beta they want Korean memory names like that >> yeah but that drives the whole index up to some degree. I mean, you know, you couldn't have you couldn't have the socks up as much as it is just on Nvidia. Like, it's got to be the smaller stuff that's pulling it up. All right, welcome back. Take a look at Netflix today. The stocks up three and a half% on word that Persing Square has revealed in its most recent investor letter that it is back in that name. 3 million shares. It's about 4.9% of the firm's portfolio. And this is the sequel, the premiere, if you will, happened in 2022 and was over quickly because Bill Aman sold that after only 3 months after Netflix had reported its first subscriber drop in a decade. We made a little wall here to show you they took a reported $400 million loss on that position. So that was the premiere. I think we all remember it well that remember that stock had a massive run to like 700 bucks and then just plummeted. And Aman was like, "I've had enough." And he said at the time, quote, "We've lost confidence in our ability to predict the company's future prospects with a sufficient degree of certainty." Well, they found something because they decided to make a sequel. They revealed that new 3 million share stake on Wednesday in their investor letter. I told you it's almost 5% of the portfolio, which has been somewhat remade as well, which is an interesting story, too. And now they say the following. When we first invested in early 2022, investors feared an escalating content arms race among a crowded field of streaming entrance. Netflix has since effectively won the streaming wars. Its subscriber base now exceeds any competitors by a wide margin, and that scale is self-reinforcing, and it can quote outspend rivals on content. So, Malcolm, you get the first crack. Aman is back in this name. >> I don't know what to make of it. I I think it's great that we got the 4% pop today on the news. I'll take it. I'm glad that I bought into it as low in the slide as I did cuz it gives me plenty of room to take the ride with it. I don't know what specifically he's seeing that brought him back to [clears throat] the table since subscriber growth has grown, but it's actually decelerating at this point that he's jumping back into the name. I think that they're probably figuring out ways to monetize the 300 million subscribers they've already got instead of chasing too many additional ones. So, I'll wait and see what additional notes they release, but I don't know that it necessarily is going to be a real lift for the shares the way that someone else jumping in. I I feel like this is um making a statement that uh they've won the race and the others, you know, okay, so you you mentioned what's happening with subscriber growth now, but they've only distanced themselves in terms of subscribers and subscriber growth from the competition that was thought to be maybe more robust, at least robust coming in 2022. And now they're back for a stock that's been hotly debated and has had a very bad streak. >> There's a Shake Shack on the line with this D. >> This movie has had bad reviews. >> No one wants my opinion >> after Josh is cuz he owns the stock. [laughter] >> Uh yeah, I'm long. I know what this is classic. This is classic Bill Aman, quite frankly. Um he's not looking for obscure trades or degree of difficulty or pulling like tiny midcaps out of his hat. That's not how he invests. He finds um unbelievable businesses with a moat, with a great brand that stumble upon uh tough times or a sentiment shift on the street. And he's patient and he waits and he wins. And I've seen him do this, not all the time, but I've seen him do this with a lot of big brand name type stocks. We've seen it in the past with things like Chipotle where people thought it was just going to be health code violations forever. They fixed the business, they turned it around, made a lot of money. Um, and I think it's going to work for him and Netflix as well. Um, I'm hoping this sequel is not Squid Game, uh, as a a fellow shareholder here. Uh, but it's 39% below its highs. It's trying to find a bottom. Has it found one in the high 60s? Maybe it has. Um, this is a stock trading at 20 times forward earnings. RSI is now 58. Although it's been rallying over the last week, it's got a long way to go. Nowhere near overbought. Um, they're expected to have 42% earnings growth in the next year. How many stocks can you find in the S&P 500 that could grow earnings 40% and trade at a 20 multiple? I could think of two. Uber is one, which Aman also owns, and Netflix. There probably aren't many. So, are there risks? Of course, there risks. Is there competition? Yes, we know. But in the end, if they deliver, if they execute, the stock is too cheap. It should it should be higher. I don't know. It's going back to 140, but it should not be should not be 70. That's the point I was making about monetizing the existing subscriber base instead of spending a lot of money to achieve new subscriber growth. You already have 300 million customers. That's where your earnings growth is going to come from. >> And they're not going anywhere. Their churn rate is very low. They've raised they've raised prices almost every year over the last 10 years. And and they've added this ad subscription tier for people that said no moss. They didn't want to pay higher. They got rid of the password sharing. They've pulled all those levers. Um, the ad business is growing. Uh, I don't think they can get away with another price hike right this second. And maybe that's why the stock is depressed over the last 6 months. But, uh, Malcolm, to your point, I don't think it's necessary. They have sports, they have live entertainment, they have unbelievable shows, they have a lot of sequels, uh, coming back for popular things, and it should be enough. Jenny woke up this morning and like >> I thought I was in a really good spot to win the burger bet with Josh on the total return debate >> between Disney and Netflix. >> You're winning but you haven't won >> channeling where I know you were you were thinking about now and now you're like uhoh. >> No, this is so unfair. That's what I was going to say. So you you stole my lines. Thank you very much. Um I would like to you know continue my theme of celebrating the moment and being positive. say, "Yeah, I'm up 30% on our bet in the last four months." And I would bet that you're right. Like, I'll bet the differential of that I'll bet that 30% between Netflix and Disney over the last four months. I'll bet that closes because it is, to your point, a little too cheap. The cash flow is there. The earnings growth is amazing. I think my one pause on Netflix longer run is Yeah, you're right. 40% earnings growth this year, but then it drops to like 7% next year and 16% the year after that. >> That's a hedge. I'd still rather be in >> I'm I'm trying to celebrate the moment and I'm trying to be short. >> In all seriousness, would you still would you still rather be in today? >> If they buy if they buy if they buy NBC Universal if they buy NBC Universal, that's a wild card for the stock. That could be why you have such a depressed market. I think I think the argument that we started there I think the investment thesis on that argument remains which is I do think that Netflix comprehensively as a business does have more competitive um challenge in this AI world where things are where it's just easier to make content you know and you you and I were talking about this a while ago and you were saying like do you still have Netflix as a as a subscription no right you do >> no I do >> oh you do I thought you said you didn't or maybe someone else said it because they're like look I watch everything on YouTube right and and YouTube has taken over so much but what I like about >> on Christmas, you have to have it. >> Okay, fine. But but I don't watch them if they have them. >> But I think I think the thing is it is more of a onenote business. So yeah, for me and for my strategy like I still want >> I think I just listed all of my things on the platform >> compared to Disney Malcolm you can't even go there. Disney like I don't want to open up the whole thing. The point is only I think the differential closes before year end, right? I don't think we end up with a 30-year gap. So there's probably more upside for Netflix in the in the balance of the year. In the long term, I still want something that has a more diversified, more analog. >> The One Note is why I like the stock and don't own Disney. I want the One Note. The One Note is an insanely profitable uh business that they that they dominate and probably will a year from today. No matter what the other streamers do, and they don't have to sell churros. >> So, listen. So, listen. Our bet expires at the end of February. Sorry, at the end of December. We'll You'll buy me my burger then and then we'll consider renewing it for a year ahead. >> I'm going to make you feed me my burger. That's gross. >> God. >> Kate [laughter] Rooney, please. Quick. >> How do I How do I >> We're back. Josh Brown's best stocks in the market. The spotlights on Ferg. >> Yes. >> Ferguson Enterprises. Ferg. >> Yes. Not Fergie. Not London Bridges or Black Eyed Peas for Ferguson. Nobody knows this stock. And I'll tell you why. The company uh has been around for 75 years, but it spent a lot of time traded on the London Stock Exchange. A couple of years ago, they realized this is stupid. There's a huge discount. We should get back to our roots in Newport News, Virginia. We should get an S&P 500 listing, and we should narrow the gap in in valuation versus all of the companies in our space that are in the United States. They have done that. Um, I would argue the stock has got some of the credit for that, but there's way more coming because while they've also uh while they've become a US uh traded and listed name that people now are becoming more familiar with, they're seeing a big improvement in the industrial side of their business. So, when you think of Ferg, I want you to think of cool. It's running water, plumbing, and it's HVAC. And the industrial component, you guessed it, a lot of demand from data centers and all of the other industrial projects that are happening all over the country, all over the world. Ferg is the largest supplier of equipment. Um, and the strategy here is uh dual contractor. There's a lot of people doing plumbing that are also doing HVAC and Ferguson become it gets uh two bites of that apple. So, the strategy is bearing fruit. Jeff has a $289 price target. Put the chart back up because I want to talk about technicals for a second. Um, what's held the stock back is the whole business isn't industrial. There's a residential housing component, which we all know the housing market sucks, etc., etc. We won't spend any time there. I think the market is going to let this thing break out. I think the buyers are going to take this thing above 250 because at a certain point, housing is no longer a drag. It's just blah. And you get this data center component that is contributing more and more of the earnings. So, it's made three attempts to get above 250. It's failed three times. I don't believe in triple tops. I think ultimately this thing takes out that high. So, what we told people in the pro column, Scott, we're stalking the stock. We're watching its behavior the next time above 250. If the sellers dry up there for the first time after multiple attempts, that's going to be our signal that this baby's ready to break out. Um, it's been on and off the list for the last year. You could see how choppy it's been in this channel. Someday the sellers will run out of ammunition and this thing's going to be like a beach ball you were trying to hold under the ocean for too long. It's just going to go and I think that day will happen between now and the end of the year. >> All right, thank you very much for that. That's Josh Brown's best stocks spotlight. It's time for finals. Malcolm Ethridge. >> Yeah, I'm going Netflix again. Won't be trading at 20 times forward forever. >> Jenny >> Cisco, get it on the weakness. >> Stephanie Link >> Union Pacific >> JB >> Crowd Strike now up 100% over the last 52 weeks. Undisputed. >> All right, I'll see you on the bell. >> Hey everybody, welcome to Blue Cloud Trading. I'm George. It's Thursday, August 13th. It's actually 9:19 p.m. Eastern time, very late as I'm recording this video, but we're going to go over the stocks that they just discussed on the halftime report. Not all of them, a good portion of them. Uh, we're going to take a look at the indices here. We're going to take a look at the heat map, which is important. Let's see how the stocks, the individual stocks in the S&P 500 performed. And let me show you just a brief overview here of the stocks that we're going to talk about. I've already reviewed all these, previewed these. I've looked them up through the uh TC2000 platform that I use here. It's a really easy platform to use. Uh I strongly recommend that you guys consider trying this platform out. Uh, and I do have an affiliate link for this platform. I'll share that with you in a second. But let's take a look at the stocks. Crowdstrike, Dell, KBE, Nvidia. Those are the top four after my analysis out of the 19 stocks and ETFs. I'll also be covering the SPY, the Dow, the Russell, Euro stocks, Q's, gold, silver, Bitcoin, Ethereum, and we've got, see here, five, okay, five ticker symbols that from our members. And so let's go back here for a moment. Let me show you guys how what happened today. The S&P 500, it jumped, it gapped up, it moved up, it dropped a little bit. It was up though for the day 65%. The Nasdaq also moved up. It was up 81. A nice strong move for the Nasdaq. The Dow gapped up, dropped. It was under yesterday's closing price for a little for a little while, but then it recovered. it was only up.13%. The Russell 2000 gapped up, dropped. It was only up 26. So, these weren't really huge moves here, but you know, the NASDAQ certainly showed a lot more strength today. And um looking here at the heat map, we can see why because a lot of the technology stocks were up. And uh you see Nvidia's up. I mean, that's not a big move, Microsoft up.9, Apple up 1%. But Micron up 4.23, 23. Intel up 3.58. You can see Oracle was up. Pal piloter. Um, you got SanDisk was up 13.67%. It's pretty nice move. Um, Tesla and Meta were up. Google was up, but the financial some of the financial stocks didn't do so well like JP Morgan, Bank of America, Wells Fargo, Berkshire Industrials did not do so so well today. But the real estate stocks did well. There's a lot of green there. Basic materials were dropped a little. energy was mixed. Uh we had just specific uh segments for example the oil and gas refining and marketing okay segment of the oil companies did well as you can see right there but you look at the oil and gas EMP those were mostly down healthcare stocks Merc was up 1.98%. Looking at the groups here today the one day performance it looks like communication services were the at the top 1.45 45% followed by technology, real estate and consumer defensives. The basic materials were down the most 1.64%. You're looking at the oneweek performance energy, technology, and industrials followed by healthcare basic materials and communication services were the the lagard. Okay, [snorts] so let's talk about some of these um stocks here. And [snorts] we are using the Ichimoku indicator. And just real quickly, you know, the the cool thing about this channel is if you have this platform, the TC2000, you can actually follow along. You can also look at these. You can use you can add your own indicators. There's a little plus button up here. You click on that. I mean, just take a look and see what you can add. There you got the ADX, the Aroon, Aroon oscillator. Um, you got you can do custom. All right. You got the CCI. That's a That's a good one. We've got Elder Bear Power, Elder Bull Power, Ichimoku. There's the one that we're using today, right? Uh, you got the MACD and and uh all types of moving averages that you can add. Stochastics, of course, relative strength index, they're all here. They got a good good number of indicators that you can utilize, but [snorts] they even have some of their own proprietary which is which are very interesting. So, but we're using Ichimoku. Ichimoku is a Japanese indicator. The idea here, let me get rid of some of these lines just so give you guys a brief overview of what we're looking at here. We're looking at a cloud. The Ichimoku cloud. That's right. It's the only indicator that I know of that has a cloud. And it's derived by taking specific, you know, parts of the moving averages here. So you're looking at this Tenkenson for example, that's the nine period. Takes the midpoint of the last nine periods, plots it right there. The midpoint of the last 26 periods, in this case, 26 days would be the red line. They also call that the Keeunen. We want that green line above the red line. That's a bullish scenario right there. We also want price to be above both moving averages and above the cloud. How is the cloud derived? Well, the person that created the indicator, and this we're talking going back into the late 1930s where it was initially incepted and it was finally published, this this individual Goichi Hosoda, okay, I think I pronounced that correctly. He held on to that indicator for over 30 years. and then he made it public okay in the late 1960s wrote some volumes on this indicator uh and so there's some books on this obviously and then it started becoming adapted here in uh or adopted here in the United States probably around the 1980s and then of course with technology with the software that we're utilizing right now charting software it's really easy to just throw that indicator on and then we can observe oberve and see how price is moving in relation to these moving averages. There's just five moving averages. It might look complicated. It's really not. Uh this blue line that you see, which is part of the cloud, they call that the senku span A, that's derived by taking the midpoint of these two moving averages. All right, it's the midpoint and then projecting it 26 periods, plotting it out 26 periods into the future. The purple line is the sinus spam B. They take the midpoint of the last 52 candles here. All right. Instead of plotting it below or above the the current candle, they project it um 26 periods into the future. And that's how the cloud is formed. And then there's one final um line right here. That's the current price projected 26 periods ago. They call that the Chico span. We want that white line to be above the candle 26 periods ago. When we have all of those elements in the correct order, as you see here, that's a bullish chart. Very bullish, in fact. And it's obvious. You can see the price has been moving up once it broke through the cloud back here. Uh we're talking about back in April of 2026. Crowd Strike has moved up 106.13% so far. Okay. And if we look at the the weekly chart as well. So, what I'm looking for personally, I'm looking for both the daily chart and the weekly chart to tell me the same story. And guess what? Both of these charts, okay, the charts look bullish on both time frames, the longer time frame and the shorter one. And price is above the cloud here, above the moving averages. They're in the correct order. That's why Crowd Strike gets a blue flag. only four of the 19 ticker symbols, okay, meet the criteria that I'm talking about here and would be considered something that I would personally want to potentially own in my portfolio. And so Crowd Sty is one. Here's Dell. Look at Dell. Here's the weekly chart. What's interesting about Dell is uh it was consolidating, meaning it was going sideways for quite a while here. Each one of these candles represents one week. So, think about how many weeks have progressed here before we finally got a nice bullish candle here getting above. Now, I will say this, there's a there's a stipulation. This candle is still in the process of forming because it's Thursday and it's not Friday yet. We still need to wait and see tomorrow. And we'll probably have a better idea around 3:00, 3:30 p.m. Eastern time where this stock is, where this candle is going to be. Uh ideally we need to see it stay above above okay the highs here and I think that's possible. So Delta is looking good on the weekly and here's the the daily chart also looking pretty bullish overall. It was up 2.07%. Now you'll notice that there's another indicator down below called the directional movement index. Okay, I'm expanding that so you can see a little bit easier here. What we're looking for here is the green line, which is the positive DI9, to be above the negative DI9. All right, I've got it at a faster setting than the traditional setting. And the ADX9, all right, which is smoothed up to the 9 as well, so it would be ADX and 99. We want that white line there to be moving up when while the green line is above the red line. This is telling us that the momentum is starting to increase to the upside. So, we're in the beginning stages here with Dell. I like what I'm seeing. I'm like I like what I'm seeing with Dell. So, yes, it's something that I would certainly consider. Um, let's see what else we've got. And by the way, if we go back over here, you can see the highs were around 46919. You know, that's probably a level that we need to stay above. Uh, let's look at KBE. This is the the bank, the Spider S&P Bank ETF. This is the daily chart. You see three days in a row above the 9 period, which is good. All the elements are in the correct order on the daily. All the elements are in the correct order on the weekly. It It passes the test. I like KBE. I like Nvidia. That's right. You heard it here. Weekly chart. Okay. Price is above the moving averages now a couple of weeks. And the cloud although it is relatively flat you can very distinctly see that the single span a the light color blue line is above the purple line and that's really important that that's also in the correct order. Now weekly chart and here's the daily. Okay. Now there is one thing about the daily chart that I would say um we're above the cloud. All the moving averages and everything look great. There's just one more day I think that we need to wait it out on because this susp. I'm worried to share that with you. I think Nvidia's got a lot of potential here, but I would still wait until obviously tomorrow afternoon before making a decision on this one because it's just on the brink. Now, the rest of these folks, is something off? Is something not not uh in alignment on these uh on both time frames, the daily and the weekly. And so, they don't get a blue flag. Let's take a look at a LAB. That's [snorts] Astera Labs, Inc. currently under the cloud. All right. And it's been declining from these highs here back on August 4th. It's dropped about 12.6%. Notice the cloud is bearish. Notice how the sync span A is under the sync span B. Notice how the white line which is supposed to be above the candle 26 periods ago is under. And again, this white line is the current price projected 26 periods ago. We want that to be above, not below. All right. So, no on Lab. Look at look at the directional movement index. This is this also is a double confirmation here on the daily chart. Notice the red line is above the green line. That's not good. We want the green line above. Okay, let's go to the next one. AMD on the daily is inside the cloud. Chico span white line is under. No on this one. I'd skip this one, too. You don't really need to spend too much time. Here's the the beauty of this indicator is the fact that you know you can at a glance which is what Ichimoku stands for. We can quickly assess the scenario, the situation, what's going on and we can either you know investigate further or we can just skip it all together and look for something a little bit more interesting. All right, Amazon. All right. So re in recent um weeks now we broke above the cloud but it's been declining from this high here uh from August 3rd it's dropped to 7.9%. It's currently two of these candles here two days now we are currently under the 9 period. Uh the cloud is still bullish in the future. The chica span is still above price. So that but where price is under the 9 period I would be holding off. It's something I would certainly keep in keep my uh keep in your watch list because the weekly chart is bullish. Okay. So, we just need that confirmation on the daily. CBRS is inside the cloud. No on this one right now. Here's the weekly chart. Okay. The weekly chart hasn't even formed quite yet because there's not enough data here. So, the daily chart is um is not bullish yet. You look at the 30 minute chart, you know, very messy uh looking chart. I'd stay out of this one. It was down 11.85% today. All right, let's take a look at the next one. CRWV, which is core weave. Ooh, a shooting star candle. This is very bearish, guys. You see that long wick? Do you know what that represents? It represents selling taking place. So here's what happened today and what that candle is telling us um in a visual way. So the body of the candle represents okay if it's a red candle the opening price is at the top of the body of the candle. So it would be right there and then price finally closed right below the opening price meaning making it a red candle. If it was uh up day the opening price would be here and there's the closing price. Okay, opening price, closing price at the end of the day. That's what makes it red or bullish, light blue like you see here. What does the wick represent? Well, it shows that although price opened here, it moved up quite a bit. It just shows you the high of the day and then the bears took control and they pushed it all the way back down right back into the cloud. Not a good sign. And by by the way, this is a daily chart. I can show you all of that action if I just switch it to a shorter time frame like a three minute. Here's a threeinut chart. So there we have it. So let's let me kind of show you guys exactly what transpired here and you can see what I'm talking about. So here was we are August 13th. All right, this was uh 9:33 in the morning. This is the big jump, right? And then it reached this level at 9:48 a.m. And look, it created another shooting star at 9:48 on the 3minut. And this little candle led to the decline where CRWV dropped from that point 8.1%. Interesting, right? So this indicator is not just great on the weekly and daily, but you can certainly use it on shorter time frames. 3 minute, maybe you want to use a 10-minut, that's fine. Look at the 10-minute. even the 10 minutes. So, it's telling you stay out of this, okay? Uh once we get that shooting star type candle or it's telling you to take your profits right there, you know, so if you were trading this on a two-minute chart, uh you see this big up move in the beginning of the day, then you start seeing price starting to reverse here and it starts pulling back. So, CRWV um again on the daily chart, although it had some nice uh a nice jump um it got above the cloud significantly, it dropped right back in. It was down 1.34% by the end of the day. Um and the cloud is still bearish. The directional movement index is bullish, but we don't have all the confirmations here obviously, right? If you look at the weekly chart inside the cloud, let's look at Cisco. Cisco in the weekly chart closed. Well, I take that back. On the weekly chart, it hasn't closed yet. Remember the weekly chart is Thursday. We won't know what the closing price of this candle is until Friday afternoon, but it's currently under the 9 period. It's not looking optimistic. It was down 8.4% today. Here's a daily chart. It's the big gap that occurred today. So, I'd hold off on this one. Obviously, Cisco is not something I would be touching. Here's another one. Ferg Ferg is for Ferguson Enterprises. This one pulled back. It's currently sitting right on the 26th period. Gave us a nice little bullish candle up 1.25% on the daily. What does the weekly chart look like? I mean, we have a future bullish cloud price. Do you see this pattern here? Let me show you. It's a double candle pattern right here. It's when you have a small bullish candle followed by a large red candle that engulfs it. They call that a bearish engulfing pattern consists of two candlesticks. I would not be adding positions here just looking at this weekly chart. So even if price, for example, hypothetically uh you know is above the moving averages, it's above the cloud, it's everything is looking good here, I certainly wouldn't get into it. And by the way, there's there's something else that I saw that was negative. The white line, the chica span is currently under that candle. That's also bearish. So no on Ferguson. Google on the weekly chart. We do have the Chica span above price, but price currently is under the 9 period. Let's look at the daily. It's under the cloud, too. You know, not the time to be adding positions in Google according to this indicator. You can do what you want, of course. You know, this it's a free free country. Uh I I personally wouldn't be buying it right here. Meta is also another one I wouldn't be buying. It's inside the cloud. It's under this declining 200 day moving average. It's a very messy, messy looking chart. Look at this. It just doesn't appeal to me personally. I would hold off on this one, too. Notice how the cloud, by the way, the cloud also tells you when things are erratic in a stock. Okay? It's like a personality of the of the of the stock itself, just like human beings can be pretty erratic. I'm sure we all know a few of them, right? Some might even be famous, right? Here, move up, down. It's all over the place. No clear direction. And by the way, that's how the cloud itself continues to form. It becomes bearish when the synchro span A crosses under the synch B. Then it crosses back above over here. It crosses back under, crosses back above. It's telling us maybe it's maybe something we don't want to get involved with. All right. There might be some drama involved with this one. So maybe stay out of meta for now is what I'm saying. All right, let's keep going. Let's take a look at the next one. Microsoft. Okay, now this is looking a little bit more positive because I can I can see a pattern here with Microsoft at least. Uh so we we call this a double bottom pattern. Do you see this little area here? It's where price reached this level here. Okay, we found that same support at right here and they call that double bottom. When price breaks above the high, which it did right there. In fact, it gapped above. Now Microsoft is looking pretty interesting on the daily chart. The only thing with Microsoft is that uh if we so on the on the daily I'm okay with it but if you look at the weekly uh not all the elements are in the correct order. We get the seno span A here under sle span B. In fact actually that's the only really negative thing. So Microsoft has a lot of potential here. I don't like the type of candle that's forming at the end of this week. You know it's Thursday and we're forming a red spinning top. That's a reversal candle right there that you're looking at. So, no on Microsoft for the time being in my opinion. Netflix, I mean, it's been in a decline since this point here back in July of 2025. It's dropped about 41%. Our dear Netflix has dropped that much and uh it's still in a decline. It's got a lower highs and lower lows, right? So, this high here is lower than the prior one. All right, this low is lower than the prior one. What does that mean? You're in a downward channel. That's a bearish scenario to be in. Why? Because we don't know exactly when this is going to turn around. Is it Is this it? Is this going to be the turnaround? Possibly. But you could have said the same thing right here. Did that work out? No. Was price under the cloud? Yes. And then what happened? It continued to drop. So, it's always a better idea to wait for that break above the cloud. As you can see, if we go back in time, we can we can back test the Ichimoku. We can back test this Ichimoku indicator, folks. I'm telling you. They say, "Sir, how do we know this thing works?" I say, "Well, there's a thing called back testing." Okay, you can reverse engineer it to some extent. Okay, we can see over here, for example, that price broke above the cloud. All right, from this point to this high over here, price moved 209% in 2.1 years. Once price got under the moving averages, that was the beginning of a potential decline. Not a guaranteed one, but it started to, you can see here, price held under that 9 period the majority of time. Then we had the negative crossover take place here, right? The faster moving average crossed into the slower one, dropped, got into the cloud, got under the cloud, and it's been under the cloud this whole time. Hence the decline that you see now. Uh you know it's always positive when we see price react to this dotted yellow line. That's the 200 day simple moving average. And it has in fact even though it closed for one week, a couple weeks actually stayed underneath the 200. You can see this little rebound taking place here for the last four weeks in Netflix. And it could potentially be the turnaround. But again, this I don't think there's enough data here to suggest that that yes, this is going to be the the turnaround for Netflix necessarily. If you want to get be one of those individuals that gets in early though, okay, then you can of course trade it on a shorter time frame. Just recognize that it's going to be a lot more um vol there's going to be more volatility. For example, on the daily chart, Netflix is entering the cloud. On the daily chart, you know, the faster moving averages crossed above the slower one. The nine is above the 26. Um, you know, so if if we switch it to a 4 hour, we'll see even more positive things happening here. There's a 4 hour. It broke through the cloud in the 4 hour. Could you trade this in the 4 hour? You certainly could. You know, if you want to be in very early on something that could potentially move move up even further, you can do that, right? Um, but just keep in mind that then you have to pay attention to this thing on a every four hours and uh most people don't want to do that. Or you can set up stops. You can place your stops of course as well. All right. SanDisk Corporation is inside the cloud right now on the 4 hour. Let's look at the daily chart. It's under the cloud right now. So again is another one that has moved up. It was up 13.67%. That beta that you see right there 4.7. That means that there's it's a very volatile meaning it's uh there's a lot of um volatility each day as far as how far the price can move. I mean from these lows right here back uh we're talking about let's see July 29th just since July 29th of this year this company has moved up 51.33%. But just also recognize that from these highs over here back in June, it dropped approximately 56% in just one month. So it's a volatile stock. They can it moves a lot more. Right now it's not technically sound according to the Ichimoku on the daily chart. Even though it is moving up, if you look at the weekly chart, we're still under that 9 period, but it seems to be at least stabilizing, which is good. S O XXX is also stabilizing here too. So the semiconductors have found a little bit of support at that 26th period in the weekly chart. Here it is in the daily. It's inside the cloud, but it's not a buy signal for me yet because we still have a bearish cloud here. UNP, the Union Pacific Corporation. Okay, industrial sector railroads faster moving average under this lower one. It's been recovering a little bit here. It's up 1.38% today, but uh it's under that 26 as still. And on the weekly chart, it looks very bullish on the weekly. I have nothing negative to say about it on the weekly because it did pull back a little here. Found some support and now it's bouncing. And remember, you it's generally a good idea to to start off with that weekly time frame before making a decision on anything else. Check to see where that's at first. Does it, you know, if if the longer term chart chart is telling you, hey, this is a bullish um stock or ETF. Okay, then you can switch it down to a daily and say, okay, let's see what else is going on here. Like technology, for example, on the weekly chart. Last week, I talked about how price broke through the tenants. That's was a very bullish signal for technology, right? On the weekly, it's staying above the 9 period. And now on the daily chart and we have a bullish cloud here. And now here's the daily chart. And it's almost basically back to h being into the blue flag um you know status which means that it's going to be positive on both the weekly and the daily. The only thing that's holding it back is still the the Ichimoku cloud is here is still bearish. But again, you know, it's uh it's looking more than likely that we're going to see continuation going into tomorrow and next week based on this type of candle that I'm seeing here. And because of the movement that I'm seeing here with the directional movement index, notice how that ADX is moving up, green line is moving up, red line is moving down, and they're in the correct order. I like it. All right, let's take a look at the indices first. The SPY looking very bullish on the daily and on the weekly. We're in a bull market still. Um, you know, there's a lot of geopolitical risk out there with what's going on in the straight of horm doesn't seem to be impacting the stock market. Okay, more and more money is coming into it. It's pushing the market up further. Uh the SPY has has meets all the criteria on the weekly and the daily. The Dow does as well. Now, here's the weekly chart. Here's the D the daily. It it's barely right above that 9 period, but it did close above it. So, I like the Dow. I like the the So, that's the DIA ETF. I like the Russell 2000 ETF, IWM. Here it is on the daily chart. See that green line crossing above the red line? That's a good sign right there. Shaker span is above price. The cloud is bullish. Here's the weekly chart. I like FEZ. That's the Euro stocks 50 ETF. Here we are on the weekly. Here we are on the daily. So, we're getting more and more uh confirmation from all the majority of the indices. And the Q's, by the way, are getting stronger by the day as well. Let's look at that weekly chart. Very bullish on the Q's right now on the weekly. Okay. What about the daily? on the daily. There's just one more day and I think that single spin is about to cross. So if tomorrow's enough is we get a bullish day tomorrow, I think that the cues are going to be obviously a nice um you know in a good place. We got all the elements in the correct order now. And yeah, it takes a little time for it to actually all materialize. But then you can feel a little bit more confident about the direction of the overall market because look, just go back in time, back test when price is above the cloud, when the faster moving average is above the slower one, when the the cloud itself turns bullish, all you got to do is go here for example, right? Let's look at this cloud here. See where it turned bullish right here? It was negative, turned bullish. Now, we would have seen this 26 periods into the past. So, let me go back 26 periods and I'll show you guys exactly where that happened. Right there on this candle, this one right here. Okay. So, when on this specific date, April 14th, 2026, we'll go ahead and uh let me highlight that. All right. Whoops. There we go. April 14th. On that specific day, if you had looked at the cloud, the future cloud, and you projected it out, 26 periods, right? 26 bars, this was what was going on. What did that lead to? Nice move. Does it always do that? No. But is there a higher probability? Yes. That's all. That's all it is. This is a probabilities game, folks. That's it. There's no guarantees in the stock market. Everyone knows that. All right, let's go to the VIX. Uh, which has dropped actually was up.14% but we have a red candle on the daily chart. It's at 14.63. That's good. We want to see the the volatility in the markets dropping. That actually helps to push price up in the markets. So, the VIX is at a very healthy level of 14.63. GLD dropped a little bit. You know, when more more money is going into the indices, it's coming out of other places, defensive places like gold and silver. Gold dropped a little bit, 1.47. It re-entered the cloud. Found resistance here at the 200 as well, you know, but it's it's been doing pretty good because it it found that double bottom down here. This broke through that box. We'll see if it's just a short-lived little thing and then we'll see if gold uh can continue moving up. Silver also pulled back a little bit 1.52%. What about Bitcoin? Bitcoin IBIT is inside the cloud. Nothing happening here with Bitcoin. This is the IBIT ETF. Nothing interesting. It's just stagnant as I like to call it. ETH. All right. Same thing here with Ethereum. Um stagnant nothing. So, why put your money into something that's not moving? Okay, look for the things that have some momentum that are showing some some strength. By the way, the whole idea behind momentum, um, you can you can actually visually recognize when there's momentum by looking at this ADX9, this directional movement index. If you see the white line is dropping like it is here, that's telling us that price is most likely moving sideways, which it is, right? When the ADX starts moving up like it did over here and let's assume that the red line is above the green line. Well, guess what? The momentum is going to increase, but it's not in a in a good way. It's going to increase to the downside. Bam. Right. Not good. All right, let's continue here with our members request. We're going to look at So, out of these five ticker symbols, BLZE has a blue flag. Uh it basically on the weekly chart we get the bullish cloud synchro span a above single span B price is above the moving averages everything is in the correct order here it's called back blaze inc it's in the software infrastructure technology sector which is starting to strengthen and so I see positive potential here it's not a profitable company yet negative profit margins 13.07% 07%. But, you know, you can certainly check to see how the company's doing. Let's look at the daily chart on this one, too. Prices above the moving averages. Uh, prices above the cloud. By the way, one thing I should mention about this particular company is that it moves. When I say it moves, it moves a lot. Uh, it moves a lot. Okay? Believe me, I've never seen a stock like this before. Just kidding. Um, but take a look over here. See where it broke above the cloud? That happened back on May 4th, 2026. Since May 4th of 2026, this stock has moved up 355.46%. It's it's uh it can be exciting owning a a stock like this, but it can also be quite dangerous when things start to drop because it's hard to also recognize exactly when that might happen. Uh the of course the indicator helps us a little bit here. We can see that pullback that took place here before it started to recover again. So right here, for example, if you got out when price got into the tenkinson, you could have probably saved yourself a little bit of money, about 26% drop in the stock. Uh over here, it moved up. You if you exited right there, you would had a nice 54% profit in 20 days, which is kind of insane on the daily chart. You can also trade this. This is something I would probably trade. Uh it looks a little bit volatile on the 30 minute. Let me see what let me see what time frame I would probably consider this one on. I mean maybe a 2hour time frame I can see see how the price is holding up nicely right there and um once it's in a decline it stays under for a while. So probably I would probably trade this on more on a two-hour time frame because it is so volatile. It's very volatile. All right, GDX is the gold miners ETF and this one has also pulled back today following gold down 2.96% pulled back under this 88.99 level which was a prior high right there but holding up above the 200. So we might see a bounce tomorrow potentially. The green line is still above the red line but the ADX is just moving sideways. So again I think there's just a break that's taking place here with GDX. The future cloud has turned bullish recently on the daily chart for GDX. So things are looking slightly more bullish than bearish, especially since price is above the cloud and the cloud itself is the future cloud is bullish and we're above the 200 on the daily chart. Now let's look at the weekly though. Okay, so on the weekly we're inside the cloud. Okay. So, again, it's just sideways right now and we're also onto the 26th period. Let's look at IWF on the weekly chart. This is the Russell 1000 growth index. I like it. It looks great here on the weekly. You can see two weeks in a row where we're holding up above. On the daily chart, the cloud is about to turn bullish. It's not there yet, but almost there. Uh you can see that the ADX has been um dropping which means that the moment there's no momentum currently but that can change very quickly. Uh if price for example was to break through this consolidation stage here this little box that you see that I'm drawing. See how it's moving sideways there. If it can break above then yes I can see an expansion uh for IWF. What about Oracle, which was up Whoops. Oracle was up 1.98% today. Let's start off with the weekly. Always important to look at that weekly chart. Currently on the weekly chart, Oracle is in a downward channel. You see that lower high [snorts] and we are have a lower low. So just on just based on that scenario, it's not something that's uh for me something I would want to be getting involved in right here. If you have a position in this though, I can say there's some positive news. Uh especially entered somewhere around here. It has moved up about 33.98% from from the lows. 35 to be exact. So it has moved up, but it's finding resistance right now at the 9 period on the weekly chart. And on the daily chart, we're still under the cloud. So, but it's currently at least for the short term in a uptrend. It's moving. Well, when I say uptrend, short term, we're talking about like a 30 minute. Okay? Do you see what I'm talking about here with Oracle, it's been moving up, but on the daily chart, we're still, although we've been moving up these last, I don't know how many days it's been here since um July 28th. You know, just recognize there's more resistance coming up. How far are we from resistance? for about 7 7 and 12% away from resistance to the cloud itself. All right, next one. TSSI. Oo, we got a shooting star here today. That's a reversal candle. High volume on TSSI, which is TSS Inc. also in the technology sector down 1.24% today. What does the weekly chart look like? It is um the weekly chart down 1.24. Next ear is August 13th. Let me see what the market looks like. What does this stock look like post market right now? Ooh, dang. So the it's down 24.86%. It's dropped a lot. Um very volatile. Okay, but that's what happens sometimes if you're in a stock that uh is going to come out with earnings and prior to earnings, it's uh not looking good to begin with, right? Because it's under the cloud here, you can see. So, this is what it looked like at 4 p.m. This this was the weekly chart at 4 p.m. It was looking slightly bullish post market. Bam. This was happening. And we can look at the three-minute chart so we can see what's going on here. There's the big drop that happened uh after hours today, 4 p.m. It seems to be stabilizing at least, but it's down 24.86. All right, guys. That's going to do it for this video. Let me show you how you can get access to this charting platform for free for a month. What you want to do is go to my YouTube channel. It's called BlueCloud Trading. We've got 32,300 subscribers. If you haven't subscribed, hit that subscribe button. Hit the notification bell. And to get access to that charting software, click on 10 more links right here. See this? Boom. Quick description about my channel. Scroll down. 10 links. A lot of links. We got a lot of links here, folks. And this second one is the one where you'll get access to the TC2000 software. Okay, $25 coupon. What you do is you click on that. It will bring you to this page, this very bright page. And you can enter your email here. All right. And then basically you will receive a $25 coupon towards your TC2000 service courtesy of BlueCloud Trading. And what else? Oh, the one thing is that's important. To be eligible for the coupon, you must not have had TC2000 service in the last 12 months. All right. Now, let's talk about the different pricing levels, software plans. Click on monthly basic. This is $24.99. You can use it. Here are some of the features of the basic, but if you want to get access to the premium features, I would recommend upgrading to the premium level for $49.99 a month. I use premium plus, but I do a lot of trading. And uh what it does gives me more information here. See this real-time market pulse indicators, live auto refreshing filters, intraday performance columns. And here's a, you know, I can track up to 1,000 alert stocks uh with alerts. Uh, under the premium, you get 100 alerts. Under the basic, you get no alerts, unfortunately. All right. And you can also bring the price down on any of these. If you pay for it annually, it brings it down to these price levels. And if you play pay like for two years in advance. Okay, so if you pay for the for this for 12 months in advance, you basically get this. These are the monthly prices. If you go to the buy annual and you pay for it upfront for 2 years, it brings it down significantly from $49.99 to 37.49 for the premium and from 99 to 74.99 for the premium plus. Um, you know, it's really important to keep an eye on your stocks. It's important to be in the know, you know, don't rely on necessarily that what the pundits are saying on TV. Double check, you know, check those stocks. Make sure that, okay, it makes sense. Uh, the this this type of platform, this type of software can actually save you money in the long term if you have large investments in stocks, obviously, right? because you you're going to have a a better idea of where everything is. And by the way, there's one more thing about this this platform. What what I love about it is that they also have uh they're also a brokerage. So you can trade right on the through the chart. All right. And the cool thing is they are connected with interactive brokers smart routing. So all the processing, all the trading takes place on a very secure interactive brokers platform uh as well. So, they're partnered with them. Okay. The IB Smart routing. And what else can I tell you? Um, yeah. Brokerage. Okay. I'm not sure what else I can share with you guys about this. I will say this, there's a couple more things that you may want to also consider while you're here and you're sticking around for more information about my channel. Let's go to this folks. Let's go to the become a member link. All right, the top link. If you click on that, what happens? It will bring up this popup. All right, under blue cloud trader. By the way, you can become a BlueCloud supporter right now. Looks like they sometimes YouTube does this automatically. I'm not even putting this promo in. They do this. They they handle a lot of this stuff. $0 and then it's $4.99 a month. Um, and you'll be reminded 7 days before your trial ends. So, you can try all this by all what do you get under BlueCloud supporter? You can request a stock or ETF to be analyzed on an upcoming show video like the ones I just did. So if you want to do that, become a blue cloud supporter once one per month. Blue cloud trader, you get you can request up to two stocks or ETFs be analyzed per month. You'll also get access to the exclusive member onlyly strategy videos. I'll talk about that in a second. Under BlueCloud Legend level membership, all right, it's a little higher price, but you can request up to three stocks or ETFs each month. There are some day trading videos you can that you can watch that I've recorded. There are this is the key thing you'll get. Oh, you'll get access to those exclusive member only videos and the daily stock and ETF trade update. Today, for example, I did it a little bit earlier than normal and I think I'm going to start uh doing that. I'm going to try to get my um trade updates out there a little bit earlier, okay? When I possibly can. But it's always, you know, my intent is to try to get all my trades uh in a post to my members to the legend level members, right? So, as a legend level member, you'll get access to the trades that I'm placing throughout the day. So, consider becoming a legend level member. And I try to post those, of course, before the market closes because that's the most important time so that you guys can also view those stocks and ETFs. Uh, so that's it. And then once you do, you just kind of scroll down. This is where the member only videos are. This there's like hundreds of them at this point, I think. And so check it out. And I'll catch you guys all in the next video. [music] The ichimoku guiding [singing] light. Blue cloud trading [singing] through the night. Oo.

Comments 0
Sign in to join the discussion.
Sign inNo comments yet. Be the first to share your thoughts!