communication services I hold a lot which includes uh Meta uh Google and Netflix these are the three biggest communication services and and meta is down for the year Netflix is down for the year but I don't uh mind because I've been accumulating shares long run they will do very well in my opinion
Context
"communication services I hold a lot which includes uh Meta uh Google and Netflix... and meta is down for the year... I've been accumulating shares"
communication services I hold a lot which includes uh Meta uh Google and Netflix these are the three biggest communication services and and meta is down for the year Netflix is down for the year but I don't uh mind because I've been accumulating shares long run they will do very well in my opinion
Context
"communication services I hold a lot which includes uh Meta uh Google and Netflix... and Netflix is down for the year... I've been accumulating shares"
vs. index—
SPY is the benchmark here — there is no excess to measure
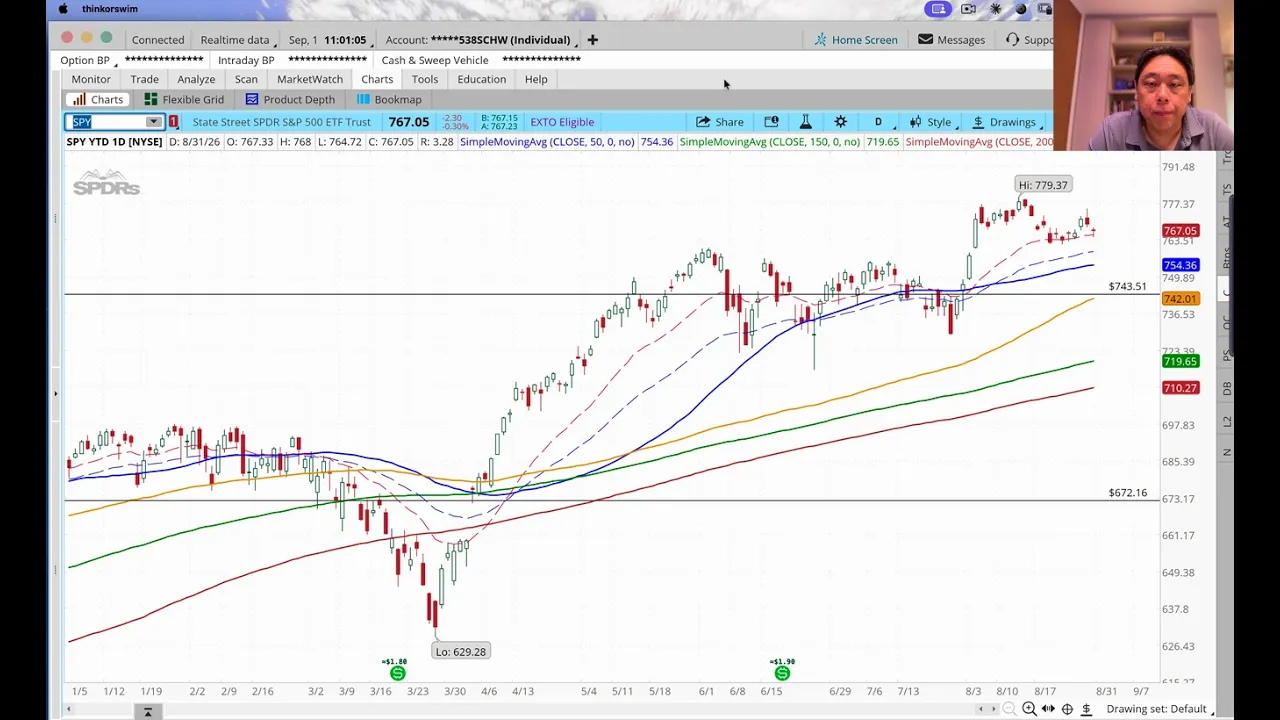
For those of you who do uh you can see these support levels that I update every month and the latest support level would be number one at 743 and 672 uh 604 and 548. So these are the four support levels uh for the S&P 500. And again you can see why that is the first support level because it coincides with the 20 EMA. So the 20 EMA the red dotted line acts as the first support. So whenever there's a small wave down, boom, it bounces off, bounces off, bounces off. All right? So if it retraces there, it tends to bounce off that 20 EMA. So that is a small retracement. Of course, if it breaks the 20, then it could be a bigger pullback or bigger correction. Then we look at the subsequent support levels where if I go to the monthly candles, you can see why I drew it. This support level coincides with the 20 EMA on monthly candles, right? Very strong toing, right? So, you'll you'll bounce off there if it goes down there or it may bounce off there, right? That's the probability. Next support level at 604 coincides with the 40 EMA on monthly candles. And then the last support level 548 coincides with the 50 moving average on monthly candles. So all these support levels coincide with major support levels based on dynamic moving averages or historical uh horizontal support patterns. As you know September tends to be historically the weakest month of the year. And of course the question is Adam if we go down in September how much will we go down? Well that's your answer. Probability is that if we go down in September we will find support at these support levels more likely at about 743. I I don't think it's going to go to 672 in September. Okay. So, year-to-date performance. Uh year to date, you can see the S&P 500 is up 11.75% year-to date. The Dow Jones Industrials up 9.94%. The NASDAQ 100 tech heavy NASDAQ up 16.86% and the small cap index surprisingly small caps outperforming this year at 18.64%.
Context
"For those of you who are dollar cost averaging into the S&P 500 ETF, again, you can look at the SPY."
Full Transcript
Hi guys, it's the first of the month, the 1st of September, and as always, I kick off uh the first of the month with my market analysis and update. So, we have got about four more months left for the rest of the year. And let's begin by looking at the S&P 500. I'm using the spy ETF as a proxy. Uh, and let's take a look at the the charts first. So, first of all, the charts suggest that we continue to be on a very clear uptrend as you can see as we have got the very nice uptrend pattern over there. And if we look at the uh daily time frame, we can see the 20 EMA, the red dotted line above the 40 EMA. So, for those of you who have taken my courses, you know that when the 20 EMA is above the 40 EMA, that means the short-term trend is up. And then we look at the 50 moving average, the blue line, and we can see the the 50 is above the 150 green line, which means the medium-term trend is up. And then we've got the 200 day moving average in red, and that's sloping up as well, telling us that the longer term trend is up as well. So the short-term trend is up, medium-term trend is up, long-term trend is up. So the path of least resistance is up. Okay? So until the trend changes, the probability is that prices will continue to move higher towards the end of the year. Uh but as always remember that on an uptrend, prices don't go up every day, every week or in fact every month, right? They go through wave patterns. uh you've got you know wave up, wave down, wave up, wave down, wave up, wave down, wave up, wave down and of course the pattern continues. So you can see that in March this year uh we had this correction over here and the 20 crossed below the 40. The red dotted line crossed below the blue dotted line which mean that means the short-term trend went down but the medium-term trend and the long-term trend continued going higher even though the 50 crossed below the 150 but the 150 was sloping up and the 200 sloping up so the medium-term trend was very much intact. Right? If you see the 50 crossing below the 150 and they start sloping down and the red line slopes down, then that is a likely bare market. So, we are nowhere near there. We on a very very clear uptrend. And uh if we zoom to a larger time frame, we look at the weekly time frame now on the weekly candles, you can see the trend a lot clearer, right? So, you've got a wave up, wave down, wave up, wave down, wave up. Big wave down here. That was um uh Trump's tariff liberation day that almost caused a bare market. Then the market retrace, wave down, wave up, wave down, wave up, wave down, wave up, slight wave down over there. So for those of you who are dollar cost averaging into the S&P 500 ETF, again, you can look at the SPY. For non US residents, we usually would add the CSPX because it has got no estate tax risk and it's got lower withholding tax on dividends. Some of you may look at um VO, which is a uh another S&P ETF with lower management fee. So, it doesn't matter which one you want to add, SPY, V, CSPX, all the same thing. All track the S&P 500. And for those of you who do uh you can see these support levels that I update every month and the latest support level would be number one at 743 and 672 uh 604 and 548. So these are the four support levels uh for the S&P 500. And again you can see why that is the first support level because it coincides with the 20 EMA. So the 20 EMA the red dotted line acts as the first support. So whenever there's a small wave down, boom, it bounces off, bounces off, bounces off. All right? So if it retraces there, it tends to bounce off that 20 EMA. So that is a small retracement. Of course, if it breaks the 20, then it could be a bigger pullback or bigger correction. Then we look at the subsequent support levels where if I go to the monthly candles, you can see why I drew it. This support level coincides with the 20 EMA on monthly candles, right? Very strong toing, right? So, you'll you'll bounce off there if it goes down there or it may bounce off there, right? That's the probability. Next support level at 604 coincides with the 40 EMA on monthly candles. And then the last support level 548 coincides with the 50 moving average on monthly candles. So all these support levels coincide with major support levels based on dynamic moving averages or historical uh horizontal support patterns. As you know September tends to be historically the weakest month of the year. And of course the question is Adam if we go down in September how much will we go down? Well that's your answer. Probability is that if we go down in September we will find support at these support levels more likely at about 743. I I don't think it's going to go to 672 in September. Okay. So, year-to- date performance. Uh year to date, you can see the S&P 500 is up 11.75% year-to date. The Dow Jones Industrials up 9.94%. The NASDAQ 100 tech heavy NASDAQ up 16.86% and the small cap index surprisingly small caps outperforming this year at 18.64%. And uh my portfolio year to date is up uh based on a timew weighted basis about 20%. All right. Based on a market weighted basis is up 25%. So so far beating the index this year again. Oh, I'm tired of winning. Tired of winning. I'm just kidding. Okay. Uh in terms of sector breakdown, uh we can see that for the month that just passed, uh the best performing sector was basic materials. Boo. Right? Why? Because you guys know that I don't invest in basic material companies. These are commodity companies. I avoid because long run commodity companies are very cyclical, very unpredictable, low margins, weak economic mode. Right? So I avoid uh commodity companies. Okay? But there's one I own which is not really a commodity company. All right? It's a group within commodity is group within basic materials but it is not. It is Lind Group. Ticker symbol L I N because they're in industrial gas. They manufacture your own gas so it's not subjected to uh natural gas prices. All right. So it's very predictable. Yeah, that's the only exception. Uh technology has done very well this month as well. Yay. Right. Especially not just uh semiconductors and AI capex stocks. But software is coming back. Yay. Right. Healthcare the third best performer. You guys know that I'm also quite into healthcare. Energy also did pretty well. Boo. you know you guys know I don't go into energy again long run very unpredictable um you know but of course in a short term they can do very well because of geopolitics you know so this year because of the the war in Iran uh and oil energy has done the best you know of course I don't participate in it because I don't hold hold any energy stocks and that's fine because long run uh I do a lot better holding the more secular compounding sectors with higher margins and stronger modes and higher roe and ROIC's. Okay. Uh and of course uh for this month the rest didn't do as well. You know financials, industrials, consumer cyclicals and uh the worst performing have been communication services uh consumer defensive real estate and utilities. These two I don't really care because I don't own any real estate. I don't own any utility companies. Okay, except for REITs. But then again that's in my dividend portfolio. So separate issue year to date energy is the best performer because of oil prices going up because of the war in Iran. Uh tech uh has always been a best performer most of the time. Basic materials, industrials, healthcare, real estate. So most sectors are doing pretty well yearto date. Uh the only ones not doing as well negative utilities which I don't really hold. communication services I hold a lot which includes uh Meta uh Google and Netflix these are the three biggest communication services and and meta is down for the year Netflix is down for the year but I don't uh mind because I've been accumulating shares long run they will do very well in my opinion and of course consumer cyclical or known as consumer discretionary also negative for the year which I have a lot of them right I've got you know AutoZone I've got Macado Libre way you know Amazon right so by the way Amazon is within consumer discretionary don't ask me why that's how they they group it okay so where are we in terms of valuation so as you guys know if you read the uh financial media the fake news I'm just kidding again right I love to imitate the guy um if you you know listen to the news and all that people keep saying oh market's expensive it's a bubble blah blah blah well let's look at the facts once again so first of or we look at the forward price to earnings ratio of the market which I don't think is the best way to value it but never mind. Uh as of 31st August yesterday the forward PE of the S&P 500 is 19.6 times earnings. Is that high or low? Well, if you compare it with the 5-year average, the 5year average is 19.9. So we are below the 5year average and the 10ear average is 19 times earnings. So in other words, you can say based on this, we are fairly priced. We're not cheap. We're not expensive. We are fairly priced as a whole on the S&P 500. What's interesting is at the start of the year in January this year, the forward PE ratio was 22 times earnings right over there. Now we're at 19.6 times earnings. So what does it mean? It means the market is cheaper today than it was at the start of the year despite the market going up 13%. How is it possible? How can the market go up 13% and is now cheaper? Because even though the price went up, what happened to the earnings? The earnings went up even more than the price, right? Corporate earnings have been higher than expected. So that pulls the P down. So what you can see is that the market going up especially this year is the result of higher corporate earnings. It's a earnings driven market not a not a PE multiple or not a uh money supply driven market which is a good thing which means it's is more sustainable. Right. So speaking about earnings, as you guys know, we just completed the earnings season where most of the companies reported earnings and one of the latest ones was Nvidia and they totally had a blowout earnings and Nvidia stock price gapped up. Okay, so for the earnings season that just finished, it was quarter 2 earnings and out of the uh out of the 11 sectors, nine out of the 11 sectors reported doubledigit earnings for quarter 2. Now, what's amazing is this. Earlier this year, they expected quarter 2 earnings to grow 23%. Yearon year. But when the results, now that the results have come out for quarter 2 earnings, you can see that the actual earnings results uh showed 52% earnings growth for the S&P 500. That is freaking insane. 52% earnings growth, double what was expected. And that's why the market has been so strong this year despite a war, despite a weak labor market, despite the 10 year going up, despite all that market so strong because earnings earnings has been very very strong. Now, if we look underneath the hood and we look at the the companies that make up the S&P 500, we can see what percentage are undervalued, overvalued, fairly valued. And again, I'm looking at Stock Oracle, which is a very useful tool to look at. So, as of now, you can see out of the 500 companies in the S&P, how many are very cheap. Uh, you've got 46 stocks that are very cheap. That's 9% of the S&P. 104 stocks are undervalued. That's 20% of the S&P. 134 stocks or 26% are fairly priced. Are there stocks that are expensive? Of course. So, we've got 113 stocks that are overvalued and we've got 105 stocks that are very, very overvalued. Yeah. And of course at stock oracle if you click on these it will show you exactly which are the stocks that are overvalued undervalued fairly valued and it breaks it down by economic mode. Yeah. Green is wide mode, yellow narrow mode, red is no mode. Next let's take a look at what are the macro updates for the month of August. Now as you guys know uh I look at macro news and data purely for entertainment purposes. Are they important in my investment decision? No. absolutely zero. Okay, so I share this with you purely for entertainment for general knowledge but doesn't affect my buy and sell decisions at all. Okay, so what happened in the month of August? So some interesting developments uh you can see in the whole month the market was all about the Fed Federal Reserve debating should we increase rates, should we not increase rates, right? So there's a lot of debate within the Fed. they can't agree because on one hand inflation is not coming down but on the other hand the labor market is weak so the hands are tied at the Fed. So what happened was on the 19th of August uh was the July Fed meeting and they decided to hold interest rates uh at the current level which is the 3.5 to 3.75% range. So that's the fat funds rate. Then 28th August they have this annual symposium at what is known as Jackson Hole where the Fed chair Kevin Walsh gives his speech and basically his speech uh told us nothing. Okay. He shows that he doesn't know what to do, right? So, what he tried to do was he tried to signal his hawkishness that oh, you know, we may have to raise interest rates because inflation is not coming down, you know, but the market's like push it. Okay, because we know that Trump kind of like appointed him because Trump knows that, you know, he won't raise rates as unless he's forced to or rather Trump wants him to cut rates. But anyway, uh the market did increase the odds of a September rate hike from uh from 40%. Now we've got a 57% chance of the Fed raising the Fed funds rate uh in September. Okay. Uh what else has happened? So the long the longterm rates, the 10ear Treasury yield has has been going up. And some of you are freaking out. Oh, Adam is now going to 5%. We're going to die. Well, first of all, understand that if you look at the history of the 10-year Treasury yield or the the the history of the US long-term government bond, 5% is normal. Okay, it is normal. It's just that what happened after the global financial crisis and COVID where the Fed had to cut rates to zero and the long-term rate went down to 2 3%. That is abnormal. Okay. So we had about 50 years of abnormal rates where rates were abnormally low. Right? So now there's no more COVID, no more global financial crisis and the economy is growing very well. That's why the 10ear yield is close to 5% which is normal. All right? So don't freak out. Now if it goes to like 5.56% okay maybe get a bit worried, right? But where it is right now it I don't see much of an issue. Um remember that what determines the the 10ear treasury bond yield? Two things growth inflation. All right. So when growth is high, all right, uh the yields the long-term yields get higher because people sell long-term bonds boring to buy growth assets, right? And of course, inflation also causes the 10ear yield to be high because when there's high inflation, people want to hold long-term bonds. they sell the bonds, the yield goes up. So now that we've got growth and inflation, that's why the 10-year yield has been going up. Uh but of course the US government doesn't like it so much because if the yield goes up, that means that when they issue more bonds, they have to issue at a higher rates. They have to pay more interest on their big debt, right? So uh the Treasury has been attempting to bring the yield down. How? By buying back long-term bonds. So the treasury is going into the market to buy the bonds. When they buy the bonds, what happens, right? More demand, bond price goes up, yield comes down. They are trying to do that. You know, that's what they did. So now they are going to double their buyback to 4 billion uh a month. Well, let's see whether it works. Now, in terms of some macroeconomic data, uh the jobs in the US have been softening. Yeah. So payrolls declined by 23,000. That means they lost 23,000 jobs uh in the month of July which is reported in August. Not only that but they had to revise down the initial uh jobs report in May and June by 66,000 and 37,000. So the labor market is weak although the unemployment rate still remains where it is but that's because a lot of people are leaving the labor market right. So labor market weak inflation still uh not coming down. So headline PC inflation at 3.7% yearonear slightly above consensus core PC at 3.3% and real GDP uh came in at 1.5%. Which is down from 2.1% uh estimate in quarter 1. Now you may think all this is bearish, right? Weak labor market, GDP not very strong. Why is the market going up? Because ironically the market thinks that if the labor market is weak and GDP not very strong the Fed won't raise rates and that's why the market's going up. That's why sometimes the market can be very illogical and that's why I say you know if you try to trade or invest based on macro news you will pull your hair out right because it's illogical sometimes right GDP no good market goes up GDP good market also go up right so you can't tell you can't tell so all this is for entertainment yeah all right so that's the 10-year Treasury yield we started the year at about 4.19% now we're at 4.78% % we're at a high for the year in terms of the long-term treasury yield. Uh this is the yield curve. So because the the long-term yield is going up, the 10ear yield is going up, right? It's going up. What's happening? You've got the yield curve which which is uh steepening. You've got a steepening yield curve. Now is that good or bad? Depends. If you own bank stocks, you own insurance stocks is very good. That's why banks are doing very well because when the yield curve is very steep, the banks can borrow cheap and then give loans higher uh higher interest rate, they make more money, right? So, this is good uh for banks and of course uh if the Fed raises the short-term rate, uh then private credit will do better. So, in fact, notice that private credit has been rebounding uh because uh when they thought that they were going to cut short-term rates, they now raise the long-term rates or rather they're not they may raise the long-term rates. So, that is good for private credit where the loans are based on a floating rate, right? Okay. So, let's end off by talking about what do we expect for the rest of the year. Everyone wants a crystal ball. Again, I've got no crystal ball. All I can tell you is earnings are strong, market is on an uptrend. So probability is that we'll end up uh higher this year from where we are right now. In terms of seasonality, you can see I've shown you this chart many times before. September historically is the weakest month of the year. So even in a midterm year, you can see September tends to be negative. So well, let's put it this way. Everyone expects September to go down. Everyone. And sometimes if everyone expects something, it doesn't happen. It goes up, right? So that's why I say don't say oh and because of this I'll sell everything in September buy back October I'm going to short the market. No please don't do that. All right I say this is for entertainment. No one can predict the market. This is for entertainment. I show you this because if it does go down don't freak out. It's part of the grand plan. All right. But again it may not go down. In fact you can see that since 1950 these were Septembers that did very well. You had September that went up 8% 8% 6%. So you do have good Septembers, right? And you can see that out of the 10 best September since 1950, you know, five of them happened in a midterm election year. So don't be surprised that, hey, September could go up 8%. Now you're confused. Oh, is it going up or down? I also don't know. That's the point, right? We can't predict the market. All right, so that concludes my market analysis and update for September and have a great September. And as always, follow the rules. Don't foro, don't panic. Don't chase the girl. Just follow the rules.

Comments 0
Sign in to join the discussion.
Sign inNo comments yet. Be the first to share your thoughts!