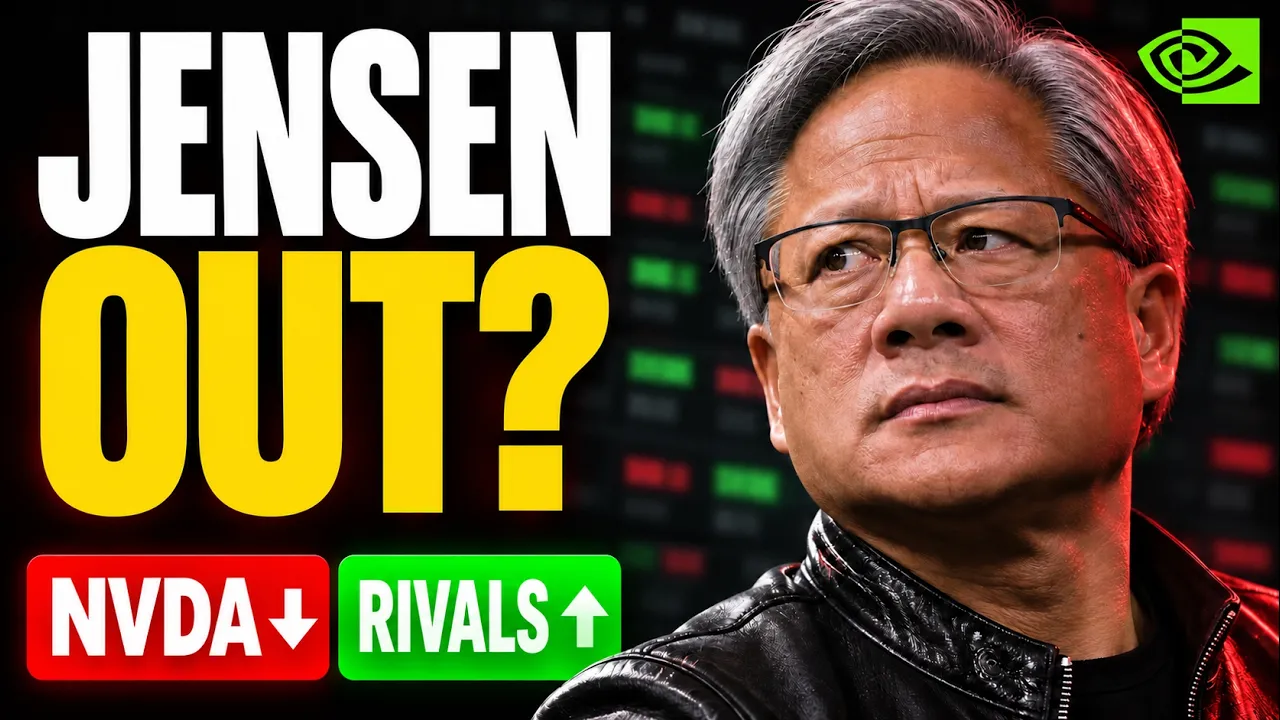
Nvidia Sinks as AI Stocks Surge — My #1 Chip Stock

- Retorno do vídeo
- -4,72%
- Chamadas
- 1
- Compra / Venda
- 1 0
- Publicado
Recomendações
Entrada é o preço de fechamento do ativo na data de publicação. Atual é o último fechamento registrado.
-
Entrada $319,48 09 nov 2026Atual $304,41 20 nov 2026Resultado −$15,07vs. índice +3,6% SPY −8,4% no mesmo período
Citar esta recomendação Ver trecho original (1870s) *
Contexto da transcrição original
…ding fresh money given the board review and the earnings update still ahead. But as we can see in the pre-market, it looks like it is pretty much around there. So Nvidia comes as one of the strong buys today. Then in first place, we've got Broadcom under 300. This is where I'd start. I like that the case comes from Custom Accelerators Networking and Software, and there's room between my price and the lower case in the model. I'm paying around 15 times next year's earning estimate for Broadcom. That's a price where I ca…
Broadcom under 300. This is where I'd start.
Contexto extraído por IA Then in first place, we've got Broadcom under 300. This is where I'd start. I like that the case comes from Custom Accelerators Networking and Software, and there's room between my price and the lower case in the model.
Transcrição Completa
Now, Nvidia is down around 5% in the morning session so far, but we've also got AMD and Broadcom. They're both green. Now, if you own any of these stocks, the split here, it's definitely worth a closer look. And the fresh news that we have this morning is that Nvidia's board, they've opened an independent investigation following reports that Jensen Huang was targeted by a foreign intelligence effort. Nvidia shares where they're falling in the morning. Now, it's also quite key that if we just look at the NASDAQ in the last month, all three of these companies, they're already under pressure. Nvidia, that was down around 23%, AMD down 24, Broadcom down 18. So, it's important here to understand the selling it started well before the weekend. And by Friday's close, the semiconductor index that was nearly 20% below its 50-day average. And today I'm putting six stocks through my valuation models to see where the drop actually gives me an entry. Now looking at Nvidia, we did have a recent message from Jensen to his employees. He said that he supports the investigation that he will cooperate and the board. They've expressed confidence in his leadership and they said that he would examine the available information. And it's not only the Nvidia board. We also have Congress. They're asking questions too and they formally requested Jensen Hang on November the 18th and that's a very important date because just the day before Nvidia is reporting their earnings. So there's a lot of uncertainty now heading into this period. And we've also got Trump who just yesterday was asked whether Jensen Wang should stay on as Nvidia CEO after this news has come to light. >> As CEO of Nvidia, >> I think so. Oh yeah, sure. >> Now that's Trump's view. the independent review that sits with Nvidia's board and here's how Dan IV see the questions an investors asking >> so I think the fact that we're in this situation from an investor perspective the the clear worry is like does Jensen stay on as CEO you know street would say probably likely but given the board investigation anything could happen and that creates a huge uncertainty >> so here's the date that I'm watching house committee chairs as I said requested a closed dooror briefing for the 18th of November, one day after Nvidia report their earnings. They've also asked for reply by the 11th. Now Nvidia, they did close on Friday at $186. We can see in the morning session down around 5%. So currently trading around $177. That in fact puts it now 27% below their 52- week high. And there's a potential that we see in the upcoming days for Nvidia to sit around 52- week lows, not that far off today's price. Now, we're still waiting on analyst views in relation to these events, but currently both Wall Street and Quant do give the company a strong buy. Seek Alpha on the weaker side. We're fascinating for a company that's been very strong over the longer term. Year to date, they're flat. Over the last year, they're down 1%. And Wall Street again, at least before these events unraveled, they were very bullish with the strong buy. They had a price target $327. That implies 75% upside in the midpoint. Bear in mind the range very wide 180 low end 515 at the uptrend and given the EPS estimate that analysts are forecasting for the full year. Now based on the drop we're seeing in the morning session you're actually paying 19 times this estimate if they do earn $15.91 that analysts are forecasting in 2028. Well now you're paying around 11 times. That is incredibly cheap for a company that has posted some very strong growth numbers. And in yesterday's deep dive of Nvidia, we looked at three different scenarios. This is the base case where the intrinsic price comes to $255. You can see here we've essentially used what analysts are forecasting for 2027 to 2030. Bear in mind it is a large jump from 2026. Some analysts actually see 27 much higher around 180 billion. Now given that we've used a 15% growth rate lower than the 5year 10-year KGA lower than the most recent year and that comes to the price we said 255 37% upside reverse DCF Nvidia need to grow around 7.6% to justify today's price that in turn gives us a 27% margin of safety. Now for a quick reminder in terms of the bearish case $217 that is what we got through the numbers where in fact future free cash flow lower than analyst expectations up until 2030 still indicating upside of 17% and a margin of safety still but lower than the base case of 14. Again, quick reminder of the most bullish case. $36 near 40% margin of safety equates around 65% upside although you can see that indicates 2030 $300 billion of free cash flow. Now heading back to the base case just to let you know on the lower case of 10% we get a value of $26. For me, as I mentioned in yesterday's episode, I'd be looking at under $175 for a fresh buy. something that we could see very very soon. Now you can also see that several chip stocks they're already deep in draw downs here in terms of Nvidia we said 27% Broadcom 40% Micron 46 AMD 30 I mean there are others with even larger drops Intel 60% ARM the same Marvel all of these very significant losses even high quality companies like ASML down 27% Lamb Research Ply Materials KLA all of these down around 50% from their highs and the first pre-market reaction to the story about Nvidia is actually gone in two different directions. >> Let's take a look at some of their chipmakers pre-market. Nvidia is seen down 4% and that is in contrast to Broadcom, AMD that has seen higher, Intel a little bit weaker here. >> So AMD, let's start with that in the morning session up around 3%. Does the green tile here mean that I'd buy it at today's price? Now AMD, they did close Friday around $450. It was up 11%. large rebound from the large drop that we saw on Thursday. But even after that bounce, it's still down around 31% below its high of $660. We can see double strong by Wall Street Quan right on the border of a hold from seek out Alpha 3 12 and even being away from their highs significantly year to date up triple digit over the last year up around 89%. Where this is the first chart I pull up for anyone looking at AMD. Look at the bars here on the right. data center revenue. It went from $4.3 billion a year ago to 8.5 billion. That's in fact up 97% year-over-year. Now, it does include EPYC server processors as well as Instinct GPUs and at 8 12 billion out of 13.4 billion. It's roughly 2/3 of total company's revenue. Now, the other thing that you may have missed here, the most recent jump on its own is very striking. $6.7 billion last quarter, now 8.5 billion this quarter. If I'm buying AMD here, I'm betting that growth keeps showing up in reported sales. And you can also see when we go back to this split. In fact, you can note how much the segment matters for profit as well. Data center operating margin, that's 34% across the whole company. GAP operating margin, that was 21% and that was also up 7 percentage points year-over-year. Now, zoom out. We've got the companywide growth screen here. Revenue figures, well, we got 42% growth year-over-year. Operating earnings, well, they've in fact risen much faster. The operating leverage is part of the reason the earnings forecast, they've moved so far. And look at the orange bars on the right. The chart we've got here goes from an estimated $51 billion of sales this year to almost 90 billion next year. That's 76% growth on a much bigger base. And here's where I think you can get yourself in trouble with the multiple. The estimate for this year is $89. The forecast for next year, it's $1765. I mean, on this year's estimates based on Friday's price, well, it's trading at a forward earnings of 55 12. Look at their 5year average that sits lower at 40.3, indicating today you're paying around a 38% premium is a fair bit to pay even after the stock has come down. I mean if you want to look at price to earnings growth metric for companies that are growing very fast83 that's actually at a discount of 19% both to the sector as well as to their own 5-year slightly larger discount of that at around 24 and based on the pre-market where there is a little bit of a rise. AMD, it's now trading around 26 times next year's earning estimate for that multiple to mean anything. Earnings have to more than double even the low estimate for next year. That's coming to $14.51. Now, going back to the growth screen, it actually shows us why investors are willing to pay up forward revenue that sits at 55% forward free cash flow growth that's sitting at 91%. These are big big expectations. Now, if we go back to the low forecast of 1451, if we use that and 457, it becomes about 31 12 times Nexus earnings. It gives you a sense of how much the multiple moves when estimates miss. Now, the balance sheet for AMD, it does help net debt ratios on both charts sit at zero. Financing less of a concern for me here. I'm much more interested in how quickly the sales ramps becomes cash. And you've also got Wall Street. They're bullish. We can see here 47% upside projected. Although even with the average target being $659, some actually see it around double that at $1,250. Now going to the cash flow model, I start with 7.6 billion, which is analyst expectations, and then reaches 42 billion by 2030. This gives me around $525 as the intrinsic price. That's using 15% growth around the 5-year keer and in turn gives us a margin of safety sitting around 15%. The DCF although bear in mind at 10.6% is after analyst expectations from 2031 onwards that sits around 10.6%. with the low case that's at 10% moving forwards pretty much sitting around today's price very minimal difference and at the upper end 20% 628 40% upside we can see that's still in fact below Wall Street they are very bullish in the growth of AMD the other thing to note is that we've got some targets for AMD after their earnings that are very high they've raised pretty much every single one of them some go as high as $725 you can also see one firm only one. In fact, they've cut their target 720 down to 700. Still very bullish in terms of the share price today. Personally though, I'd use the cash flow assumptions to decide what I'm willing to pay. And that's what makes the next stock interesting. Broadcom, that's also green in the morning session up around 2 to 3%. If the idea is to own an alternative to Nvidia, I want to see what Brocom offers at its own price. Now, Brocom, it ended Friday around $293. we can see is up in the pre-market around 2% but a little bit volatile in terms of where it is against their 52- week highs of $495. Well, it's sitting around 40% below that. I mean, it's pretty much trading at 52- week lows where we get not only a double strong buy from Wolf Shrink, seeing Alpha also a fairly respectful buy. Now, in the last 12 months, not the greatest, they're also down around 17%. And the growth for Broadcom, it comes from a business that sells custom accelerators. The networking that connects them and the infrastructure software. We can see here operating earnings growth is a different route into the spending cycle that we just discussed. I mean revenue was up 49% year-over-year, expected 50% moving forward. We've got EBIT DAR projected to grow 54%, EBIT 56, EPS 59%, EPS on longerterm sitting at 55 with free cash flow expectations sitting at 64%. And just look at their daily profit. It tells us how sharply profit rose into August. That's the quarter Broadcom reported $16.7 billion in AI semiconductor sales. It just gives you a sense of how big this side of the business has become. And then when we move to the operating profit on a training 12 month basis is very visible in terms of their growth. The question is at today's price how much more cash the earnings growth turns into. Wall Street like most of the stocks today with their strong buy very bullish they see 82% upside serious consideration for investors. Average target $533 range between $4660 and around $1167 in terms of fullear earnings for October 26. It gives a forward multiples around 2526 using 90 and a half for next year. Well, it's trading at a forward P around the 15 mark. And when we look at EPS on a forecasted basis all the way to 2028, well, you can see how much growth is expected for the company. We're talking in the next few years to really accelerate all the way over $30 per share. Now, also interesting, it isn't just one or two analysts that are expecting massive growth for Broadcom. In fact, on 2027 numbers where the forward PE does drop to 15, we can see 48 analysts. They're expecting massive, massive growth. The lower end of that comes in at $1747 with the upper end coming in at $22.44. Even the lower number, it still calls for a big step up from this fiscal year. And we've got the historical chart. It also does give us some perspective from Simply Safe Dividends. They've got Broadcom sitting below its 5-year average forward multiple. The yield, well, that's also below its own average, although obviously I put most of the weight on their cash flow. And if we were to look at the blue tunnel pointing out the essential intrinsic fair price, it's sitting below the bottom end. That is an undervaluation signal. Last time we saw this for Broadcom, I mean, you'd have to go all the way maybe to the co drop very slightly, maybe one or two days around the end of 2022. And another positive for the company other than looking potentially undervalued net debt to EBIT DAR, it's come down from around 1.9 just a few years ago, now sitting around 6. That really helps when I'm considering how much cushion I need. And the growth screen, it is still asking for a lot. As we mentioned, forward revenue growth is expected around 50% and forward free cash flow growth that's around 64. A cheaper multiple is only as good as the assumptions. And look at what customers are spending. Amazon, Alphabet, Microsoft, Meta, they will spend around $220 billion on property and equipment in the latest quarter. And we've got another chart. This one in fact comes from Goldman Sachs. It uses a separate five company group that also includes Oracle. We can see expectations of spending growth stepping down to 37% next year and 9% the following year. Spending still rises. It's just a rate of growth that is expected to slow. So what do I need Broadcom to do? My model per analyst expectations for 26 starts at $48 billion of free cash flow. We can see most recent year was 27 billion. So a massive massive jump is expected. In fact that's 78%. the August third quarter that generated 13.7 billion of free cash flow brought me just under 32 billion through three quarters. So it needs around 16 billion in the fourth quarter to reach my starting point. That in turn comes to a value of $516 with a margin of safety of 43%. Now in terms of the reverse DCF that's sitting at 11.7% obviously that's after the first year and if we use 15% growth well the price actually drops to 30 $168, but that still gives upside. We're seeing 25%. Now, the other thing that we can do is, for example, if we believe that 48 billion is just too optimistic, we can try 40 billion, see what kind of difference that does on the overall effect of the numbers, that drops to $429 from $516. I mean, if we want to use a slightly lower rate and use a lower starting point, well, it drops to $35. It just shows you how quickly the extra cushion shrinks if cash generation comes in light. Now, going back to the base case where we got $516. Overall, my line here is under $300 is good for a starter position. Assuming the cash flow story is on track, I'd revisit it if fourth quarter numbers come in a week. That puts Brocom ahead of AMD for me at these prices today. Now, let's look at Micron. We can see in the morning session is pretty much flat, down 1% if that. Now, in terms of one of the attractions that investors see for the forward valuation, it sits below 43.9. Of all six stocks today, this is the number I'd be most careful with. I mean, we get a double strong buy from Wall Street Quan, weaker buy from seeing Alpha where they're actually trading mid to lower end of the 52- week range, although definitely worth pointing out here. 52- week low, still long way away, $190. phenomenal year to date, even with the drop we've seen from 52- week highs up 142%. And this is probably the sort of screen that stops you scrolling roughly four times earnings against a 5year that sits 11 with a memory stock. I always want to know what earnings the four is divided by. And you'll also see the undervaluation when we look at the blue tunnel. Again, this one, like we said with some stocks that we've seen, closer to $0 than it is the bottom of the fair value tunnel. I mean, Micron today is trading 45% below its 52- week high. Now, look at the company in terms of revenue. We can see revenue. In fact, in just the last few quarters, it went from 11.3 billion, this is a year ago, to 54 billion. That is an extraordinary change in just one year. Now, move away from revenue and look at net income. Profit chart here is even more dramatic. $37.7 billion in one quarter. Go back to 2023 and you can see several quarters where Micron was actually losing money. We can also note they have a very different position on the leverage chart today. Net debt evid it was above two times in fact in 2023. Now it's sitting at zero. The financial position is also improved alongside the profit picture is also one where Wall Street, I believe the first one so far today, see tripledigit upside 126%, average target, 1562, sums it as high as 3,000, some as low as 360. And here's the number behind the headline multiple 36 analysts. We can see here they give you $176.50 50 earnings for fiscal 2027. Now that is as we can see below four times the current price today. The following year's estimate that's even higher giving a forward P of 3.3. But look at the size of their earnings and cash flow growth rates here. If you take a period in fact like this and you carry it forward well it almost makes any price look reasonable. I want to understand what survives the next slowdown. And you can see further down, in fact, the estimate table here, you get $69 of earnings for fiscal 2031. That would make it today around 10 times earnings at the same share price. Although, bear in mind, there's only one analyst behind this number. What I'll be watching is whether the revenue level on the right turns into something the business can sustain. You can have strong demand for memory and AI systems and still see pricing ease as more capacity comes through. Now, we look at the cash. We can see on the DCF $62.3 billion in fiscal 2026. A year earlier, well, we can see it was under $4 billion. That explains why the valuation output looks so big. We get a price just below $1,300 indicating 47% in terms of margin of safety, 88% upside. But before I take the upside seriously, I want to see what the model assumes comes next. What analyst they're forecasting more. In fact, we've been conservative here. 75 billion of future free cash flow in 2027. From there, I've used 5% growth, the lower case moving forwards. Obviously, the starting year itself, it asks for another 20% increase from the reported figure. Now, this is in fact the largest headline gap in the group today, but I'd be far more interested in what the share price is asking for under a declining cash flow path. In fact, if we kept the 75 billion and actually used minus 5%, which is what the reverse DCF says, that comes to today's price, telling us in fact the growth rate expected from the price today. Here's why I want a better entry. Historically, this business has swung from profits to losses quite quickly. A smooth 5% decline every year is one way to test the price. A memory downturn, it can arrive much faster. If we in fact use a lower starting point, let's say 65 billion here, we can see the price still showing upside $1,130. But if we were to also say it decreases 5%, there's a memory downturn. Well, we get to a price around $64. That's a stress test I've run off this model, and it's the number that keeps me from chasing the headline upside. I'd watch Micron and be more interested below 575, assuming the longerterm demand case still holds. That's a meaningful gap. I want the price to do some of the work for me. And here's the spending side of the risk. Deoid's chart projects memory chip majors going from $97 billion of capex this year to 146 billion next year. The company selling the equipment, they've got a different opportunity here. And that brings me to Lamb Research around $200. We can see it's up 17% year to date over last year up 24% 52 week high that was $439. It's now sitting 54% below its peak of the six today. This is the stock with the deepest drop from its highs. We also still have a strong buy from Wall Street, although Seek Alpha give this one a hold. And look at the bars. Lamb did $8.2 $2 billion of revenue in the September quarter, up 54% from a year earlier. The after hours selloff that we saw, that was from their earnings in October, that was down is down even further from that drop today. And this was the picture the end of October. Sales and earnings, they'd grown sharply while the shares were well off the high. The roughly 239 that you see here again, that was the price in October is even lower today. And the memory spending chart here, it helps explain why Lamb is in today's episode. If manufacturers want more capacity, someone has to supply the tools. Lamb's business gives you a way to invest in the equipment spending. Lamb, they sell tools for steps like depositing layers of material and etching them away. In the September quarter, systems accounted for around $5.7 billion of sales, existing customers. They also buy upgrades, parts, and support. Where Topline was up 33% year-over-year, expected 32% moving forward. Earnings per share over the long term expect to compound around 30% with free cash flow expect to climb 33 in the next 12 months. And Wall Street, well, they're forecasting 81% upside average target $363. And they're currently trading around 21 times June 27 earnings. If you go a year out, we're now talking around 16 12 times at $1224 EPS. And we can also see they're trading below their 5year average. It gives you some context for the sell-off that perhaps it was trading at such a massive premium forward P at one point was sitting above 50 is now even sitting below their average. I still want to see for Lamb Research all of the cash coming through and we also get a slight undervaluation signal something we haven't seen in the last year. I mean last time we properly saw this you'd have to go back to around 2023 where the balance sheet also gives me a bit more comfort. We can see net debt debit that's sitting at zero. But here is the big ask from analysts. They're expecting free cash flow to more than double from 4.9 billion26 to 10 1.5 billion in 2027. Now there is some evidence for a strong year. The September quarter generated about 3 and a4 billion after subtracting HABX and intangible spending from operating cash flow. I want to see how much of that repeats with the reverse ETF. We had 8.1% after 2027. change that 10 half billion first year and the math it moves quite a bit. Now the midpoint at 15% growth we get $317 indicating 59% upside with a margin of safety of 37%. I can see why that's tempting when the stock has fallen this far. The lower case though when we take a look here at 10% $227 still upside also in fact still depends on 2027's $10.5 billion. Now, let's say we were to drop this 10.5 billion to 8 billion for 2027, we get $242 around 20% upside. But if we were to also lower the growth rate to 10%. Well, we can see we'd actually be looking at Lamb Research as being overvalued today. That's the test that I care about. My verdict is watch. I'd be more interested below 170 or if the next few quarters show that 10 half billion is becoming a more realistic run rate for the full year. What makes this one worth following is how far the price has moved even as the company's been growing. If that translates into cash, I can revisit my entry. For now, the gap between those two, they really matter. Now, let's move from the company that sells the tools to the company running the fabs. This is the one I wanted to put next to Nvidia in the final ranking. Is the manufacturer the better deal? Now, we can start with the margin. TSM, they reported 66.4% gross margin in the September quarter. Now, it was down 67.7 the quarter before, but it's still above where it sat just a few years ago. And it's up around 1% in the morning session, $380, up 24% year to date over the last year, up 30% around the midpoint of 52- week range. Alltime high and 52 week at $487 where we get a double strong buy from Wall Street Quan, weaker buy again from Sneaky Alpha. And a foundry, well, it needs a lot of capital. We can see the return on invested capital. It sits in the mid40s. Now it helps explain why willing to spend time on a business that has to keep building fabs. Now the latest margin it also came with strong demand for advanced manufacturing. The company said 7 nanometers and below made up 79% of wfair revenue. That's the part of the business I'd watch as new capacity comes online. And now look at the forecasted bars of sales for TSM. They go from 171 billion in 2026 to 297 billion. Where Wall Street, like all stocks today, they're very bullish, seeing 56% upside, even with an average price target of 587. More bullish, see it significantly higher at the $1,000 mark. Now, at the current price, I'm paying around 21 times Ford earnings. That's based on $17.50 estimate. Next year's 2340. Well, the forward P it drops around the 16 level. Compare that, in fact, with AMD around 26. Now, the growth screen is showing us forward revenue around 39% and forward free cash flow that's sitting around 38. The part I'm watching is how much cash reaches shelters after the investment. But look, the balance sheet, it gives room to keep investing. The net debt ratios both are zero. It's helpful for a business that has to commit money to factories ahead of demand. I'll still make the cash flow model do the work. And profit forecast for TSM, they're big as well. We can see here the chart showing us $62 billion in 2025 and estimates around 120 billion by 2027. It's also great to see the forward P is come below the 5year average. The yield though that's still sitting below the average for my money. The earnings and cash flow outlook, they're the reasons to look here. Now, here's where I'd slow down. I'm starting this model at 47 billion for 2026. Just look at what it was last year, 32 billion. So analysts, they do have some big big expectations. That's already close to a 50% increase in just one year. The year prior, that's at around 20%. Now the model, it comes to $490, 31% upside with a margin of safety of 24%. Now, if we're to lower it to 15% growth, well, we can see $358 is a little bit below today's price. We're at 25, we get 675. So quite a wide range. Reverse DCF, that's coming in at 15.7% after 2026. Large jump. And the earnings table, it also shows some of that same uncertainty. For next year, you've got a low of 2145 with a high of 25.87. Either way, I'd rather ask what entry price gives me if the growth ends up slowing. Now, TSM's next data point is his October sales release on Tuesday. I'd watch that for a check on revenue growth, then look to the next quarterly cash flow numbers for evidence on whether the new capacity is paying off. I'd watch TSM here and be more interested under 340. It gives me room below the 358 lower case with the lower case already assuming a cash flow jump. I'm happy to leave a little bit of room. Now, this is also one of the businesses I'd be most comfortable following for years. You can see the sustained returns here. The question for today's ranking is whether the price gives me as much room as the others we've covered. Now, let's put the six together. A lot of these shares fell hard over the last month. I'm ranking them by where I put fresh money at today's price with a separate level I'd use to start accumulating aggressively. Sick for me is AMD. A great quarter, but I'm paying a lot of execution at around $450. Even the lower DCF case, it assumes that big early ramp. I'd be interested again under 420. Fifth is Micron. The lowest earnings multiple and the biggest headline DCF upside. They come with the most uncertainty around what cash flow looks like through a full memory cycle. My level is under 575. Lamb research that comes in fourth. I like the business and the equipment exposure, but the DCF asks for cash flow to more than double this fiscal year. If I want protection against a slower ramp, I'd wait for under 170. In third place is TSM. You're getting a lower earnings multiple than AMD and a manufacturing business with very strong margins. I take another look under 340 where I'd have a cushion even below the lower cash flow case. In second place is Nvidia at 178. I'm closer to my entry than I am with TSM. I'd want it under 175 before adding fresh money given the board review and the earnings update still ahead. But as we can see in the pre-market, it looks like it is pretty much around there. So Nvidia comes as one of the strong buys today. Then in first place, we've got Broadcom under 300. This is where I'd start. I like that the case comes from Custom Accelerators Networking and Software, and there's room between my price and the lower case in the model. I'm paying around 15 times next year's earning estimate for Broadcom. That's a price where I can consider a starter. I still check that the free cash flow is keeping up with the earnings. For Broadcom, the checkpoint is around $16 billion of fourth quarter free cash flow to reach my starting number. If that misses materially, I'd rebuild the model before putting more weight on the 368 lower case. Now, here's what could flip the top two. If Nvidia moves comfortably below 175 and the next update supports the cash flow path I've modeled, I'd be happy to move up. There is still a very attractive business here. For that Nvidia decision, I'm watching two dates together. earnings on the 17th and the briefing requested for the 18th. I'd use whatever the company actually discloses to decide whether I need to change my assumptions across the group. The big test is whether cash flow can grow at the rates the valuations need as customer spending growth calls. The capex forecast still is spending rising. The stock can respond very differently to the slowdown. So, if we look back to the morning session, there are a few different decisions hiding in it. Broadcom's my first look at these prices. Nvidia is the one I'd watch most closely for a better entry, but it looks like it could hit that today. Let me know which of the six you'd put first and the actual price you'd pay. If it's Procom 2, I'd love to know what you think is a fair cash flow number for next year. And if you enjoy today's episode, smash the like button, hit the subscribe and bell so you're aware of future releases. Don't forget to click on the ping comment below where you can sign up and read these weekly articles where we cover severely undervalued stocks as well as what's going on the market. And more importantly, have a great day.
Comentários 0
Entre para participar da discussão.
EntrarAinda não há comentários. Seja o primeiro a compartilhar sua opinião!