The new trader here could certainly position themselves on the long side if they were feeling bullish with a good risk versus reward opportunity.
Contexte
Kevin Horner on Amazon: "The new trader here could certainly position themselves on the long side if they were feeling bullish with a good risk versus reward opportunity."
Contexte
Joe Teague on Vertiv: "one company that's going to win, no matter which language model is the best... Vertiv is there regardless of who the winners are"
Transcription Complète
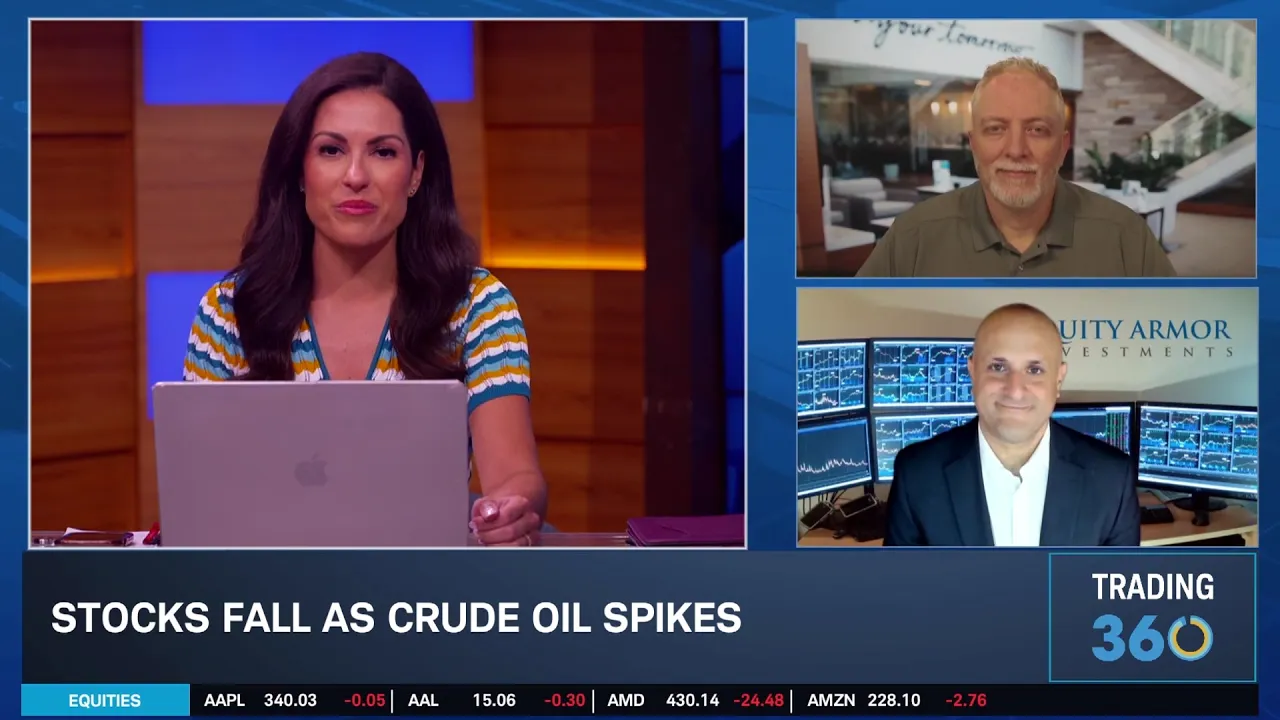
Invest your way with Schwab. Welcome back to trading 360. I'm Marley Kayden. It's time for the big three. We've got three stocks for you and three charts today. Kevin Horner taking us through the technicals here to take us through his picks today. Joe Teague portfolio manager of the Rational Equity Armor Fund. Great to have you both on Joe. Let's kick it off with you. I mean what a day we have ahead of us here. We are starting it off with a down day here. We've got oil higher. We've got the ten year ticking higher as well. But we are waiting on the FOMC and then hearing from a few familiar names after the market closes. Yeah. Thanks for having me. Happy Father's Day. It is, it is going to be an interesting day. A lot to watch here. Just as a participant. You know, there's the geopolitical stuff going on too in the backdrop. So, it's a, it's a, it's a action filled day. And, it's important to just keep our eye on the prize. Just looking at the big picture. Maybe there's some pressures right now. But will this persist long term? I guess that's, to be seen, but I'm more optimistic about the longer term picture than maybe the market is right at this very second. All right, so then let's dive into your big three here because your first name, we've already heard from it's alphabet. They had great numbers. They had good guidance. We still saw a negative reaction to that CapEx number for alphabet trading slightly higher now. But you know momentum not on the side of this name. It's made their year to date gains less than 7% with the move to the downside that we saw post earnings. How are you looking at alphabet right now Joe. Yeah. Bigger picture. I'm looking at the biggest companies in the world really looking focusing in on the mag seven here. I think the market's spent a lot of time this year focusing in how much money these companies are spending. Obviously that's going to be really important picture after the close today when we see these companies report what their capital expenditures are on. But I think once we start to turn the page, a much healthier conversation is going to be, how much are these companies earning on this spend? And for a company like alphabet, I think that's a the best case story for the return on investment they're getting. They're showing they're turning these investments into real earnings, real bottom line on their shares. So that's what's important to me. That's what I love to see about them. They're spending a lot of money. They make a lot of money. I think the market got a little spooked out that the fact that they're cash flow negative, but it's phenomenal for to me to think that this company can spend close to 200 billion with a B annually and be close to cash flow positive. It's really phenomenal. So yeah, they have way more. They have so many things going for them. They got, you know, the genetic engineering, just way beyond LMS, which all of this, AI people are talking about the LMS, you know, maybe this is really what AI is all about. Maybe there's other stories behind there. I think no matter what the case is, alphabet is going to be there, driving us towards a better future. Yeah. And I had a guest on the day after they reported that said, how dare they spend money to create AI. That 90% of the S&P 500 uses. So it's a very interesting argument to be made that they're spending too much when they've proven exactly how many people are in their ecosystem or how many companies that is. But, Kevin, as we look at alphabet here, an interesting chart because of the volatility we've seen in this name. What are you seeing in the technical setup. Well good morning Marley. You know that one year chart is pretty interesting to me particularly for the reaction post earnings. Like you mentioned it wasn't ideal. You don't like to get relatively good news that's digested negatively. However if you were prepared for opportunity and staring at that 200 day moving average, you may have been afforded that opportunity in the last week here. The test of the 200 days, the first time we've seen this since June of last year. So you're looking at about a 13 month long range uptrend here. And the daily chart just shows what many traders would consider a standardized pullback below the 200 day for two sessions right back above it. The last three and building a little bit of, potential short term momentum. Now, it's true that we've got this down trending channel. And if we're talking about looking for the next trend opportunity, we do need to get back above 360 and the 50 day moving average. But if you're just digesting what's happened since the peak here in late May, mid to late May, then you'd call this probably a standardized pullback to an area of long range support. And Kevin, as we look at the the longer term chart and we look out at the weekly, is that trend still intact that you're seeing this trend to the upside. What are you seeing there as we zoom out here. Since Joe is saying this is more of a of a longer term play here? Yeah, I tend to agree with Joe's assertion here. Actually, the the visual on the weekly is really interesting to me. You've got what now visually looks like a long range bull flag right into the line of best fit. So what we're looking at is the linear regression channel here. And we're sitting right on that midpoint. So that coincident with the 50 week moving average around 312 is pretty intriguing in terms of management for support. Of course this chart changes quite a bit. If we're under that 50 week moving average, we can see the MacD validating this pullback. But it would look a little bit more negative if we got under that 3123 ten zone. So that bears watching. But we often say Marley you know technicals don't tell us what's going to happen. Just how to possibly position ourselves moving forward. And that's why that short term level at around 310 to 312 is very important for the bullish trader in this instance. All right. And right now we are about $20 above that for alphabet. We're at 3.3428 right now. Your next pick very top of mind though as we come into tomorrow Joe. You've got Amazon here in the big three as your second pick. Take me through your thoughts on Amazon. Yeah I think a very strong cloud business. Obviously AWS it's the backbone of AI enterprise AI and Amazon doesn't need to build every model, doesn't need to be inventing all these new things, but it gets paid every time people start to deploy them. So they are right in the center of this too. I'm really excited about the potential robotics they're going to be deploying out to. So yeah, I think this is a, obviously a great company, something that I'll be watching again for the long term. Again, a big company that is spending the money, securing its moat, it's going to be here for a long term. And I'm very happy to sit and wait while it matures. And Kevin, you importantly highlighted in the last chart that the technicals can't tell us the future, but they can tell us perhaps where you might want to position yourself. So as you look at the charts on Amazon, what are you seeing in terms of the technicals and how people are positioning themselves in advance of this earnings report? Well we're sitting on a very important level, Charlie. That's what the daily chart tells us here. You know we've been below the 50 day moving average since early June here. And that has now been resistant. So we've got a crossover of a 20 day below the 50 day. We know that trend is not strong. But look at that horizontal. 227, which is basically the level that we've had in here from the lows back in late June. And that's an important ledge now, having made matching lows, basically the low today lines up right with that. And so the new trader here could certainly position themselves on the long side if they were feeling bullish with a good risk versus reward opportunity. Even though the trend is not aggressive one way or the other. Now we're sitting on support. So under 227 yeah, this looks a bit more ugly or bearish potentially under that. 227 but like I said, this gives traders a way to, maybe manage their long side and look for opportunity. Even if we stay in a relatively weak view here, any bounce that takes you into short term resistance, the first area could be the the high of the last week or so, which is up there around 238. 239 the high since we gapped lower on July 23rd. So there's still a proper risk versus reward even for the short term trader, according to the daily chart at least. And if we zoom out to the weeklies, what are you seeing Kevin? A lot of similar stuff. So we talked about this in alphabet, how we were looking at that, linear regression line. Except in this instance, the linear regression line, the line of best fit was up around 252. And what you'll notice is that for the last 6 to 7 weeks, we've been below that, which calls out the lower level of the linear regression, right? That low around 210 now, which looks like something we have previously maintained in our long range trend. And unfortunately, that means that as as we look at this, if this is digested negatively going forward over the remaining days, this week 210 could absolutely come into play in the near run. And that would be an area that traders would hope to be supportive in nature on the longer range chart here. All right. So we're just about almost $20 above that right now for Amazon. 22796 we are down a percent and a quarter though on the session so far. We'll of course get those earnings after the market closes tomorrow. But your last pick here Joe, I'm very excited to hear your thoughts on because every week coming into the week, I ask Alex Coffey what he thinks the potential dark horse or surprise mover is going to be, or one company that's less talked about that he has his eye on. And his pick for this week was Vertiv. Now you've brought it to the big three. So tell me your thoughts on Vertiv. Yeah, well, I always knew Alex was a very smart trader. Absolutely. You know, people are talking right now, this Kimmy K three thing open AI is never going to be able to fulfill all these commitments. AI is not going to make any money. But we're seeing a quarter after quarter. We're seeing all these hyperscalers spending the money, and they are putting those that money to work. They're opening up data centers. And maybe open AI might not be a profitable company, but these these data centers will be opened whether they are or not. And all of these data centers are going to need, they're going to need this infrastructure surrounding it to do it. They're going to need to be cooled. They're going to need to be managed. They're need to have power distribution. They need to have backup systems. Vertiv is right at the center of that. So for me, yes, there is all this concern that people are talking about these default swaps on, on all of these, big hyperscaler companies, the chip makers of the world, maybe they're never not going to sell as many chips as we thought in 2030, but we're seeing these data centers coming online regardless. So whether or not some of these, AI, startups make it or not, the, the fact of the matter is that we're going to need more computing. We're going to need more data centers one way or another, and one company that's going to win, no matter which language model is the best, no matter which of the AI models winds up winning. At the end of the day, we're going to need this type of infrastructure. Vertiv is there regardless of who the winners are and the other and the other markets. All right, Kevin, and this is going to be an interesting chart for us, especially with today's move, because Vertiv is down about 13.5% beat on earnings, raised its guidance across the board, had a slight miss on revenue, had some minor timing shifts, it said, in some congestion in its supply chain, but seeing a pretty significant move to the downside today, despite seeing nice moves to the upside through this year. So walk us through the daily chart first. Yeah, this is an important level, Marley for a couple of reasons. We can go back to February, mid February, like right around the 1011 when they reported. And we had this wonderful gap up. And that's essentially the level to which we have fallen here, was that long range gap level here. So if we go back and view these levels of gap zone, so to speak, they offer us excellent support along the way. They tell us that where we've had shifts in the mentality of the trader. And so that's what we're watching at this ledge right around 232. And so under 232, we fall into that gap zone, and that puts us at risk to fall to the top of the former resistance prior gap. And that comes in around 200 to 210. Yes. We're below the 200 day. And that's a notable development. But that doesn't mean we have to fall definitively here. So we're watching to see can we hold 232 today? Can we get back above the 200 day at 246 or so quickly? And if we do, then we could say that we've got at least a layer that we can validate for real strong support, because we've held that for five and a half, six months, almost as support. So, very important level, definitely some risk if we get additional broad market weakness here, certainly could slip to that $200 area, but this is a spot that's fairly important for Vertiv. Yes. I mean, certainly important. And I mean, just looking at the move today that they're seeing, if they hold on to this loss of about 14%, it'll be its worst daily percentage decline since January of 2025. But as we zoom out and look at the weekly chart here on Vertiv, I think it's going to show a bit more of Joe's thesis. I mean, they've had just a meteoric move to the upside here. As you look at the numbers, what are you seeing in the weeklies. Yeah, a lot similar. You know we basically now when we talk about the beautiful nature of an uptrend, what you're looking at is sitting on the 50 week moving average. We've been above that since April of last year. So basically providing longer range support. Now this is the first test as well since April of last year. So it is notable that we're visiting the 50 day moving average here, which comes in at 230. That's a 50 week moving average. Pardon me. That's an important level again, that if we fell through, we're not going to feel great. But right below us is an area that was prior resistance that led to that big gap higher. So that's where that 199 $200 level can come into play again. But what we're looking for. Can we validate support at this 50 week? We basically need to see the remainder of this week holding up. We can get below it. You know, we can always trade below these moving averages on an intra week basis. What we want to see is can we maintain it at the close of the week? So look for above 230 on the close for Vertiv. This week specifically, we are barely hanging on above 230 right now. We're at 23168 with a 14% move to the downside. Really appreciate you both. Joining us today for big

Commentaires 0
Connectez-vous pour rejoindre la discussion.
Se connecterAucun commentaire pour l'instant. Soyez le premier à partager votre avis !