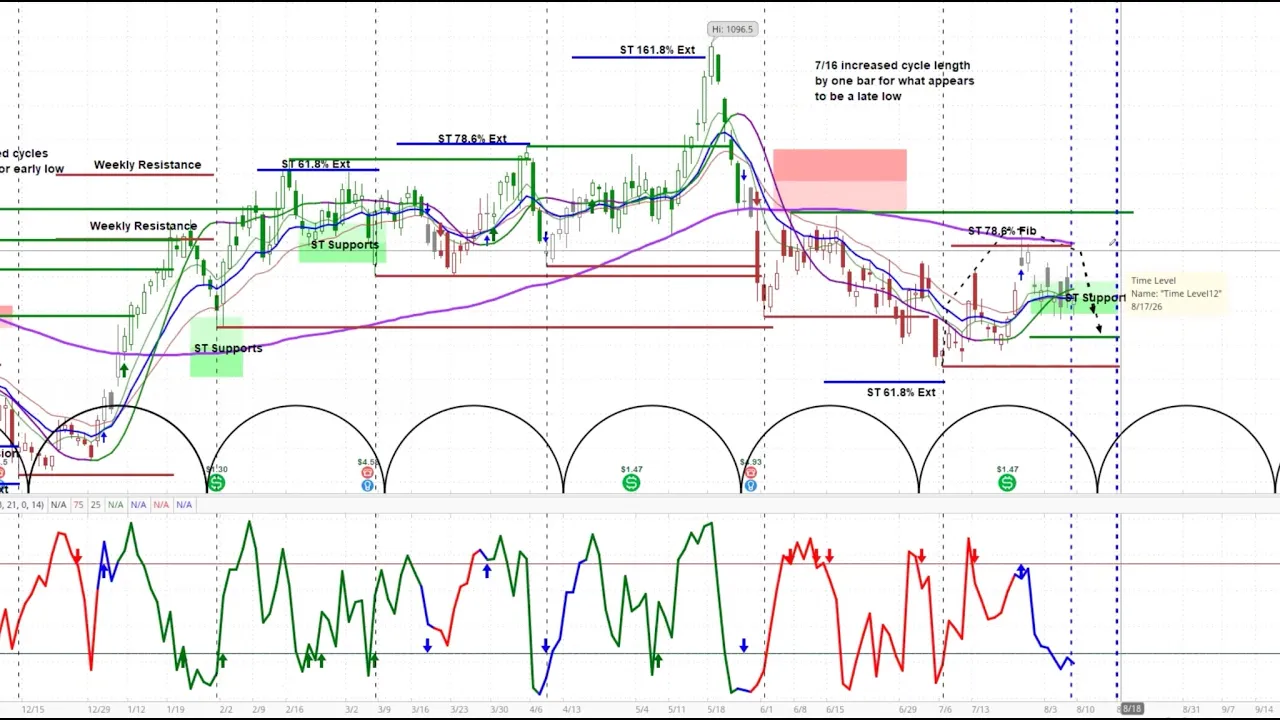
Costco (COST) Weekly & Daily Cycle Analysis & Projections

- Rendement de la vidéo
- —
- Appels
- 1
- Achat / Vente
- 1 0
- Publié
Recommandations
L'entrée est le cours de clôture de l'actif à la date de publication. Le cours actuel est la dernière clôture enregistrée.
-
Entrée $947,82 08 août 2026Actuel $947,82 07 août 2026Résultat +$0,00
So, this one could set up a good buying opportunity coming forward.
Transcription Complète
Okay, here is Costco and as you can see we are just one week into this weekly cycle timing window which is this period between these blue vertical dotted lines and it looks like we formed an early low but there is still a little bit of time to go. This is not conclusive yet. We do have the reversal scout turning up, however. So, I would like to see a little bit more strength in here, but I believe that this is likely the early intermediate low that has formed just a couple of weeks ago here. If we switch over to the daily chart, you can see that this cycle is just ending. It's right inside this daily cycle timing window and holding supports right here at the bottom of the support zone has about a week to go. So uh would expect this to form a basing cycle which is a positively configured cycle that forms after one or more negatively configured ones. Just referring to whether the cycle ends higher or lower than where it began. So, this one looks like it will end higher than where it began and then make another upside move and that would confirm that trough was the synced short-term and intermediate term trough on July 10th back there. So, this one could set up a good buying opportunity coming forward.
Commentaires 0
Connectez-vous pour rejoindre la discussion.
Se connecterAucun commentaire pour l'instant. Soyez le premier à partager votre avis !