We sold Qualcomm uh because uh from a dividend perspective is in their dividend growth portfolio and we like financials a little bit more. So we we did a one for one switch from out of out of Qualcomm and into truest.
Contexte
“We sold Qualcomm … and we did a one for one switch from out of Qualcomm and into Truist.”
We sold Qualcomm uh because uh from a dividend perspective is in their dividend growth portfolio and we like financials a little bit more. So we we did a one for one switch from out of out of Qualcomm and into truest.
Contexte
“We sold Qualcomm … and we did a one for one switch from out of Qualcomm and into Truist.”
I'm quoting from some of the notes that are out there today that are reiterating the stock at an overweight.
Contexte
“they're reiterating the stock at an overweight.”
Transcription Complète
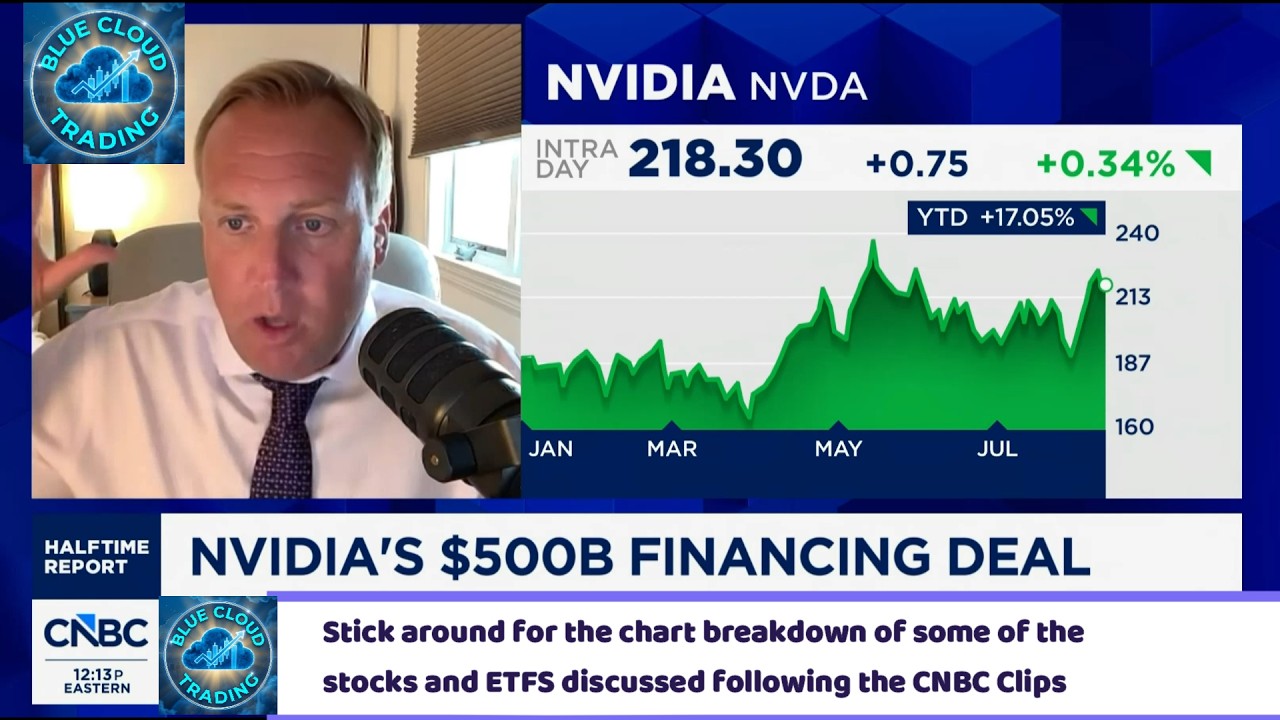
Blue cloud trading [singing] through the night. >> Welcome back to the channel everyone. [music] In just a second, I'm going to play a few CNBC clips from today's episode of the halftime report. I'm going to pull up the charts and dive into the technicals of some of the mentioned stocks. We're going to look at the key support, resistance levels, momentum, and see if the price action actually backs up what the talking heads are saying. Hit that like button. Subscribe if you haven't already and let's roll the tape on the first clip. >> Carl, thank you. Welcome to the halftime report. I'm Scott Wner. Front and center this hour, the state of the markets as investors wait on tomorrow's CPI print. We discuss, we debate with the investment committee. Bullishness seemingly abounds on the street. Joining me for the hour, Joe Teranova, Brian Bellski, Rob Sichin, and Josh Brown. Take you to the markets and show you exactly what we're doing as we come on the air. This looks like a wait andsee tape to me. You're not really doing a whole lot. Yields are a little lower. Oil's off the highs. The story though to me is the bullishness on the street. Targets go up. Earnings estimates keep going up. Want you to listen to Goldman's global head of hedge fund coverage Tony Pascarelloo with me on closing bell on why he's so positive and why so many are. >> I think the foundation of the market is solid. Why do I say that? I think the economy has proven again to be very durable running around trend. Earnings growth has been superb. I think the flow of funds is still very favorable particularly in the month of August. And then we have a trillion dollars of AI capex working its way through the system. Those are just a few Josh of many reasons why as I said bullishness abounds, targets go up, optimism continues to rise. >> Yeah, that's right. And I think part of the optimism is just this a function of um how far through earning season we now are. We've basically heard from almost all of the most important growth uh earnings growth stories and then we're just getting such a panoramic uh uh virtuous cycle. It's everywhere you look is we beat we're raising we're raising the lower end of the forecast etc etc. So, um, we're through 80% of the S&P 500 by market cap. Like, we we've got almost I know Nvidia is still out there, but if you take the actual and then you blend that with what we're still expecting, so these are still estimates. Even if you pull tech out, you're looking at 28.3% earnings growth. Um, if you add tech back, it's 32%. It's outrageous. the net income margin uh has been revised up during the course of this season to 15 uh.6% from 15. So margin is ahead of expectation. Then you look at sales growth and that's better. Uh 15.2% that's 300 plus basis points above what was expected uh as recently as 2 months ago. 10 out of 11 sectors were getting profit growth. So a lot of the narratives about it's all all AI or it's so narrow, it's concentrated, throw them all in the garbage. They're money losing narratives. The reality is corporate America, the current management of companies in every sector. Look at what they've had thrown at them over the last five or so years. Whether we're talking about record inflation spike or we're talking about the pandemic itself and all the difficulty in hiring people and then the tariff stuff. These are like absolute warriors, the people running these companies and they just continue to find more and more and more earnings growth, more margin, more upside to estimates. And in that environment is 20 times earnings cheap? No. But why would it be less? Why would the multiple on this particular crop of companies be 16 times earnings because it was in 1994? It makes no sense. These companies are it's the Michael Jordan of every sector. So, um I think that's what people are reacting to and um there are great stories everywhere I look. >> So, Joe, you know, again highlighting the the important words from Tony, economy durable, earnings growth superb, flow of funds favorable, trillion dollars of capex. Mhm. Fifth point, not on that list, and I agree with the first four points. Resiliency. We've really stress tested this market, this bull market this year, haven't we? Rising. >> We did talk about that, too, by the way. You know, the the deleveraging too, the cleaner, the cleaner positioning, right? All of it in total is, you know, frankly why, you know, elevated oil prices or yields that are still a bit elevated aren't enough to derail the market because the other stories are just too good. So I think the question becomes, what becomes your indicator to alert you that potentially there might be trouble ahead. I continue to watch the S&P equal weight. I think that's a very important indicator. I'm also watching the dollar, but more most importantly, the equal weight and the equal weight is hanging in there. Scott, we're seeing Didn't we hit a didn't we hit a new high on the equal weight on Friday? >> We we did and it's carrying forward today. Even with oil prices moving higher. So I think that's validating everything that Tony has said and Josh has said and everything that we've been emphasizing over the last several days. You have to maintain your position which is a bullish one until you are greeted with some form of an indicator to suggest otherwise. >> Doesn't look like that is around the corner. I mean, who knows what's around the corner, Bellski, but Scott Rubner of Citadel sums it up, I think, as well as anybody else. And very simply, companies are not simply beating elevated expectations. They're driving the steepest earnings revision path since at least 2000. That's true. There's a six thing going on. It's called the Yeah, but bull. Every people are still doubting this after all of this. There's still amount of skepticism. Every time the market goes up, you have an amount of people trying to guess on when the next correction is. How about let's let's sit back and really enjoy what's happening. The revision story has been amazing. As someone that's been looking at revisions for a long long time, if you take a look at FY2 versus FY1 numbers and how they continue to go up and just the second quarter earnings, Scott, and how they how they just blew away expectations and numbers continue to go up from here because companies are efficient in their earnings growth, in how they're valued, how they're operating the business in terms of return on equity, return on capital, and the debt to equity is down dramatically across most sectors. So, that's why I think this is going to continue. And the Yeah, but bulls uh are Yeah, but the market >> Yeah, but earnings are earnings are a bubble. Yeah, but >> we're an AI bubble. Uh the Fed's going to misstep. You know, the but yields are spiking today, so let's sell. I mean, that's not investing. >> What about you, Robbie? How do you how do you feel about this this market? You I I I'm guessing that you probably agree uh with what many of the bulls are saying. I mean, sentiment indicators are are so off the charts at this point. Is there any concern in your mind about that? the fact that when I do go down the list, it's bullish, bullish, bullish bullish. >> Well, that's a that's a reason when everybody gets on the same side of the boat, you're vulnerable to a surprise. But I don't think that's going to happen to be candid with you. We're strong. Earnings are strong. They're broadening. They're not stretched. Let me put some numbers to this. 15% in the second quarter is the fastest revenue growth since 21. Fastest since 21. 88% beat rate record. PE is down. And here's the thing that that that I think the yeah butts need to hear. Institutional positioning is in the 37th percentile. It is not stretched, not even a bit, which is going to draw people in. Now, retail positioning, if you look at some of the Goldman, I think it is a little stretched. Retail investors feel a little more in than institutional investors. But we're all hanging on the number of stories that we talked about, some of which should cause us worries. But markets tend to climb these walls of worry with the slow removal of negatives. And I think that's going to be what draws institutional positioning back in and maybe pushes us towards 8,000 absent a bolt like a hot inflation. >> Well, I mean, that's that's where many of the targets are now beginning again, 8,000 and and above. And we do get the CPI tomorrow morning. And there's obviously a lot riding on it. A, you know, a cooler read sort of takes the Fed off the off the hook and sort of validates the let's wait and see ideas. A hot number puts the pressure on. Like you talked about in the last news conference, the chair did. Uh we have no tolerance for inflation being above target, but they didn't do anything about it at that meeting. So if you get a hot read tomorrow, are they under more pressure to do something about it in September, you still got to get through Jackson Hole, too. But the market, this just feels to me like a wait andsee market for this number. It did yesterday, it does a bit today, and then we get the uh we get the prize in the morning. >> I I I think you're you're spot on. But let's let's play the other side of this for a second. Let's say inflation comes out and it's much hotter than anticipated and you have to begin to price in that there will be a rate hike. Let's play the bearish argument for >> we're 50/50 right now by the way I think. >> So let's say let's say that jumps let's say it goes 75 80% towards a rate hike. Let's play the bearish argument for one second. Let's say they are right. We are all missing something. What do you think the return on that bearishness ultimately is going to be? 5% 10% to the downside and you're telling me I'm going to be fast enough to know when everyone's going to rush in and buy the dip. See the return you mean if they do hike or if or if expectations Let's say they hike. You get your reasoning if you're being funnier than that. >> You get the and let's say the market goes down. Okay, play that along for a second. >> It just depends. There are some on the Fed, by the way, voting members like Hammock who say one hike is not enough. >> Okay, so let's say now we're into the process of multiple hikes. What I'm trying to point out is I actually think your return on being bearish is not that strong. I think you're looking at maybe 5 to 10% down and then you have to be fast enough to get back in because the dip buyers will return once again. To be bearish here, you have to believe the setup looks something like it did in prior instances where the market goes down greater than 20% and stays there. And I don't see any fundamental evidence for that. Even in fact, understanding that the Fed might start hiking rates. It's not like you have to worry about the uh AI story running out of gas any anytime soon, Josh. Right. I mean, didn't we get more evidence of that yesterday afternoon in that extraordinary event on this network with Jensen Wong and then the the the heads of those six firms that are going to partner with Nvidia to raise $500 billion in third party capital. Just to get you up to speed everybody on what exactly this is about. Take a look at at what we put together just so you clearly understand what this is. So they're going to partner with financial firms to raise $500 billion in third party capital. They've signed with Goldman Apollo Blackstone Brookfield KKR and Black Rockck. The deal is going to help Nvidia's customers finance the cost of compute. the financial terms not disclosed, but the street seems to be more positive than not on it. Uh on the idea of what what is both revenue sharing uh alleviating circularity concerns, I'm quoting from some of the notes that are out there today that are reiterating the stock at an overweight. Uh it it seems as though that this has taken a little bit of the risk out of the equation. However you judge it, you have the stock. What do you think? >> Well, uh I think Jen, so of all the people in this world that you could choose to contra and bet against, you want to bet against Jensen Wang. Okay. I I don't you definitely are are are welcome to because he looks at his stock price. It goes nowhere for a year, right? Um he's got the best performing stock of the prior decade. Why isn't the stock going up? Why are we multiple contracting? Well, sir, there's talk on the other coast in in New York and Boston. They're worried about circular financing. They think you're Cisco um basically giving money to all the competitive local exchange carriers in 1999 to buy Cisco routers with your money and then you get to book it as revenue and they think that you're running the same playbook. He says, "Oh, okay. But we also know the world is structurally short compute and probably will be for at least the next 5 years. What if we can socialize that risk and that upside a little bit and bring in third party people who just want to bet on the compute demand itself having a value? Can we do that? And of course um we know that there's trillions of dollars in dry powder between um private credit, private equity. There's a whole wealth management uh world of which I'm the avatar. Everybody's looking for new products to bring their clients that have a yield attached to them. Let's let's uh build a bridge between what Wall Street is looking for, which is more stuff to invest in with a yield that we feel good about, and with what Silicon Valley needs, which is um spreading out the risk a little bit and not having to have Amazon and Google do a debt offering every month. This is like the best of both worlds. I don't know that it takes the circular risk talk off the table, but it should at least push it back further from the conversation. If we think that there's a lot of demand directly to invest in compute, well, it's a new it's a new story now. And that story is, wow, the ecosystem might have another 10 million new check writers all of a sudden. And I think it's brilliant. Um, I'm not saying I'll invest myself, but I think it's a brilliant move by Nvidia to engage the people that actually represent the investor class. >> And you you agree that that I takes a little bit of the risk >> 100%. They they cap off their balance sheet. >> They cap their own exposure at 25%. How does that not derisk the name? In addition, they've kind of said to the market, compute is now an investable infrastructure asset. it it's securing financing beyond your wildest imagination there especially with the partners that are in this group which you know many critics would say they're talking their own book right they need to they need to do this however I do think it sets the table for a broadened customer base too with customers that might have had some financial concerns as it relates to the financing of their AI buildout this a win I think it's a win-win for both I think for Nvidia you no longer have to question if they are going to have to cut pricing on GPU. That's that's no longer an issue. And for the consortium is a home run. They're getting the computers the collateral for the debt. Why wouldn't you want that? I think this accelerates what ultimately will happen which will be in the next 5 years one of the largest futures market in the world will be oil and it will be compute. you will price of commute of compute though if it commoditizes that's obviously one of the fears that that is out there the decreasing price of compute if you're buying an annuity stream I'm not saying that's happening Joe I'm just saying that that is a risk >> I disagree with you I actually think if you see a futures market and you have the transparency I think that creates an even better environment for everyone in particular the consortium themselves which will have the hedging ability against the compute that they are getting as collateral against the debt. I think it's ultimately a good thing. I agree with you just overall 30,000 ft. This is a win-win for all. >> Let's talk about Apple for a minute. Um the stock's red again and they're pushing back today on that downgrade uh that the stock got yesterday. I think it was underperformed. Um they say they're still planning to offer uh a glass- ccentric overhaul of the iPhone for the 20th anniversary of that device. Uh that's according to a published uh report. The price target did get cut though uh bellski 340 from 350 at loop they do reiterate buy. So this is a stock uh guys if you do me a favor and uh just back it up for a minute like a little bit a little bit longer. >> Yeah, >> just so you see the runup. Thank you. That you see the runup uh into earnings and then you know it it looks like it hit a near-term peak at least for now. I mean, look at July alone. And also too, remember this is a stock that's been underperforming for a while and all of a sudden it came back on again. And so I think this is clearly just a I think this is a dip action. I don't think there's any kind of fundamentally anything wrong with this. They're going to kill it in the fourth quarter in terms of their new products and it's one of our largest positions. So we think you can't bet against Apple. You just absolutely cannot. >> I think the bearishness builds once again. 56% of the analyst community have a buy rating on it that's very low relative to the other trillion dollar companies. 329 12-month price target. Now you have six actual sell ratings on Apple. That's the first time you've seen this since 2020. So I agree with you in the interim this is a sideways to lower trading action. But I think longer term uh the best positioning is to be long because I think it moves towards Josh's 400 target. I think it's certainly tough to be underweight. We reduced it on the show in late July because it became such an outsized position because of the relative performance and this is healthy fundamentals being offset by a really rich valuation. They're rerated a bit. I'm glad that we trimmed. However, we're still very long the uh stock. >> So, what about Alphabet? Hasn't traded well relative to the others lately. Bellski, what's up with that? It gets reiterated today at Goldman Sachs. The target's 435. Um, you know, there's concern over the brain drain reorg and Goldman's talking about that today, the commentary around it, the capital raising, debt and equity. Um, all are sort of overhangs. How do you view all that? No, we think that they're in the penalty box here a little bit near-term because of the reorg because of where they're spending money, but we still believe that with respect to how they're going to monetize AI is is a proven they they've proven that they can monetize uh what they run inside the company just like Microsoft. And so I think this pullback is a great opportunity for longerterm investors to continue to buy the stock. We think it's one of the five stocks in the US should absolutely positively own and it's a port portfolio of businesses. It's not just one business. They lead in cloud. They lead AI models, YouTube TV, Whimo. It It is a diversified business. So, the other story that we're following today is a report that Anthropic is trying to shore up confidence from the investor base ahead of their coming IPO whenever that may be. Uh perhaps as early as this fall. Kate Rooney is following that story, following the money as well for us and joins us from our bureau one market in San Francisco. Hi, >> Scott. So that does align in some parts from what I'm hearing from sources out here. Anthropics IPO according to sources could be as soon as October and I'm hearing that the company has been meeting with bankers as part of that entire process. But the Wall Street Journal with some new details about what's going down in those meetings. Anthropic has reportedly been offering assurances about its growth rate during all of that has been also fielding questions according to this report about the company's growth rate and revenue run rate amid some of the cheaper systems coming out of China. these open source models, journal reporting, investors have been pressing anthropic executives on all these topics in these preIPO meetings and then what it may mean as I mentioned for that revenue run rate that has been ramping at an unbelievable level. They last topped 47 billion. No comment from Anthropic, but they have publicly talked about the value of these more expensive models that they offer and then the cost per task essentially the value you get for spending more. So that has been their defense around this. the company has filed, we should say, confidentially to go public. We still have not seen those numbers, Scott, and the S1, which will flip closer to that listing date. >> Okay. Yep. Good stuff, Kate. Thank you very much for the update. That's Kate Rooney. Robbie, >> you you you want in on this when it goes public? >> Uh, you know, we tried to get some in the private markets. This is not one that we were able to participate in. I think I I will say that these companies have had so much demand. However, the price traction has been you get a big buy up and then they rerate. Meta did that. SpaceX did that. I think a lot of these companies that were waiting for investors to come in, they're large engineered IPOs with lockups that are unique and markets take a time to find price discovery. So, >> is that what is that what's happening with SpaceX? It's it's having to wait >> investors are waiting for this time to to pass to get this price discovery. It did get I think yesterday it was back above the 135 level the offering. It's back below it now. They did get reiterated overweight at Morgan Stanley. And you you own the name. >> We do own the name. Again, we own the name because we're locked up. We own it from the the the private side. So, we haven't bought any since the IPO. I think, you know, we're we're very happy with the business. I think what moves uh SpaceX up is Starlink growth, higher connectivity margins, and a disciplined capex commentary. I think if you don't get a disciplined capex commentary, I mean, everybody knows this company can build rockets. They want to make sure they're spending in a way that they can return some profitability back on that spend, get a good ROI. >> All right, so let's get some some moves uh before we take a break. >> It's from Brian Bellski's got a couple. >> Yeah. What? Let's go. Go ahead. Yeah. [laughter] >> Are you okay? >> I'm ready. >> What was that? Hey, >> he's in the starting blocks. >> All right. >> I'm torqued up. Let's go. >> Obviously. [laughter] Why don't you just take it away? >> Just tell me a change. >> Just I'm just going to be quiet now. Go ahead. Go ahead. >> What do you want to talk about first? >> Just go ahead. >> You made You choose. >> Qualcomm. >> You decided you were going to do your thing. Just go. >> We sold Qualcomm uh because uh from a dividend perspective is in their dividend growth portfolio and we like financials a little bit more. So we we did a one for one switch from out of out of Qualcomm and into truest. >> You like financials better than chips? >> Yes, we do. And we like the we like the dividend growth in truest in particular and the yield relative to Qualcomm. And I think too from from a technology perspective, there are a lot of great technology companies in the dividend growth and the DVY which is the dividend aristocrats, but we want to be more concentrated on financials with the higher yield and the better better dividend growth. [snorts] >> Fifth third. fifth third because we're we are up 40% of the position. >> Yeah, you like financials. >> Yeah, we want to tighten. We already we're already 32% financials uh in our value portfolio, Joe. So, I want to get a little bit bigger in certain names. So, we sold our fifth third, took a victory lap and added to a couple other names. >> Good good trade, but I think you you stay with fifth. Uh that's what we're doing. You're going to see the integration of Kameica in the second half of the year. I think that's going to be beneficial. Stock looks great. Financials, by the way, are going for the 11th consecutive week of gains. It's the longest, Josh, since 89 at least. We'll see whether we get I mean, it's early in the week, obviously, and we got to get through tomorrow with the CPI, but this group's been on a run. Uh, I can't think of an area in financials I don't like other than payments, which has got some weird PayPal related will there be consolidation or will there not. away from that. I like the credit cards. I like the regional banks, which we've talked about, uh, spread financials. I like the banking financials, anything that's even uh, tangential to Wall Street. I like the asset managers. I like the money center banks. Uh, I like the brokers we've been talking about. Um, Robin Hood. Uh, we we talked about Interactive Brokers on my list, the best stocks in the market. Um, we talked about uh, Citizens, which I'm long. uh CFG it's a it's a cornucopia judge of of stocks that uh either the profitability is increasing or the charts are running up or in many cases both insurance we talked about Bergkshire um JP Morgan made record highs recently Morgan Stanley looks amazing I mean this is like one of the hallmarks of the 2026 bull market is how well almost every financial that matters has been acting and how great the guidance looks. I mean, this is a big one of the most important legs to the stool. >> Yeah. Throw up some private equity names as well, guys, if you could, please, because they look great today. Uh, look at all these names, the area. >> Yeah. Um, and maybe some of it has to do uh with that news that that came out yesterday, but software is trading a lot better. That obviously helps this group, but there's a cycle through some of these names. One of the strongest areas of the market today. Apollo's up 6%, but there's your Blackstones and your KKRS as well. We'll take a break. Coming up, running for cover. One of Brian Bellski's retail plays [music] is getting smoked today. We'll find out what he's doing a little bit later. We have Josh Brown's best stocks in the market as well. >> Hey everybody, welcome to Blue Cloud Trading. I'm George. It is Tuesday, August 11th. It's 5:30 p.m. Eastern time as I'm recording this video. And we just saw some clips from today's episode of the Halime Report. Josh Brown and a few other guests. They went over a number of stocks. I'm going to analyze a good portion of those. Some of them may be in my portfolio. I'm not going to cover those. If you want to check out those, the analysis on those stocks, consider becoming a member. I'll talk about how you can become a member at the end of this video. But before we get into the stocks they just talked about, let's first take a look at the markets today. How they closed the Dow. It actually moved up slightly in the morning, but around 10:00 a.m. or so, it started to drop. You can see there it was down.34%. It wasn't a really big drop. Uh the NASDAQ also gapped up in the morning, but then spent the rest of the day dropping down6%. It was down the most. The S&P 500 also gapped up in the morning, but then dropped down.32. The only one of the indices that was up was the Russell 2000, which was up.34%. You can see the price there gapped up and then just kind of moved sideways. So, there really wasn't a whole lot of volume either in in today's trading. See that little blue bar right there? Um, that represents the volume and it was relatively low. So, why is that? Well, sometimes there's there aren't enough events that are taking place. Um, if if we look at the news up here, let's take a quick look at this. The US stocks ended mostly lower with small caps outperforming as oil climbed on straight of hormous tensions ahead of July CPI report. Let's see what it says here down here at the bottom. Um, by the way, Super Micro uh reported strong Q4 results with revenue near the low end of guidance but significantly higher gross margins and a robust backlog. Maybe we'll have to add that one too. Just we'll take a look at um Super Micro. Let me go ahead and add that right now to the list. We can do that right on here. What I'm going to do is plus There we go. SMCI. Boom. All right. So, we'll take a look at that one, too. Um, before we do that though, I just want to also show you guys um the heat map. How did the individual stocks within the S&P 500 performed today? Well, Google was down 3.8, Berkshire was down 2.46, Amazon was down 2.09, Apple was down 1%, Microsoft down45, Broadcom down one and a half. What stocks did well today? The energy stocks. they did really well today. Uh utility stocks did okay. As you can see, they're mostly in the green and healthc care that was mixed and the financial stocks did well. Industrials were also mixed. So, it's interesting how things are. Uh let's take a look at the groups. Actually, that's going to give us a little bit more insight on the one day performance. You see that utilities, energy, technology, those were the top three and then communication services, real estate, and consumer cyclical were the bottom three. with basic materials, healthcare, and energy up for the week. Okay, one week performance wise. So, all right, let's take a look at these stocks. I've got the strongest ones highlighted here with a blue flag. Okay, and uh we're going to start off with the first segments videos. Okay, so we're going to look at these stocks, these 17. I'm going to show some more clips from um the halftime report, and then I'll follow up with even more technical analysis right after that. So, let's start off with these first 17 stocks. CFG, which is Citizens Financial Group. Um, here it is on the weekly chart. Very strong uptrend. We're using the Ichimoku indicator and uh price is above both of these moving averages. Price is above the cloud. We also have the directional movement index giving us positive information. the green line which is the positive DI9 is above the negative DI9 and the ADX9 is moving up. That's all very bullish for the weekly chart. And if you look at the daily um price is still above the moving averages. The white line there is above the candle 26 periods ago. That's the chu span or current price projected 26 periods into the past. We basically you want that white line above the candle 26 periods ago and you want price above the cloud and these moving averages which is what's happening but I will say this uh price was financial is has been crisscrossing you can see the red line and the green line and the red line again what that means is there's consolidation taking place and so there's no um you know there's no expansion yet but we'll see if it can break above these highs here if it does then you'll see that expansion takes place. Uh it was up 43% today. RSP is another one that they brought up on the show. That's the Invesco S&P 500 equal weight ETF. Very strong uptrend. You can see that uh it's been stairstepping upwards, right? And that's the cool thing about this indicator. The moving averages which take the midpoint of the last for the green line it's the 9 period and the red line it's the midpoint of the last 26 periods. as that's moving up, you can actually see it stairstepping its way up and price remaining above those lines. Very important. Uh you look at the weekly chart, that's also looking very strong here. I like RSP. It was up just 21% today. Uh XLF is another one that got a blue flag. So these it was just four out of 17 stocks that got the blue flag, meaning they look technically sound and very bullish on both the weekly and the daily time frame. So XLF, let's look at this one here on the daily chart. Very strong. It is moving sideways, though. It was just 0% move today for the financials ETF. Here's the weekly chart. Holding up above these levels of uh resistance. And in fact, you know what? Let me get rid of the daily one there. There we go. Make it a little clearer. 5651 is a weekly level based on the candle back from January 9th of 2026. We cleared that 3 weeks ago and we've been moving up. So financials are still very strong. XLI is also looking pretty good here. Uh it was only up6% today. This is the weekly chart. Notice how price is above the moving averages in the cloud. And same thing here with the daily chart. Okay. Now the rest of these guys, there's something off. Actually the SMCI I haven't actually analyzed. So it might actually get a blue flag today based on uh we'll see super micro uh because the the earnings came out after hours. So the price has actually moved postmarket. So, what I'm going to do is press a button uh and that's going to reveal to us how much it's moved after their earnings. Okay. Is it August 11th here for the uh earnings announcement? So, let's take a look at that. Boom. It moved. All right. It's up 7.22%. It's still moving. And you can see that because it's currently uh right now it is um 5:37 p.m. So price is on the daily chart still under the cloud. And although it did well today, notice how it was up even further. It was it had moved up to this level. It was around 35. What was the high there? $3510. And now it's actually retracting a little bit since that level. Okay. So uh staying under the cloud. I wouldn't be adding this position here. It does look, you know, more positive obviously after the earnings announcement, but we don't have any buy signals according to this indicator. Here's the weekly chart. Still under the cloud as well. All right, let's look at Apple. Apple down 1.06%. Here's a weekly chart. It's still under the 9 period. Here's the daily chart under the two moving averages. So, yeah, right now it's not something I'd be adding position position in. APO Apollo Global Management looks really bullish here on the daily chart because you can see it price broke above this high and it's continued to move up. It's going to find some resistance though right about where it's at which is the high of 14173. Okay, that's where it's where it's um heading towards and uh I would not be adding positions here. You look at the weekly chart, the cloud is still bearish. That's when the senko span a the light colored blue line is under the purple line. All right. So yeah, there's resistance above. Let's look at a which is Aries management LP financial services sector asset management. It's under the cloud. I'd hold off on this one as well. All right, let's take a look at the next one. BX Blackstone Inc. under the cloud telling us that it's not the right time to be adding positions here. So you can see the the advantage of using an indicator like this because it's rulesbased. It's basically telling us, okay, there's still a decline here, right? Although price has been moving up recently, there is resistance above and there's a higher likelihood that it could potentially pull back and therefore you want to hold off until you get that um basically confirmation. All right, on the indicators the weekly is telling us to stay out. The daily chart on the other hand is very bullish. All right. And by the way, you can totally decide to trade whatever time frame you want to. This is just my personal preference to trade the based on the weekly and daily. I t I take into account both time frames. I'm looking for the most optimal trades. And those are the types of trades, by the way, and stock watch lists that I share with our members. Again, check out the last part of this video, how to become a member. All right, let's keep going. FITB fifth third bank core. It's in the financial services sector. It's a regional bank on the daily chart. It's above the moving averages. The Chico span which is the current price. Okay. Projected 26 periods ago. That's the white line. Again, it's not above the candle. It's inside of it. So, it's not quite there yet. It's almost there. Um, so overall, I kind of like this chart. It's it's kind of creating what's called a um uh a penant or I'm sorry a symmetrical triangle pattern right there. Do you see that? And so you want to wait for that breakout uh above that trend line for confirmation. Here's a weekly chart. Okay. So overall, I like it on the weekly. It's almost there on the daily. I'll just say that. Google on the other hand, not looking, you know, pretty today. Um this is what it looks like post market. Let's look at look. This is where it was at at the end of the day, down 3.84% under the cloud right now. On the daily chart, on the weekly chart, it's holding right above the 26th period. So, it's no on Google for right now. Um, the overall trend on the weekly obviously is very strong still. We have a series of higher highs and higher lows, but you know, would I be adding positions here? New position, the answer is no. Uh, at this time, Robin Hood inside the cloud, no on that one. That's the weekly chart. KKR is under the cloud. I would hold off on this one, too, folks. It's in the financial services sector. It did move up 6.92%. It has been moving from the lows down here, but it's still under that cloud. Here's the daily chart. You know, breaking above the 200. Again, you can certainly use that daily. You can also use a secondary time frame, maybe a 30 minute to help you with a more optimal entry. Um and so that's uh you know up to you folks. QCOM is another stock they they discussed today. It was um up just 31%. Here's a daily chart. Still under the 200, still under the cloud. The cloud itself is bearish. That's when the sync span A gets under the Syncpan B. Like color blue line is under the purple. No on that one. What about SpaceX? Well, it was down 3.93% today. All right, still under the cloud on the daily chart. There's not enough data here for the weekly, okay, for the cloud to form because it's so new the stock. Um, and so what I like to do is look at the 30 minute on this one. And we can see that, you know, since the this was the uh opening price down here around 136 or whatever that was. Let's see. Uh, hold on. The opening price was 150 when they first went public. Uh, it's down to, you know, it's down to $33.33. It has been moving up recently, but you can see on the 30 minute time frame, we had a negative crossover take place. And yes, the last, you know, four candles have been moving up though, but it's not something I'd be adding here. Uh, let's keep going. There's a couple more that I want to talk about. US dollar, UUP is the ETF for this one. It was flat today. 0% move inside the cloud. Nothing to do here as far as I'm concerned. and XLK. Now, this one's the technology spider ETF. It's uh we've got a bearish cloud here still. All right, but there are some positive things that have happened recently. We broke see this trend line here that was based on those two candles. That red line there that was broken here on that that specific day. If we go straight down, we'll see that there was high volume. The other thing you'll see is the green line had crossed above the red line which was bullish. The problem is there is no momentum. See how the white line is moving uh down. What that means is there's really no momentum and you can see it here reflected in the price. It's just moving sideways. So, we don't have really uh anything positive uh quite yet with this uh and the cloud is still bearish. But if you look at the weekly chart, you know, last week, the week ending Friday, August 7th, we broke back above that 9 period. So, I'm more optimistic than pessimistic with technology, but it still needs to prove itself, basically. Now, guys, in the next uh clip, we're going to show you guys some more clips from CNBC today from the halftime report, and then I'll follow up with more technical analysis after that. So, let's get back to the video. All right, on holdings, down more than 19%. That's the worst day ever. New 52- week low. Revenues missed. Not a great guide. You put that with Under Armour getting downgraded. Nikey's been a mess. Dick Sporting Goods hasn't traded well lately. What's going on with this? >> Well, their net sales are off big because the wholesale segment was very light, very light on the where they make their money and actually where their product is dramatically different than the other companies that you talked about was the apparel. Apparel is up 48%. Direct to consumer up 26%. That's where they need to really focus. I think the problem is on the wholesaling side. They've got an expensive shoe. Their average shoe is $150 to $180. And so I think that kind of puts them into a very direct segment, but we own it because of the great product that they have in terms of the apparel side of things. >> You own that you own on holdings for the apparel. Yeah, that's that's where you want if you that's that's where I think where they're really going to make the money in the margins and I think they have a better product than those other companies. We've owned the stock for six years. We bought it right before co you bought it for the apparel. >> I bought it well no I bought it originally for the shoes but we're holding it still for the apparel. >> Do I sound skeptical? >> Yeah. Have you had the apparel? Do you have any of the apparel? It's fantastic running stuff. They have really great They have really great stuff. >> I'm sure they do. But I mean aren't aren't the shoes the sneakers the bread and butter of the business? >> They are. But in terms of the margin, where they're going to get the margin and how this company's really going to grow in >> they're charging $150 to $180 for the sneakers and they're not getting the margin. >> No, they're not getting the margin out of that because they're not getting the sales there. Where the margin is is in their apparel. >> What do you think? You're snickering over there. >> I'm laughing at you. Your face is just making me laugh today. So, [laughter] >> is there a problem with this? Is there a problem with this area? area of of retail. Like I said, Under Armour, Nike, I said Dick Sporting Goods. Now, this >> Joe, hello. Anybody? >> No, I'm here. >> Anyone? >> Consumer discretionary is >> control room. Anybody? >> No. Consumer discretionary is incredibly difficult to kind of see long-term sustainable momentum trends. And I think apparel is really the highlight of that because of the fickle nature in the buying intentions of individuals. Let me finish my thought also. You have seen strength in off price and strength in off price is generally equating to a negative growth environment for apparel. Absolutely. Cuz now I'm going to off price and I am getting your products at a gigantic trade down. I actually think the upper part of the judge part of the economy. >> Off price off price has been remarkably strong. Okay. And if you're telling me that the trends in traffic and off price are strong, that means that apparel is being discounted for sure. >> That's why you always want to be with the better product. You only be with the better product and they have the best product in that category. Period. It's a way better product than than Under Armour. Way better product than than Nike. Nike's got other operational issues that are going to continue. It's too big. Under Armour is a failed company for the last year. Is there is there apparel competing with those companies or is it competing with Lulu, Viori, those companies? >> Well, Viori is not as athletic intensive as on obviously Viori is doing a little bit more [snorts] um casual wear and things like that. Viori is more along the lines relative to Aloe and Lulu. Lulu is going to a complete reboot as well, but I would say that from it's more of a Nike and Under Armour comparison in terms of the Aleta side of things. And yes, people have been trading down, but I think you always want to buy the best product and with the best company. And I think longer term, this is going to be a company that is going to do well. >> Josh, last point. >> You just don't have to be here. Like if you're if you're a manager and you have some sort of mandate where you have to own a certain amount of retail or apparel stocks. Okay, that's one thing. 99% of our viewers have no such mandate. Nobody's Every one of these charts looks worse than the last one that you showed. Um, in a market environment like this, why are we even spending 10 seconds? Let's focus on what's working. And unless you know something the market doesn't, all of these companies have challenges. And there are lots of companies that are firing on all cylinders away from this group. Let's come back to this group someday. Not this day. Okay. All right. this textbook breakout that Josh Brown has found in his best stocks in the market is which name? >> Uh, Expedia. So, this is one of the names that we've been talking about pretty much all year. It's been on the list of the best stocks in the market. We first talked about it almost a full year ago, September at 221. It's up about 47% since. We talked about it again on 1229, uh, which was 286. So, it's up about 13% from there. And the story is very simple. It's a narrative violation. People looked at the stock this spring and said, "Yeah, what the hell? Throw it in with the SAS apocalypse names." Um, but it's not SAS. It's travel. And travel is the very best slice of consumer spending. Q2 revenue grew 14% to 4.3 billion on 34 billion in gross bookings. They are breaking records everywhere you look. Um the B2B business is in its 20th consecutive quarter of double-digit growth. So management just came out uh raised fullear guidance uh uh across the board and they're going to return $900 million in the form of buybacks yearto date. Uh this is part of a $5 billion authorization. So they're a flow shrink or two. What we wrote yesterday is this is a textbook breakout with a low volume retest. I guess the retest ended yesterday because today it's off to the races. I think traders should use 290 as their pivot point. Below that level, it's no longer in a short-term uptrend. You can walk away from it. I think investors give it a little bit more space. We're looking at 260. That's that area where the 50-day sits. That is a rising 50-day. It's been meaningful in the past. It should be going forward above those levels. I think you want to be long the stock. >> Okay. Well, Bellski, you are. >> And Joe, you're no longer >> no longer. So what about from both of you? Go ahead. Go ahead. Brian, >> we we bought Expedia about a year ago in our small midcap portfolio and then we bought it in our value portfolio uh in March. Uh and it was cheaper than bookings. We love this travel space. We've owned Hilton and Marriott for a long time as well. We think travel's where people are spending their money. And so we think this stock is better actually fundamentally than booking. >> Name that you continue to own. I think it's breaking out for sure. In terms of sentiment, 45% of the analyst community has a buy rating on it. 324 right now, 329 is a 12-month price target. The end of July, we rebalanced. The earnings came out August 6th. Uh you could make a really strong argument that maybe extending the rebalance another couple of weeks into the S&P earning season would be beneficial because this is a classic example of Yes, in fact, it would be. But I mean, if you look at a three-month, can I get a three-month, guys please? >> You're you're incorporating the price action from the end of July through the last several weeks that you had a significant bump up. So, if you pull back where you were sitting at the end of July, you didn't have the intense momentum that you have right now. You know, >> but from the end of June, it looks like you had a momentum start to pick up again. You went from like around 210 to 250, let's just call it, cuz I don't know the exact numbers. based on the chart we're looking at obviously, but a couple more weeks would have made the difference cuz you would have gotten a bigger burst into August. So you you may have kept it. >> Yeah, you would have cuz can we pull that chart back to the beginning of the year? You'll see the high was in January. So you actually had a deceleration in momentum from January through uh July. There you go. See that deceleration? >> Sure. But that means that January But January February March >> if there's a deceleration, you would have bounced it at their April rebalance, wouldn't you have? >> No, cuz you you're also factoring a 12-month momentum score. I know it's it's difficult to keep pulling back these charts, but if you pull back the lens and look at a 12 month score. Here we go. See how that looks good? >> So, you're you're measuring different time frames. Okay? >> I'm sorry if it if it sounds complicated, but you're measuring different time frames. Bottom line is the stock looks great and factoring in what we just saw in the last let's call it eight trading days. It Josh is right. It's breaking out. I wish we'd still add it. >> Okay. Well, it's up another 3% today. We'll follow that. Mike Josh Brown final trade. >> Snowflake SN. >> Okay. Robbie >> KAC Kellski >> Gileia Gld Airbnb. >> Wow, you guys did that really well. All right, I'll see you at 3. >> Okay, so let's take a look at the last uh segment here. Airbnb, Expedia, Snowflake. Those are the three stocks that got a a blue flag from my analysis. Okay. Uh we're also going to take a look at a few of the indices here, the Dow, the Euro stocks, Russell, SPY, the Q's, um gold, silver, and the VIX. And we have a members request here. We're going to take a look at ARC, the ETF. So, let's take a look first at Airbnb. Why do I like it? Well, it's kind of obvious if you look at this chart. It's broken through some levels of resistance. I'm a breakout trader. That's what I'm looking for. I'm looking for a continuation to the upside. I'm looking for some confirmation that we're breaking through levels that were previously considered resistance, like this one right here and this one right here. That happened, okay, last week. All right. Now, it's continuing to move up. Not surprisingly. In fact, it's moved up uh from that level there. Last week it's moved up three and a half percent. It was only up 0.15% today. Here's a daily chart. So there you have it. This was the big breakout candle on Friday, August 7th. And here's Monday and Tuesday. So my expectation is going to continue to move up. Expedia, same thing. Looks good here on the daily chart. You can see it pulled back. It moved up to these levels of 333, came down, retested not once, but like almost almost three times, right? So you can see here where it got up to these levels here and then price came down testing here, here, and here. And now guess what? It's breaking to the upside again. It's expanding. It's up 2.25% today. Here's a weekly chart. All right, beautiful. Last week we broke above that 30380. Now we're seeing a continuation. Snowflake, same situation. Here's a weekly chart. This one actually broke above resistance levels back on July 31st. Friday, July 31st, and now it's continuing to to move up. Now, this one here on the daily chart, it was down 08%. But we can see very clearly prices above the moving averages, prices above the cloud on both the daily and the weekly. It gets a pass. The rest of these folks, there's something off technically. So, let's take a look at them individually. Look at Dick Sporting Goods. You can see it's in a decline here. All right. It tried moving up, hit that 26 period, and boom, it dropped. Right? That's what I'm talking about when it comes to resistance. Resistance. resistance levels need to be respected. Um there are other people, you know, watching those spots. They're basically a line in the sand. Think of it like that. And so until price breaks through, there's a higher likelihood, higher probability that it could potentially pull back when it reaches those levels. All right, here's a weekly chart. Still under the 26 period. Okay, what about GILD? Gilead or Gilead, not sure how you pronounce it. It's under the 26th period right now, the red line, and the cheapest band is under price. So, I'd hold off on that one. KAC on the weekly chart is under both moving averages. Okay, it was up 4.01. If you look at the daily chart, it moved up a little bit, but it's also still under the cloud. How about Lululemon? On the daily chart, we're inside the cloud. No on that. So, if price is inside the cloud, you don't want to be adding positions either. It's also under this declining 200. Here's a weekly chart. Bearish. Look how many weeks. These are individual weeks. Each one of these candles represents weeks. Think about it. Do you want to be adding here? Doesn't make any sense. And what price started to go down right around this point here, February 2nd of 2024. Imagine your position uh you're holding on to that since 2024. That's two years. And it's dropped 73.1%. Has it always been a bad stock? Of course not. There were times when price was above the cloud. Look at that nice run right there. Right from that point to that moved up 640% in about four years, but right now it's giving back a lot. And what about Nike? There's another one that's a perfect example of what happens when price is under the cloud. Nothing good. Just like you've heard that phrase, nothing h nothing positive happens when price is under the 200. There's the 200, that dotted yellow line. Okay. So, I would hold off on Nike. Obviously, it it does seem to be finding some support, I would say, at these levels here. Okay. So, if it breaks under those levels, that's what I'd be watching very closely. You can easily find out what those levels are by hovering over a candle. You look at the low. It's $40 around 40 bucks. O dropped 20.29% on holding. And uh so yeah, not looking pretty. Here's a very negative candle on the weekly chart. It was under the cloud this whole time. So, it told you, hey, you know what? Not a good idea to be adding positions here on this one. Look at the daily chart. This is what I'm talking about when it comes to using two time frames. And so, how you can sort of protect yourself to some extent. I mean, it's not going to be perfect, right? But there's a higher probability that you're going to have more success than failure when you're utilizing both time frames. Look here, the daily chart. We were under the 200 day. Okay, over here you might have felt, okay, price got above the cloud. I'm just going to trade this based on the daily chart chart. Okay, earnings come out, bam, down 20.29%. So, um, you know, it it just the whole thing I would stay out of uh for a little while. Obviously, it's going to take a little while for this thing to recover. UA, which is Under Arour, Inc. has also four weeks in a You can see the red candles here. One week after the next under the cloud right now. Um, today was down 8.63%. Here's a daily chart. Bam. Right under. Okay. Next segment here are the indices. Let's take a look at those. The Dow, which is the DIA ETF, if you want to be uh investing in the Dow Jones Industrial, down.3%, but it's above the cloud. It has a blue flag. Here it is on the daily chart. Here it is on the weekly. just now it just wasn't a bullish day today for it and it just moved sideways. FEZ the Euro stocks is still holding up above 7052 on the weekly. Here it is on the daily. There's a number of red candles but it's been slowly and systematically moving up. So you can see that right there, right? And so it it seems like it's opening up in the morning a little bit higher each day and then by the end of day drops. Um but the bears are not in control here for sure. The Russell 2000 also gets a blue flag because uh today was up.35% and it's although it's not above resistance of 30272 price is above the moving averages. It's above the cloud and the daily and on the weekly. But look at that resistance level. It's it's like it's a stickler for Russell. Uh the spy broke, okay, last week on Friday, we talked about that. Um on Friday, August 7th, we broke through that resistance level. Price was consolidating, moving sideways, broke above it. We're still above that 76040. That's the level to watch. 76040. We're at 770. Here's the daily chart. Okay. So, nothing to do. It's just, you know, sit on your hands and wait it out. uh it might take a little while for this thing to materialize and continue to the upside. Um but if you start seeing it break under that 76040, then expect it to pull back potentially down right back down to the cloud and retest that again. All right, let's take a look at the S&P 500, the SPY ETF. So it broke this long consolidation here on the daily chart. You can see that long box there. Broke above it last Tuesday, August 4th, and it's been moving sideways ever since. It hasn't really moved much, right? Uh, and here's the weekly chart. Okay, so nothing to do here except for the fact that it's looking bullish. It has a blue flag, but at this time I wouldn't be adding uh a new position. When I see a negative candle, I want to wait for that first bullish candle typically uh to decide to add because I don't want to buy into weakness. Uh I understand there are a lot of traders out there that believe in that philosophy of buying stocks as they go down lower and lower and lower. My whole p my whole idea is okay, I do want to buy those stocks that are cheap, but I want to first make sure that I I want to get that confirmation that they've actually, you know, sort of uh turned a page from their decline. Um, this one here is the spy. Obviously, it was just consolidating for a long time and it's moved up. Um, but I want to see a little bit more from from the spy. Here's GLD gold, which actually gapped up and then dropped back into the cloud, which is interesting. uh it was down.39%. And uh gold has recently been showing some strength because it broke through this box that we talked about. It also broke above this long trend line. It's a falling wedge pattern. If you guys aren't familiar with that, Google it falling wedge pattern uh for stocks and you'll see what I'm talking about. When it breaks above that level, it tends to continue to the upside. Now, we do have resistance at the 200 and that's around 411 94 or so. So that's something I would be watching very closely. Next one we're going to look at is the Q's the QQQ ETF which is still under the trend line hovering right above the cloud. Uh it does not have a blue flag and the reason is because the cloud itself is bearish. Again synchart and on the weekly chart uh it does look okay. There's nothing wrong here on the weekly but the daily is bearish. Okay. Silver SLV is inside the cloud. Okay. It broke through this consolidation box, which is good. Uh let's take a look at this on the weekly chart. It's under the cloud. So although it's showing strength recently, it's not a time to be adding positions in my opinion. Here's the VIX. Um let's look at the daily chart. It's at a level of 15.28. It would drop 44%. So that's good. It's a good sign for the markets. We want to see the volatility coming out of the market. And then finally, one more stock. We're I'm sorry, ETF, ARC Innovation ETF. Kathy Woods ETF. Um, how's that looking these days? Let's look at the weekly chart. Um, you can see that big decline that took place years ago, right back in 2021. She she had a big run here for a while. Uh, and that ETF was, you know, watched very closely. It had reached a high of somewhere around $150 or so. It's at $80.60 right now. Um it's it's it's basically broken through the cloud. Okay. So we've got a breakout two cl two weeks now. Uh this was last week. Here's this week. The cloud itself is still bearish though on the weekly meaning the susp. The chica span is above price. So we don't have like all the elements of this indicator confirming it on the weekly. Let's look at the daily. Same thing here on the daily. The cloud is still bearish on the daily. uh the faster moving averages and the slower one, but price broke above and is above both of those moving averages and it's above the 200 and it's above the cloud. Um but the chica span is under price. So it's just not quite there yet. You can also you know what's interesting about this indicator is it can keep you out of trouble because there's a lower low from the prior low. Okay. Uh and so yeah, I I would hold off on ARC obviously. Now guys, if you like what you're seeing here on this channel and you want to support this channel, one of one of the ways you can do that is hit the subscribe button. It's absolutely free to do that. Hit the notification bell so you know when my videos are coming out. If you want to do one thing um go one step further, what you can do is click the join button which is right next to the subscribe button. So you click on that and what you'll find are three different tiers. There's the Blue Cloud supporter, Blue Cloud Trader, and Blue Cloud Legend level membership. Each one with different pricing and different perks. So, BlueCloud supporter, you can request a stock or ETF be analyzed on an upcoming video, just like the ARC uh ETF that I just did. BlueCloud Trader, you can request up to two stocks or ETFs per month uh be analyzed on an upcoming video. uh BlueCloud Trader, you also get access to the exclusive member onlyly strategy video that I do each weekend. And I that's when I share, you know, typically 20 to uh 20 new stock ideas, about 10 ETF ideas for each coming week based on the analysis that I do. I'm looking for the strongest sectors, industries, and then um I also have proprietary scanning software that I use um that I have set up the rules with and share those results as well. And then what else do I do? Um under the next level, let's go back here to join and click on if you go to bluecloud legend, make sure you always make sure you you select you click on it and then hit the join button to make sure you get the right one. But let's say that you select blue cloud legend. That's the highest tier. All right. Under this one, you will uh you can actually you'll get those videos that I just mentioned, the strategy videos. You'll you can request up to three stocks or ETFs be analyzed each month. You'll get access to day trading videos only available on the legend level membership and daily stock and ETF trade updates. All right, so that's another cool feature. Uh and I usually post those under the posts tab. Uh once you become a member, there will be a new tab pop popping up here and it will say membership. All right, it will look um just like this right next to post membership will pop up and you click there. That's where you'll find those posts. Hope you're all having a great summer. I will catch you all in the next video. [music] Oh, the ichimoku guiding light. Blue cloud traing [music] through the [singing] night. Heat. Heat. [music]

Commentaires 0
Connectez-vous pour rejoindre la discussion.
Se connecterAucun commentaire pour l'instant. Soyez le premier à partager votre avis !