
- Rendement de la vidéo
- —
- Appels
- 2
- Achat / Vente
- 1 1
- Publié
Recommandations
L'entrée est le cours de clôture de l'actif à la date de publication. Le cours actuel est la dernière clôture enregistrée.
-
Entrée $103,70 21 août 2026Actuel $103,70 21 août 2026Résultat +$0,00
it was one on our considered to trim list just given how large the disconnect is
Contexte “it was one on our considered to trim list just given how large the disconnect is.”
-
Entrée $368,45 21 août 2026Actuel $368,45 21 août 2026Résultat +$0,00
out of the group I'd probably argue it's the number one opportunity
Contexte “So brocom is the most attractive base case result... out of the group I'd probably argue it's the number one opportunity.”
Transcription Complète
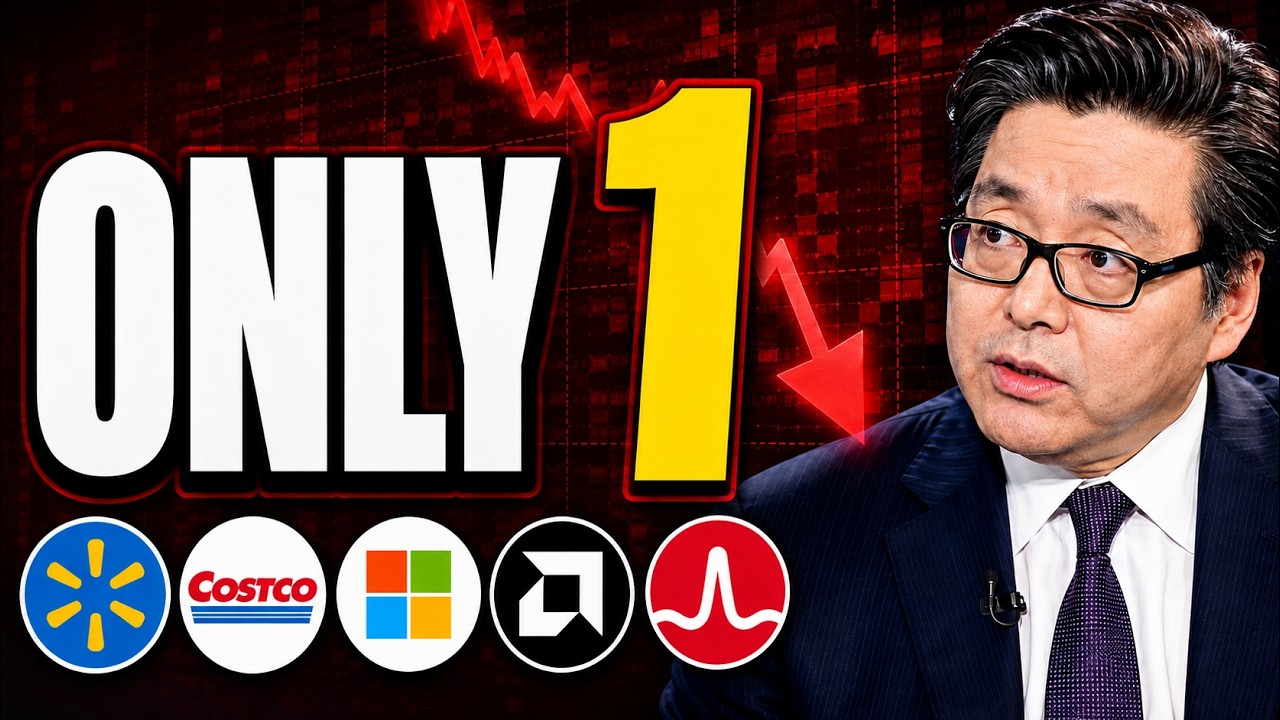
When we look at the market in just the last few days, we can see well Walmart that's down more than 10%. Advanced micro devices that's lost almost 8% in a week. Broadcom down more than 6%. And even Microsoft as well as Costco, well, they've been dragged lower. And these, they're not insignificant pullbacks from their highs. All five of these companies that we're analyzing today, they're down between roughly 13 and 16%. And perhaps you could argue this creates what looks like an obvious buying opportunity. But there is a problem. A great company can fall sharply and still be expensive. I mean, the S&P 500, it still trade at around 20 times forward earnings. Between 2008 and 2019, it didn't finish a single month above that level. And at the exact same time, we have the 30-year Treasury yield. That's back around 5.2%. That matters because the higher the return investors can earn elsewhere, the greater the return we should demand from our stocks. So today, I'm not simply asking whether these stocks are cheaper than they were last month. I'm valuing Walmart Costco Microsoft AMD and Broadcom using their underlining cash flows. And then at the end of the episode, I'm going to increase the discount rate from 8 to 10% without changing anything else. One of the stocks will survive the test. The apparent upside disappears completely for several others and one famous defensive stock looks expensive before we even make the assumptions tougher. And before we even value any individual company, we need to understand what is driving this sudden weakness. Let's listen to the contradiction Wall Street is wrestling with. The long-term outlook remains bullish, but the forces hitting stocks today, they're moving in the opposite direction. >> We uh do have an issue today. Uh we are red and it's largely because yields are back up, oil's back up, threats are back up from uh the White House and the president regarding Iran. Markets obviously don't love that. Still, as I said in the open, many big investors say the environment's bullish. Black Rock's Rick Reer, he told me on closing bell, we could get another 5 to 10% out of this market this year. >> And that distinction is crucial. The broader bullcase may remain intact while higher yields temporarily crush the prices that investors will pay for future earnings. That's why today's falling shares they must be tested with a high required return. Now also bear in mind it doesn't mean the market must crash. Expensive markets can stay expensive and earnings growth can justify premium. It does mean that we need a margin of safety rather than assuming that every red stock is a bargain. So, we're going to begin today with the week's largest fall, which is Walmart. In fact, when we look at it from its 52- week high, it's down nearly 25%, meaning it's lost nearly one quarter of its market cap. And Walmart, well, it fell yesterday nearly 10% because the market focused on one figure. That was the US comparable sales, which increased by only 2.6%, the company's slowest growth in more than 6 years. And it was also a sharp slowdown from 4.1% in the previous quarter. Sam's Club was strong at 4.4% that is also called substantially from the double-digit growth which was just recorded a few years ago. But also this wasn't a conventional earnings miss. Adjusted earnings of 81 cent the 74 estimate by around 9% while revenue 188 billion that was around 1% ahead of expectations. Revenue, well, that also increased 6% year-over-year. Walmart International, that was up double digits, 13%. Sam's Club grew 9% and operating profit reached 9.4 billion. Net profit sitting at 6.5. But more importantly, we can note here that e-commerce that grew 23%. Advertising up a strong 38% year-over-year. And those higher growth businesses, they're gradually improving Walmart's economics beyond essentially the traditional low margin store model where you also have the Sparky shopping assistant. It's gaining traction. Users increased 70% from last year and customers using it. They're reportedly spending 40% more per order. So that's a genuinely interesting long-term development. But really, the immediate question here is whether investors have confused one weaker sales figure with a deterioration in Walmart's entire business. And this analyst argues that the 10% reaction says more about the short-term expectations than Walmart's underlining health. >> So, I know you don't say buy this or sell this stock, [laughter] but when the stock is down 10% intraday, does it feel like based on your analysis and looking at the fundamentals here of Walmart uh Punim that it's an overreaction? potentially. >> Well, I I think it's a temporary overreaction in that it's not driven by the underlying fundamental health of the business right? >> That's an important distinction and I broadly agree with that. But the clip answers whether Walmart's operations are broken. It doesn't answer whether the shares are cheap. A healthy company can still produce a poor return when the starting valuation is just too high. So, I agree with the first half of that conclusion. Walmart's underlying business is intact. pharmacy deflation that hurt comparable sales. While around 2.9 billion of tariff refunds will help the company lower prices for stretch consumers, but an operational overreaction is not necessarily a valuation overreaction. And we can see that forward revenue growth for Walmart is expected to be around 5.3% ebit on a forward basis 8.1. EIT on a forward basis sitting at 8.2 two and analysts are expecting longerterm earnings per share to compound around 9.3%. These are good numbers for a retail of this size, but I wouldn't call them hyper growth numbers. And then we've got the profitability that does deserve respect. We can see return on equity that's sitting above 25%. Cash from operations that's sitting over $40 billion. But net margins that sit close to 3% while the lever free cash flow margin that's barely even sitting at one. So small changes in sales or expenses it can matter enormously for Walmart. And look even after the full Walmart trades around 35 times forward earnings versus a 5year that sits at 25 in terms of the yield that's also lower 0.95 than the five average of 1.4. So when we look at this both of these indicate to us a potential overvaluation signal for which when we then come to the blue tunnel this is from simply safe dividends which does point out the intrinsic fair price. We can see there's a disconnect between the stock price today and the upper end of the fair value. I mean look at the last 5 10 years warm up pretty much from the beginning of 2024 the stock price raced well ahead of the underlying fundamentals. Again another signal here of overvaluation and it's one of those stocks that historically when we looked at it over the last few years it was one on our considered to trim list just given how large the disconnect is. Now, Wall Street's average target is much more optimistic, $131. That implies around 27% upside, but the range it does go from 81 on the lower end up to $155. It just illustrates how different assumptions create radically different answers. And looking specifically at the discounted cash flow model using an 8% discount rate and a 3% perpetual growth rate, we get an intrinsic value sitting just shy of $80. Given where the share price sits today, that's around 23% downside, we're talking no upside at all. And then when we incorporate the multiples valuation as well as the dividend discount model, while the broader blended estimate here, it comes to just over $90. It's more forgiving, but the stock still sits around 14% above that figure, no margin of safety, a 14% premium. So my view is therefore very simple. the 10% fall. Yes, it may exaggerate the near-term operational problem that it has not created a clear margin of safety. I become much more interested around $90 and far more interested below that price. And now let's move to a company with an even stronger customer model and initially appears to pass the DCF test, but only by around $5 per share. And before we jump into that, I want to let you know that I've released my latest weekly article. We drop one every single week covering severely undervalued stocks as well as what's gone in the market over the last few days. So you can click below, sign up and read these straight away. So the next stock, Costco, it's a very different situation. It's fallen around 2.5% this week. It remains up more than 8% year to date. But when we compare it to 52- week highs that sits just shy of $1,100. It's down around 15%. And honestly, the operating performance here, it's difficult to criticize. June net sales rose 10.6%. Total comparable sales grew 8.8% or 7% if you exclude gasoline and foreign exchange while digitally enabled sales increased more than 20%. And just look over the longer term for Costco. Annual revenue has risen from around 129 billion in 2017 to almost 300 billion a compounded growth rate close to 10%. The operating margin that's also expanded from 3.2% to 3.8. And let's be honest, with Costco, one of the major advantages is their membership ecosystem. Card holders per warehouses increased from around 110,000 in 2012 to around 160,000 today, giving each location greater scale and reinforcing renewal economics. And when we compare it with Walmart, well, Costco now produces around 11.2 million of operating income per US warehouse, more than twice Walmart's 5.3 million per US store. and Costco, their figures compounded around 9.2% annually since 2020. Again, Walmart, that's lower, sitting at 6.4. And also forecast for Costco, it does remain solid. Revenue growth anticipated 8.6%. EBIT growth that's close to 12% and longerterm earnings sitting just shy of 11. You can also see their returns, they're excellent. We've got return on equity sitting around 29%. Return on total capital sitting around 18%. and Costco turns its asset base well more than 3.6 times a year is why the market consistently gives it a premium. The question though with Costco is whether the premiums become just too large. It still trades very high from C alpha we've got it here around 45 times forward earnings and when we compare it to EBIT DAR well it's sitting at more than 28 times and forward peg that's sitting above four. Now, if you want to compare it to their 5year average, well, relative to history, Costco's not unusually expensive. The forward P is pretty much close to its 5-year norm. It makes the Costco debate about whether the historical premium itself is justified. And look at the blue tunnel from Simply Save Dividends is sitting bang in the middle. Very interesting because that's different to what we just saw from Walmart. If we do in fact go back to Costco, we look at the last 10 years. Well, this company we can see has spent many many periods trading at a premium. Today though we see it in a reasonable signal. Incredibly rare if at all to see Costco over the last 10 years we can go out to the last 20 to trade in a severely undervalued level. More often than not, Costco either at a premium or very slightly in a reasonable signal. And Wall Street for Costco sees around 15% projected upside. Price target $1,77, but again very wide range 740 lower end, $1,315 at the upper. And my DCF, well, it produces a value of $939. Pretty identical to the current price today. But look exactly what is required here. Free cash flow is assumed to grow around 14% annually for the next decade. Bear in mind that is above Costco's 5year K around 10% and 10.8% of their long-term earnings forecast. But also last 10 years it's compounded 32%. So essentially even using a relatively optimistic growth assumption the margin of safety is barely even 1%. So yes Costco may be one of the best retailers in the world but at this price I'd say hold not a compelling buy. Consumer stocks have given us one expensive stock one approximately fairly valued stock. Growth rates though they're about to become much larger but so are the assumptions and the capital requirements. And the valuation challenge now changes. Walmart and Costco depend on relatively predictable consumer growth. Microsoft AMD and Broadcom, they depend on an unprecedented AI investment cycle. Before we value them, let's listen to the two questions that could determine whether today's forecasts are in fact sustainable. >> Uh there's a huge investment boom going on in uh artificial intelligence. And uh you know this this year we're getting tremendous impetus to the economy from that. But the impetus in 2027 is almost certainly going to lessen because it's not the level of investment, it's the change in investment that matters. And the change investment also matters for earnings growth of the suppliers to the AI uh uh hyperscalers. [clears throat] The last problem you have for the for the AI is just the fact that are the are the AI hyperscalers going to be able to generate the $2 trillion of revenue they need to justify their investment. >> That's the central issue for the next three stocks. Microsoft is funding the infrastructure while AMD and Broadcom benefit from supplying it. Every dollar of hyperscaler spending can become revenue for the suppliers. But ultimately the spending must generate enough cash for the customers as well. So that's why Microsoft, AMD and Brock must be judged differently from ordinary growth companies. Combined spending by Microsoft Alphabet Amazon Meta and SpaceX is forecast to rise from 400 billion in 25 to near 800 billion this year and more than 1.1 trillion in 2027. And the forecast, well, they've been revised sharply higher, but the relevant question for shareholders, not whether AI is transformative, how much future success is already embedded in each share price, and how sensitive the success is to the cost of capital. Microsoft gives us the cleanest place to start. And Microsoft, well, we can note here is flat this year. It's sitting around 13% lower than its 52- week high at $554. And it trades around 24 25 times forward earnings. Well, we do notice one strong buy from Wall Street, respectable buy from Seek Alpha, 4.15 out of five. And the latest quarter was outstanding. Revenue sat 18% higher year-over-year to 90 billion. Operating profit reached 40 billion. Net income sitting just shy of 36 billion which highlights here a 40% margin. Productivity and business processes that was up 14% year-over-year. Cloud 32% while more personal computing that declined 4%. So now for Microsoft we can note the cloud business that's doing the heavy lifting. And other cloud services grew 43% in the latest quarter. That was faster than AWS at 37% although Google Cloud was the fastest at 82% but bear in mind that was from a smaller base. And also in absolute terms the leading platforms they're adding enormous amounts of recurring revenue. Microsoft AWS and Google Cloud each added around 18 to 19 billion just in the latest quarter. And consensus they expect for Microsoft to grow around 18.4% topline and forward earnings we can note here sitting around 20%. Obviously like many of these hyperscalers. We can see that led free cash flow, it's fallen sharply for Microsoft 73% and expected to continue free cash flow for Microsoft over the next 12 months down 14. And the reason is visible here. Microsoft remains extraordinarily profitable. We're talking a 47% EBIT margin, 40% net margin, but capital expenditure that's climbed around 35% of sales. That's roughly twice the 5-year average, which sits at 17.5. So, accounting earnings are rising while more cash is being reinvested into data centers. It's not automatically bad. It may create the capacity needed for the next decade. It does mean though that today's valuation depends on whether that investment converts into cash. And see Alpha, well, they have given Microsoft an F valuation, although most of that is in fact relative to the sector where it does trade at a premium. But if we take a look at their own history, it's pretty much the opposite. Ford earnings sitting around 24 times. That's actually 21% lower than their own 5-year average. And Ford enterprise to EBIT Dar, we can in fact see here sitting at 15.11. That's in fact sitting around 27% below its historical norm. But at the same time, these figures, these numbers, these datas, it doesn't make Microsoft objectively cheap. But what it does do it makes the current multiple more reasonable than the headline grade suggest. If we compare it to the history forward P we said 2425 five average sitting around 30. So you can argue this is a potential undervaluation signal for which when we look at the blue tunnel even after the rise that we've seen from their 52- week lows it's still sitting below the bottom end of the fair value. So another potential undervaluation signal. Look at the last five t years. We've never seen in fact in this period such a massive discount although a lot of this has been recovered. And then we have Wall Street's average price target $569 implying around 18% upside. Again like we see with most stocks on this channel the range extremely wide 400 low end $870 at the upper end. And my DCF explicitly reflects the current investment cycle. Free cash flow initially drops and then recovers as the infrastructure begins producing returns. And using a 15% medium longerterm growth as well as the 8% discount rate, we can see we had a value of $490. Now that's slightly above the current price at 481, but only a 2% margin of safety. So Microsoft looks reasonably valued and more attractive than the sector relative grade, but it doesn't yet look like a major bargain. Next company we're going to get on to much faster growth, share price that's more than double this year. The question is whether the earnings can catch up quickly enough. And the company is AMD which has fallen almost 20% from its high down in fact nearly 8% just this week. But the context does matter. In fact when we look at the stock it's up more than 100% year to date. We also notice even after the strong run both Wall Street and Quant give it a strong buy seeing alpha though they do give it a hold and the rally has been powered for AMD by genuine improvement. Quarterly revenue was up 50% year-over-year, reaching 11.5 billion. Data Center, that more than doubled, in fact, sitting at 6.7 billion, while their net profit reached 2.3. And bear in mind that AMD's data center revenues risen from just 610 million in early 21 to more than 6.7 billion in the latest quarter. So for AMD, it's no longer merely a future AI story. The revenues arriving now, but also factor in that for AMD, the strength is not uniform. We can see client revenue that was up 23% embedded up 19% but gaming actually declined quite significantly around 31. So data centers becoming increasingly important to the entire valuation of AMD. But the good thing here is the forecast numbers they're exceptional. Forward revenue expected to climb over 50%. EBIT DAR sitting over 78% and we can see EBIT 69 with long-term EPS projected around 66%. And combine that with margins also improving. Gross margin 56% net income margin sitting above 15 and levered free cash flow sitting at 21.4. Where the market also expects the momentum to continue. Operating profit is forecasted to rise from 4.4 billion over the last 1 month to near 14 billion in 26 and more than 35 billion by 2028. That is an extraordinary step change and it needs to happen because when we take a look on conventional multiples AMD does remain expensive 62 times forward non-GAAP earnings that's almost 60% above its own 5year average and forward enterprise value to EBIT DAR that's sitting at 56 times but also if the forecasts are achieved the multiple falls quickly from 62 times this year down to 30 by 27 22 and 28 and 16.2 two on 2029 numbers and the forward peg ratio below one explains why growth focused models look more favorable with Wall Street's price target sitting at $613 implying around 31% upside although estimates incredibly wide 365 lowend highend $1,250 and my cash flow model assumes 20% annual growth for the next decade again 8% discount rate producing a value of $468 almost exactly where the shares trade today. So AMD is therefore not obviously overvalued if its growth continues, but there is effectively no margin of safety. At this price, investors are already paying for a very successful decade. And the final company also trades at a premium. But unlike the first four, the base ECF shows a much larger gap between price and value. First, however, we need to understand a proposed financing structure that sounds more alarming than it actually is. and Broadcom. It trades around $364, more than in fact 25% below its 52- week high. The stock's only modestly positive for the year despite enormous AI related growth where we get a strong buy from Wall Street with a 4.1 out of five from Seek Alpha. And the latest issue is a proposed AI chip financing deal reported at more than 60 billion with a total structure potentially reaching 100 billion. And the 100 billion headline can be easily misunderstood. before judging it, listening carefully to how the proposed financing is divided and what Barack may actually be guaranteeing rather than directly borrowing. >> This would essentially see Blackstone and Apollo participate again per our sourcing and reporting in a deal that could essentially see Broadcom line up as much as hundred billion in debt. I mean when you put that together it's sort of 30 billion being provided by Apollo and Blackstone and then Broadcom itself essentially looking at maybe backstopping/g guaranteeing uh somewhere in the region of 60 to 70 billion. >> So the correct conclusion is not that brocom has simply borrowed a hundred billion onto its balance sheet. The real questions are how much of the senior tranch it ultimately guarantees who carries the credit risk and whether the additional chip demand adequately compensates shareholders for that exposure. And the distinction is important. This is not simply Brocom borrowing a h 100red billion and placing the entire amount on its own balance sheet. The proposal may include roughly 30 billion of junior debt from outside capital providers while Brocom could guarantee part of a 60 to 70 billion senior secure tranch. So it can accelerate demand for Broadcom's AI chips. But it also introduces counterparty credit and execution risk. So investors need to understand the final guarantees rather than treating the headline as either automatically bullish or automatically disastrous. And the operating numbers here explain why Broadcom can contemplate a structure of this scale. Forward revenue estimated to be around 50%, EITR 55% and adjusted earnings we can see in fact over the next 3 to 5 years 48% next 12 months sitting at 59%. And worth pointing out that Broadcom's profitability is the strongest of the five companies. Gross margin that's sitting at 76%, EBIT margin 44% and net margin sitting near 39. Even led free cashra looks very good sitting at 36%. But the stock is not conventionally cheap. It traded based on seek alpha data around 31 times forward adjusted earnings. We can see 24.7 times forward ebitar and seek alpha gives it a D minus valuation grade but the growth adjusted valuation that's very different for example forward peg that sits at only 66 compared with the sector median sitting at 1.24 and if the estimates are achieved well the earnings multiple drops from 31 times this year down to below 19 on 2027 and down to sitting somewhere around 11 by 2029. And for consistency, we'll show the data from simply safe dividends where it has the forward P not too dissimilar from their own 5year average. Although the yield does sit much lower 7 versus 1.7 and likewise when we look at the blue tunnel, it actually sits towards the low end still though in the reasonable signal. Look at the last 5 10 years. Broadcom is one from 2023 was trading at a massive premium. Although we can see sometimes where the premium dropped. Today though, as we can see, it's sitting right towards the lower end of the blue tunnel. And Wall Street's average price $526 implying 45% upside although the lowest estimate sits at 216. And the DCF is where Broadcom separates itself. We can see starting free cash flow that jumps to 48 billion. This is based on analyst estimates and then followed by the middle 15% rate and that gives us a value $457 which implies around 26% upside also for example if we want to look margin of safety based on those numbers sits at 20%. So brocom is the most attractive base case result but it also relies on the largest immediate cash flow increase the tougher test now decides whether the apparent bargain is robust or simply the product of a generous discount rate. So, every base DCF used an 8% discount rate and a 3% terminal growth. I've now kept every company's forecast cash flows, cash, debt, share count, terminal growth unchanged, but increased the required return to 10%. Is deliberately demanding, but with the 30-year Treasury above 5%. It shows which valuation has genuine room for error. So, remember using the DCF for Walmart, the discount rate was 8% gave us a value of $79. If we increase that to 10%, well, naturally the value does drop lower and that sits around $51, increasing the overvaluation signal given the share price sits at $103. We then had Costco with the 8% discount rate using the middle rate $939. Not too dissimilar from today's price, increasing that discount rate to 10%. So the value drops to $646. No surprises, no margin of safety. In fact, a massive 45% premium. We then have Microsoft where we had initially the 8% discount rate $490. Again, a very very trivial MOS of 2%. Changing that discount rate now to 10%. Well, it drops it to $325. Delayed cash flows. They are especially sensitive to a high required return. And when we take a look, massive premium sitting at 48% with AMD at the 8% discount rate, we had $468 pretty much in line. So, no margin of safety, but likewise no premium. Increasing that now to 10%. Well, that sits at $313. Massive over valuation signal and a huge premium sitting at 50%. And then finally, we get to Broadcom. We're at the 8% discount rate. We had $457. We had a margin of safety of 20%. Increasing the eight now to 10%. We get $36. We don't get a margin of safety, but you can see here compared to others, it is on the smaller side. Still premium noting here 19%. So Brocom you could argue is the best one when we do that 10% test. So out of the group I'd probably argue it's the number one opportunity. But at the same time I wouldn't ignore the proposed financing guarantees or the huge jump required in 26 free cash flow. But it offers out of all them the strongest combination of growth margins and valuation. Microsoft though I would have in second place is not deeply undervalued but it trades well below its own historical multiples while revenue and earnings are still growing 18 to 20%. I viewed as a very stronghold and a potential add-on further weakness sitting somewhere below the $400 mark. AMD I'd have third the business momentum that's spectacular but after around 120% year-to- date rise the valuation already assumes around 20% annual free cash flow growth for a decade. I'd hold or wait for a price which is below $400 rather than chase the current pullback. Costco would have fourth. It may be the highest quality consumer business here, but quality is not a substitute for valuation. Even the base case requires optimistic cash flow growth and gives us almost no margin of safety. Around $800, the risk would become much more interesting. And Walmart, while that comes in at number five, the sell-off does not mean the business is broken, but the stock still trades far above its historical earnings model. and above my blended value. A price near $90 would be more reasonable. The tougher cash flow test that points much lower. So the central lesson is the draw down measures how far a stock has fallen, not how cheap it's become. Walmart's fallen more than Broadcom this week, but Broadcom produces far more cash relative to the growth investors are paying for. And when safe yields are this high, the discount rates not a technical footnote. It can be the difference between an apparent bargain and 15% downside. Let me know then in the comments which of the five you'd buy after the pullback, whether you think a 10% required return is too demanding or exactly what today's market requires. And don't forget to sign up to the weekly newsletter. As always, you can click on the pin comment, read these straight away. More importantly, have a great day. I'll see you all on the next
Commentaires 0
Connectez-vous pour rejoindre la discussion.
Se connecterAucun commentaire pour l'instant. Soyez le premier à partager votre avis !