So I'm looking for a breakout here to the upside. And if it doesn't then you know it's a no trade which is nice as a trader. So I'm going out to regular September. So that would be the 18th. I'm going with the 363, 73, 75 broken wing call fly.
Contexte
"So I'm looking for a breakout here to the upside. And if it doesn't then you know it's a no trade which is nice as a trader. ... So I'm going out to regular September. So that would be the 18th. I'm going with the 363, 73, 75 broken wing call fly."
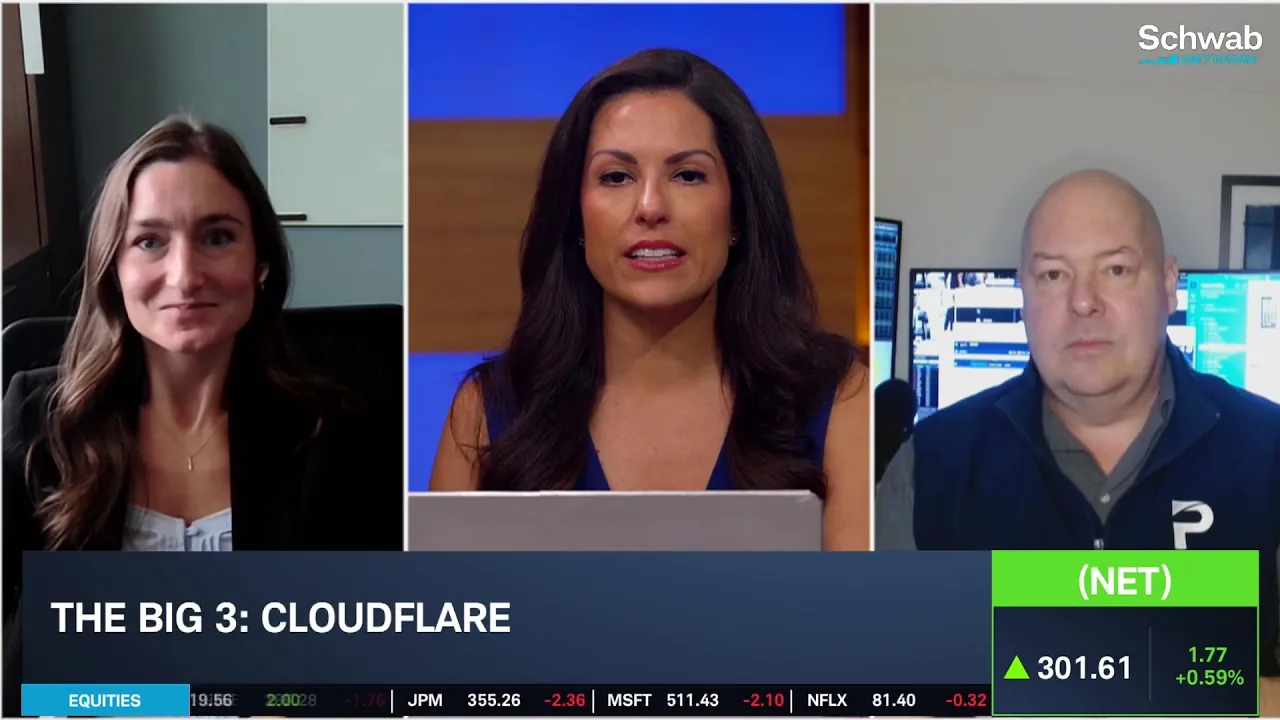
So I'm looking for a trade above three 1060. And then we're going to go with a broken wing fly. Again, this one a little bit different mostly because of the strikes, but I'm going to be targeting the 340 line with that. So the 325343 50 call broken wing fly should be able to buy that if we, if we get above that three 1060 should be trading about $2.40.
So I'm going to go with with a call calendar. So I'm looking at next week or no, I'm sorry. This week the nine four versus 918106 call spread.
Contexte
"So I'm going to go with with a call calendar. So I'm looking at next week or no, I'm sorry. This week the nine four versus 918106 call spread. ... And you know, so for a calendar spread that's really good reward to risk."
Transcription Complète
invest your way with Schwab. Welcome back to trading 360. I'm Marley Kayden it's time for the big three. We've got three stocks three charts and three trades for you Rachel. Michelle will be taking us through the charts today here to take us through the trades. Mike Shaw director of trading education over at Prosper Trading Academy. Great to have you guys on today. Mike. I would love to start with you. And just a big picture thought on how we're kicking off this week and the last trading day of August entirely in the red. Yeah, I mean, not surprising given what happened over in Iran over the weekend. You know, I don't think, you know, I haven't seen a reaction higher, you know, or more escalated than it than it has been. So, you know, I think that at least for now in the market is trading it as cautionary, but not like a, you know, a new step into a new phase of this conflict. And so, Mike, as we look at cadence design systems here, which is your first pick in the big three, I'm just looking over their chart. I mean, they've moved higher since they raised their guidance, but not enough to cancel out their year to date losses. They're still down about 3%, but they did have a record backlog. I think it was just north of $8 billion or so here in that latest quarterly report. How are you looking at cadence right now. Well this should be you know an interesting week because we do have a lot of AI and AI related earnings coming out with the likes of Dell and Zscaler and things like that. And so we're butting up against resistance here. And so I was looking for a breakout above that. But you know for right now it's not there. So you know I always like to let the market do the heavy lifting for us. And then we'll just come on and go across the finish line. So I'm looking for a breakout here to the upside. And if it doesn't then you know it's a no trade which is nice as a trader. All right. So you're looking for a breakout. I know I can see here from your trade that you've got a call butterfly here. Walk me through what what strikes you're focused on here and how you play this one specifically. Sure. So I'm going out to regular September. So that would be the 18th. I'm going with the 363, 73, 75 broken wing call fly. So an asymmetrical fly. And you know, the, the implied volatility is lining up with that 70 strike. And you know, actually if we do get that break up to the outside, it could go a little bit further. So that's why I protected myself with a broken wing fly. So I still get money. You know, I still make money on the on an extended move up. All right. So Rachel, I want to bring you in here and take a closer look at Cadence and Mike's broken wing call butterfly that he's looking at. We've got a 362 break even. We're below that right now at 33877. But looking for a move to the upside are the technicals indicating that we could be due for that upward move? Yeah quite possibly. So cadence has seen a downtrend for the last couple of months. There is quite a bit of resistance at that confluence of the anchored VWAP and the July gap right around 358. So really close to that 360 level. There has been a bullish momentum divergence off of the lows, which could give a hint to a possible bottoming process in play. And momentum really seems to be strong currently to give it that push towards that level of resistance. But if it starts to wane, traders will look for that prior low to be retested around 310. Yeah. And so Mike here as we move to your next one here with Cloudflare and we look at Cloudflare. I mean a little volatility within but overall momentum to the upside for Cloudflare. We're looking at a 50 plus percent gain year to date here. How are you approaching Cloudflare. Yeah. So I like the sector in general. And and net Cloudflare is, you know, at the top level of, of that sector. And so, you know, again, that's still going to be driven by this AI type of trade. And, you know, so I'm going to wait for this. This is what I call an inside bar entry. And so I'm looking for a trade above three 1060. And then we're going to go with a broken wing fly. Again, this one a little bit different mostly because of the strikes, but I'm going to be targeting the 340 line with that. So the 325343 50 call broken wing fly should be able to buy that if we, if we get above that three 1060 should be trading about $2.40. Really nice reward to risk on that. All right. Rachel. So three 1060 are you seeing that level as being important when you look at the technicals here? Yes. So what I'm looking at is one is that beautiful massive cup and handle breakout to new highs. We saw momentum with the MacD really confirmed that price movement to new highs. But with that latest weakness in tech we did see price really retested that polarity at old resistance. Now new support. So I think it's constructive that support. We have had a confirmed bounce at that level. Now near-term support is around 291 or so. But it is setting up for a bull flag pattern which could take it back to new all time highs. So that's what kind of traders will look for up ahead. And Rachel, what else are you seeing in the technicals. I know you have a second chart for us. So walk us through what you're seeing. Yeah. So that cup and handle formation that we saw in the shorter term is actually now a part of a cup in the much larger fractal cup and handle from prior cycle highs. So we see price stalled out recently at those all time highs at a pretty logical level. And it was on point at the one 61.8% Fibonacci retracement level. And so for base breakout traders, that's always going to be the typical first profit taking zone. So it makes sense that there was a lot of overhead supply there. I would say if price can climb across 335 here in the near term, that next resistance is going to be. 406. So from a longer term perspective, that trend is strong and looks like it's just getting stronger. So it definitely would support favor for the Bulls here. All right. Right now Cloudflare also higher on the session despite the broader markets being down. We're at 301 50 up about a half of a percent. I'm looking forward to this last one that you brought today Mike. You've got Walmart here. Came under some pressure with its earnings despite a lack of consensus about whether or not they were strong. There seems to be a great divide there. But we are seeing Walmart under some pressure, even though it has a 52% increase in U.S. marketplace sales in fiscal 27. So how are you approaching Walmart right now, and what are your expectations going forward? Yeah, I'd almost classify this as a as a bottom feeder type, but we did see a really nice base get put in there at about just above the 102 level. And in, you know, I didn't think the numbers were that bad. Obviously, the market was looking for something even better. And you know, I think that reaction is pretty overdone. And we we do have a significant gap to the upside. If we can get this thing going now, it doesn't it doesn't have a whole lot of implied volatility to it. So I'm going to approach this with a calendar spread because even though we're on the lower end of this trading range, implied volatility on a relative basis is not expensive. That screams calendar or diagonal if you like that sort of thing. But I'm going to go with with a call calendar. So I'm looking at next week or no, I'm sorry. This week the nine four versus 918106 call spread. So not even not even covering half of that gap or this is a call calendar, not even covering half that gap. It's going to be relatively cheap. And for about $0.85. And so I want to get above those, those little recent highs at 103 67. And the way I have it modeled out, this thing should make about $1.25 to $1.45, depending on what implied volatility does. And you know, so for a calendar spread that's really good reward to risk. And you know, just relatively not you know, I mean how scared can you be, you know, buying Walmart at prices that we haven't seen for quite a while. Yeah. Less expensive trade here Rachel. As we're looking at Walmart. I mean it's been under really like almost a magnifying lens, like scrutiny of late in terms of its numbers and the reaction that we saw. But what are you seeing in the, in the technicals as we look back over just how much pressure has been put on this name? Yeah. So like you mentioned, there has been a ton of pressure, especially we had that big double top breakdown and the risk on environment for equities really hasn't been great to staples. We haven't really seen a lot of defensive rotation. And just the other week we did see that breakaway gap that break of support as indication of that new downtrend. And however I'm kind of agreeable with you here. I'm in the camp that this little triangle consolidation below gap resistance at 107 may eventually turn into an exhaustion gap. A couple hints. I'm looking for is possibly momentum with the MacD forming that bullish divergence off of the lows. We have seasonal headwinds as well with seasonality coming right around the corner. So it could kind of suggest further rotation into this name, as well as looking at some of the long term levels too. And Rachel, we were talking about some of the pressure it's been under, but let's look at more of those long term levels as well here. Because, I mean, as I'm looking over the five year chart that I just had pulled up, I mean, we're up north of 100% in Walmart. It certainly hasn't been under the microscope like we've seen of late over this longer term scale. Yeah, I would agree. The longer term really paints a picture of why I believe investors and traders will step in and buy Walmart at these crucial levels. So we have the weekly price sitting right at the confluence of prior highs in that 38.2% Fibonacci retracement, around 102. So that was the level that he highlighted as well. And momentum to the downside has been strong with the MacD is showing that there may be early signs of that waning. So I would say the biggest signal for confirmed bounce for traders and investors here is going to be a weekly close above that low candle. So a weekly close above 107 to confirm a bounce for further upside in Walmart here. All right we're just about $2 off of that retracement level that you mentioned about $3 below where we're looking to close to confirm some of this upward movement. We're at 133 for Walmart. It is up 1.2% today. Really appreciate you both

Commentaires 0
Connectez-vous pour rejoindre la discussion.
Se connecterAucun commentaire pour l'instant. Soyez le premier à partager votre avis !