

Joseph Carlson After Hours
YouTube Creator • Market Analysis
Are you Joseph Carlson After Hours? Claim this profile and respond to your calls.
- vs. index
- +4.7%
- +2.6% raw
- Videos scored
- 36
- Calls
- 168
- Win rate · 168 calls
- 56%
- Months active
- 7
Joseph Carlson After Hours: tracked call record. Across the full tracked record, 168 of 168 published calls are scored, with an average call return of 4.12%. Scored calls were published from 13 Apr 2026 to 28 Sep 2026, measured from each entry price to its latest available close (price dates: 05 Nov 2026 to 07 Nov 2026). Average benchmark excess is 6.18 percentage points, based on 166 of the 168 scored calls only. Unscored calls are excluded from averages. Holding periods and price freshness vary. These are averages of directional call returns, not an investable portfolio return; fees, dividends and execution costs are not included.
The headline above the call table is a separate stored metric: average video return 2.62% and benchmark excess 4.73 percentage points, for videos published within the trailing 12 months at the last calculation. Videos have equal weight; excess includes only benchmarked videos. Its exact calculation date and sample size are not stored. The tracked-video and total-call counts cover the full record.
Tracked calls
48 assets · 168 calls priced · market close 07 Nov 2026
- SNOW NYSE Buy Calls 1 Avg return +64.1% vs. index +64.9%
- CROX NASDAQ Buy Calls 1 Avg return +56.6% vs. index +57.3%
- ABNB NASDAQ Buy Calls 1 Avg return +43.2% vs. index +45.5%
- HRB NYSE Buy Calls 1 Avg return +42.1% vs. index +42.9%
- SHOP NASDAQ Buy Calls 1 Avg return +37.0% vs. index +39.4%
- RDDT NYSE Sell Calls 1 Avg return +35.7% vs. index +40.1%
- M NYSE Buy Calls 1 Avg return +30.6% vs. index +31.4%
- DUOL NASDAQ Buy Calls 5 Avg return +25.4% vs. index +28.0%
- DAL NYSE Buy Calls 1 Avg return +24.1% vs. index +24.9%
- MSFT NASDAQ Buy Sell Calls 10 Avg return +20.1% vs. index +21.1%
- SPOT NYSE Buy Calls 2 Avg return +20.0% vs. index +19.9%
- V NYSE Buy Calls 4 Avg return +19.8% vs. index +22.2%
Showing the 12 strongest of 48 assets called.
All Videos


I’m Buying $10,000 Of This Company Next
▲GOOGL
▲MA
▲AMZN
▲META
▲SPGI
▲ASML
▲NFLX
▲COST
▲TXRH
▲MCO
▲DUOL
▲DASH
▲UBER
▲MSFT
−3.4%
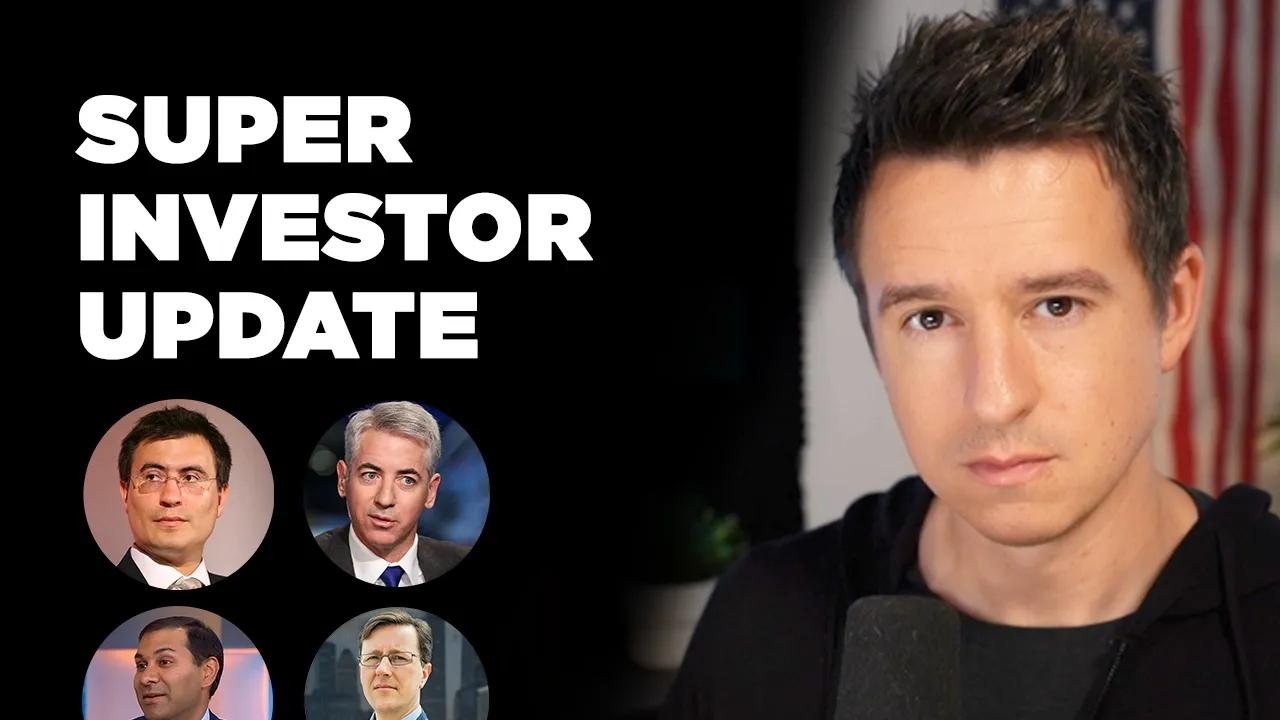
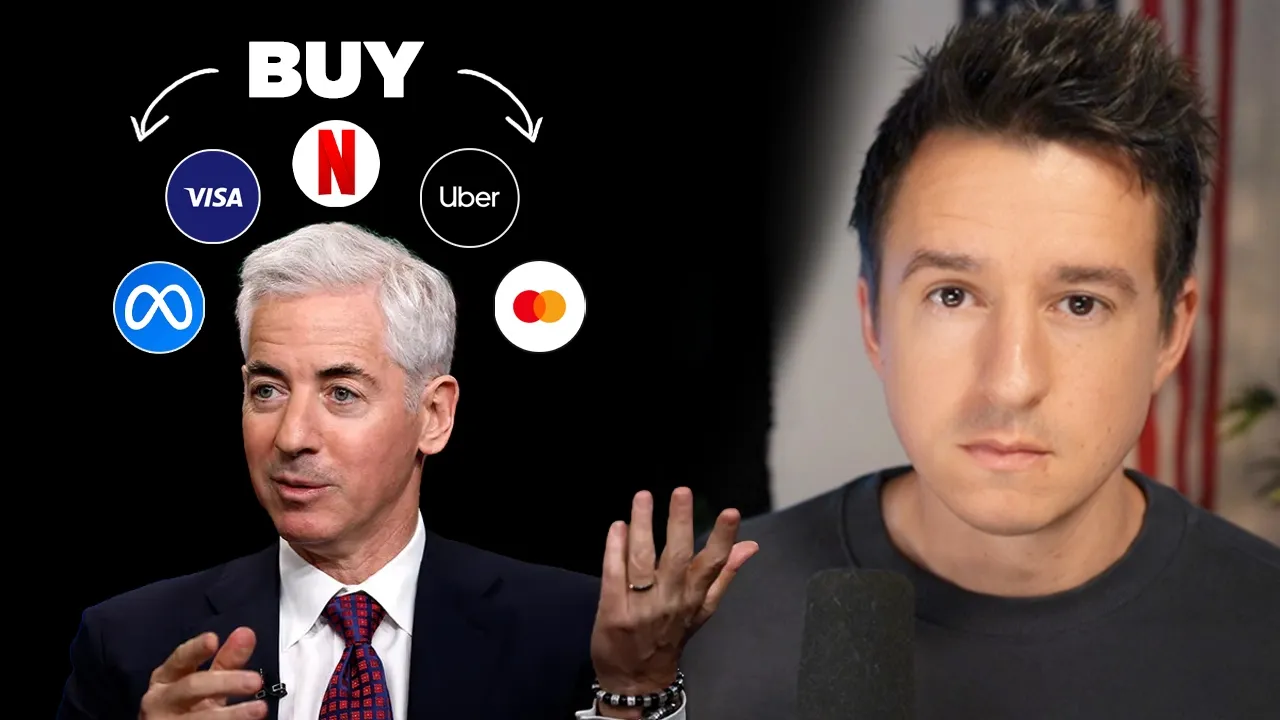
All The Pros All Buying These Companies
▼ASML
▼MCO
▲SPGI
▲V
▲MA
▲NFLX
▲META
▲META
▲META
▲UBER
▲UBER
+6.7%

Understand these figures or report an error: Methodology Corrections policy