Is This Stock Finally Cheap…or Still Falling? | VectorVest

- Retorno do vídeo
- +29,47%
- Chamadas
- 2
- Compra / Venda
- 0 2
- Publicado
Recomendações
Entrada é o preço de fechamento do ativo na data de publicação. Atual é o último fechamento registrado.
-
Entrada $8,49 10 jul 2026Atual $5,33 25 ago 2026Resultado +$3,16
So, part one, it doesn't pass.
Contexto Here it doesn't look like that. It's been dropping for about 9 months...
-
Entrada $1.915,92 10 jul 2026Atual $1.493,12 24 ago 2026Resultado +$422,80
Don't buy while it's still falling.
Contexto In order for it to pass the test, the stock's price has to start to go back up again...
Transcrição Completa
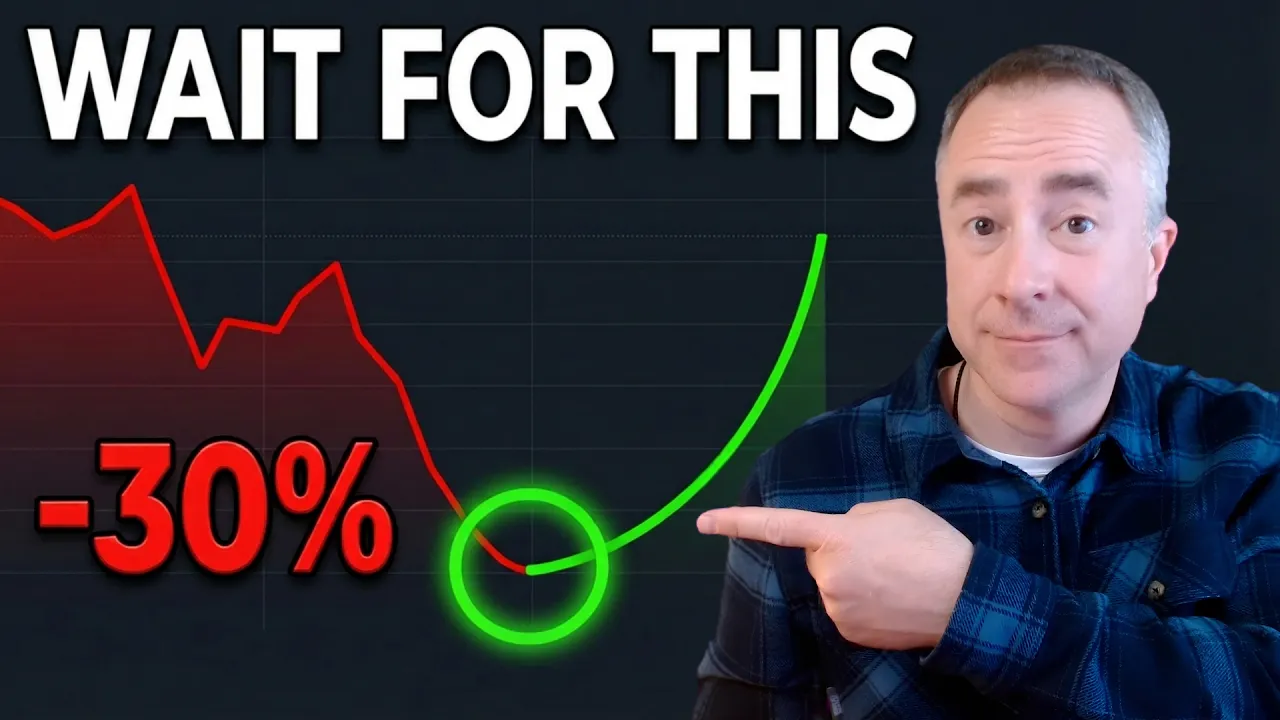
You just watched a seemingly good stock drop 10, 20, 30%, and you're wondering, should I buy it now or just wait? We've all been there, wondering that if you do buy it now, will it continue to drop or if you wait, are you going to miss out on this big rally? But after 25 years of working with thousands of our members here at Vectorvest, I know the three specific things that you should be looking at so that you could tell the difference between a stock that is temporarily dipping and one that's just going to continue to slide. That's what we're going to cover in today's video. Let's get to it. Over the last several months, we saw this huge rally in the market, specifically in the tech sector with AI stocks leading the way. But we also saw most recently a lot of them come under pressure. But anytime that happens, you got a lot of these bargain hunters coming in trying to catch these stocks coming off a bottom. But just because a stock's price is down, it doesn't mean you should buy it. And that's a big difference between our philosophy here at Vectorvest and what you'll hear in the financial media. So, I'm going to teach you the three parts of our bounce framework. And I like to think of it as eating a bowl of soup. Part one. In order for you to want to eat that soup, it's got to be made up of good ingredients. Otherwise, I mean, why would you want to eat the soup? So for you to even want to buy a stock, it needs to have good ingredients too. That means consistent predictable earnings, high earnings growth rate, low volatility, things like that. Part two, in order for you to actually eat the soup, the spoon needs to be coming back up out of the soup with the good ingredients on it. If the spoon is still going down into the soup, well, you can't eat that. If the spoon comes back up empty, well, there's nothing to eat there either. You can try to eat it, but the results aren't going to be very good. So, if a stock is still going down, you don't buy it. If it starts to come back up, but it's not made up of good ingredients, you don't buy it. Again, you can try, but the results over time aren't going to be good. Lastly, part three. You've got the spoon coming towards your mouth, but before you eat it, you blow on it. [sighs] That's the outside force helping the soup. So, with your stock, before you buy it, you want to make sure the wind of the overall market is helping you. You want the overall market to be trending higher. To help us out, I built this watch list of stocks that I've seen in recent headlines that were talking about stocks that have been recently beat down. These are those news articles that get you really tempted to say, "Oh man, this stock has been beaten down. Let me just jump in and ride this thing back up." Well, let's take a closer look using our bounce framework and our soup test. One of the things that we hear time and time again from our members is that Vectorvest helps remove the noise that's out there in the market. Because come on, the market can dump so much data on you. Sometimes it's a little overwhelming. One of the ways that we do that is through our indicators for value, safety, and timing. But you don't have these indicators right now, unless of course you're a subscriber to Vectorvest. So let's look at some graphs first so you can see the pattern that you should be looking for. So let's just come up here and graph them all. Now, let's specifically go through that bounce framework. And I like to use that soup test that we talked about earlier. Part one of the test was to make sure it's made up of good ingredients. So, we're looking at SanDisk here. And this one, it looks like it is made up of good ingredients. Stock is going from bottom left to upper right with price, low volatility, and it does look like this recent pullback is part of a bigger uptrend. So, so far so good with price. We're looking down here with earnings and earnings growth rate. Remember, we always say here at Vectorvest, earnings is the engine that drives stock prices higher over time. And this is picture perfect of what you want to see. So, it's made up of good ingredients. And something like this is very tempting when you see a graph like this. But what does it not have? Well, remember part two of the test is to make sure that price is rising again and not still falling because you don't want to buy a stock that's still falling because you never know how far it can keep falling. Remember, you can't eat the soup unless the spoon is coming back up out of the bowl. So, what do we see here? The stock price, as of this recording, is still falling. In order for it to pass the test, the stock's price has to start to go back up again. And what does that look like? Well, it could start to go back up and take out some of these prior highs, like the prior candle here, making sure that the market is in your favor. Remember, that's part three of the test. Or it could be a little bit more prudent and make sure it takes out the prior high. Either way, this stock's price needs to be bouncing back up before you even consider buying it. Don't buy while it's still falling. You can see times in the past where we've seen the same thing way back over here. It pulled back. You don't buy as it's still falling. You wait for it to go back up. There's a more aggressive entry there or it could take out this prior high over here. Either way, you buy as it starts to rise again. The same thing here. It pulled back. You don't buy as it's falling. You wait for it to go back up. You see it over and over again, but you don't buy unless it starts to go back up. So, this one almost passes the soup test, but not quite. Let's take a look at the next one. This one is Shutter Stock. I saw this recently in a news article talking about how it was down from 26 all the way down to 14 and then it dropped all the way down to 10 and trying to get people to think, "Oh, is now the time to buy Shuttertock?" Well, let's see if it passes the soup test here. We need to first make sure it's made up of good ingredients. First, we'll start off with price. Is price going from bottom left to upper right with low volatility and a recent pullback is just part of a longer uptrend? In other words, is the pullback just like a minor break in an otherwise extended uptrend? Well, here it doesn't look like that. It's been dropping for about 9 months. So, this pullback isn't really a pullback. It's a continuation of a longer downtrend. The other things we see here, earnings per share falling. Earnings growth rate is negative. So, no good ingredients here. Why would you want to eat that soup when there's other soup out there that's made up of good ingredients? So, part one, it doesn't pass. Part two we typically wouldn't even look at if it fails part one. But part two, you can see it is still falling as of this recording. It hasn't even started to bounce back up. So part one and part two it's a fail. Now part three we can't look at yet because part three is to make sure that the market is in your favor. I'll talk more about that in a second. So shutter stock, could it bounce back up? Yeah, it could. But you want to put probability on your side. Let's look at one more. Let's go over to Tesla. This is one where a bigname company can be tricky for a lot of investors. It might be a familiar name with some fancy cars out there on the road, but it still needs to pass the test. Part one, let's see if it has good ingredients. Here we start with price again. Is it bottom left to upper right with low volatility? Not quite. This thing has been up and down and up and down. It's basically been sideways for almost this full year. This recent pullback is not just a minor break in an extended upturn. So even if it bounces, you have no idea and no confidence on what direction it's going to go next. Plus, if you look down at earnings, earnings has been falling steadily and earnings growth rate is also negative, just like we saw with Shuttertock. So, this is not made of good ingredients. So, again, even if it bounces, since it failed part one of the test, you typically wouldn't even look at part two. Let's just go back and look at the watch list itself. without even looking at a graph. How has Vectorvest helped our members cut through all that noise that the market dumps on you every single day? Well, I actually did a full video on this single topic talking about value and safety and timing and everything that we look at to help you as an investor and I'll link to that in the description. But here's a quick summary. So, if we look here, we first off calculate the value of every stock. And ideally you want it to be undervalued like SanDisk is here. The next four indicators here are on a 0 to2 scale. So above one is favorable. First one here is relative value or RV. That looks at the upside potential compared to an alternative investment in a bond. So for example here with SanDisk uh a rating of 1.8 8 tells you it's got the potential to outperform a bond by 80% over the next 1 to 3 years. That's some incredible information to have. Whereas Tesla down here has the potential to greatly underperform a bond. The next indicator is RS or relative safety. That's going to be looking at things like the consistency and predictability of the company's financials, the company's debt, how long the business has been around, the price volatility. So values above one here tell you that that company is safer than the average stock in the database. So here we've got SanDisk slightly above average. Tesla's actually got a very good rating here with relative safety. Then we come to relative timing that tells us the [snorts] price trend. The farther above one it is, the stronger the uptrend. So we can see here that Shuttertock is in a pretty strong downtrend. SanDisk is in a overall strong uptrend. So that gives you the confidence that this minor pullback is part of a bigger move that is up. Then we come over to VST which is our master indicator combining these three. It's not a straight average. It is weighted a little bit. And then we come to our earnings formulas. And these are proprietary. Our earnings per share is actually really smart. It is a 12-month forecast. And it combines current earnings, historical earnings, and analyst forecasts. And it kind of puts it together into a little mixing pot. and it gives you a 12-month forecast. It is extremely good. And then we've got our earnings growth rate. And this is what we looked at earlier where these two stocks down here have a negative earnings growth rate whereas SanDisk is extremely strong. So within seconds, you have a better, more thorough understanding of any stock than most industry experts. The other thing you could do is I put a link in the description so that you could get a free stock analysis of any stock that you own or are interested in where we will send you an analysis report with all of these indicators on that stock that you're interested in. Use the link in the description and check it out. The last part of our framework is the overall market trend. Before you buy any stock, you want to make sure that the market is in an overall uptrend. Every day, we give you this information. The homepage will either be green, yellow, orange, or red. And just like a traffic light, you're only going to want to cross the road if it's green. So, you're only going to want to buy stocks if you see green and it says safe to buy. This is one of the reasons why Vector is so helpful. >> [music] >> It removes the emotion from those headlines and it turns your decisions into structured decisions. We like to say that you're going to become a confident, disciplined investor. So before you buy any beaten down stock, use the bounce framework and make sure it passes that soup test that we talked about today. Number one, does it have good ingredients? Number two, is the stock resuming its uptrend? And number three, do you have the market's wind at your back? In other words, is the market in an uptrend? If you'd like us to help you become a more confident, disciplined investor, take a 30-day test drive of Market Launchpad. I'll put the link in the description for you. Other than that, I hope you have a great night and God willing, I'll see you in the next video. Take care. Vectorve Vest Market Launchpad is like your personal AI assistant analyzing the market 24/7 and showing you exactly what to buy, when to buy, and when to sell. >> There's nothing that comes close to Vector. >> I beat the S&P 500 and the NASDAQ and the Dow. >> Get rid of the noise and zero in on data. >> If I'd have had this, I probably would have retired 10 years earlier. I'm not worried about our future. >> Start your risk-free trial of Vectorvest Market Launchpad today. >> [music] [music] [music] [music]
Comentários 0
Entre para participar da discussão.
EntrarAinda não há comentários. Seja o primeiro a compartilhar sua opinião!