I'm looking at the August 14th 170 two half 180 call vertical. I like it for three and a quarter, $3.25 or lower.
Contexto
Charles: "I'm looking at the August 14th 170 two half 180 call vertical. I like it for three and a quarter, $3.25 or lower."
Transcrição Completa
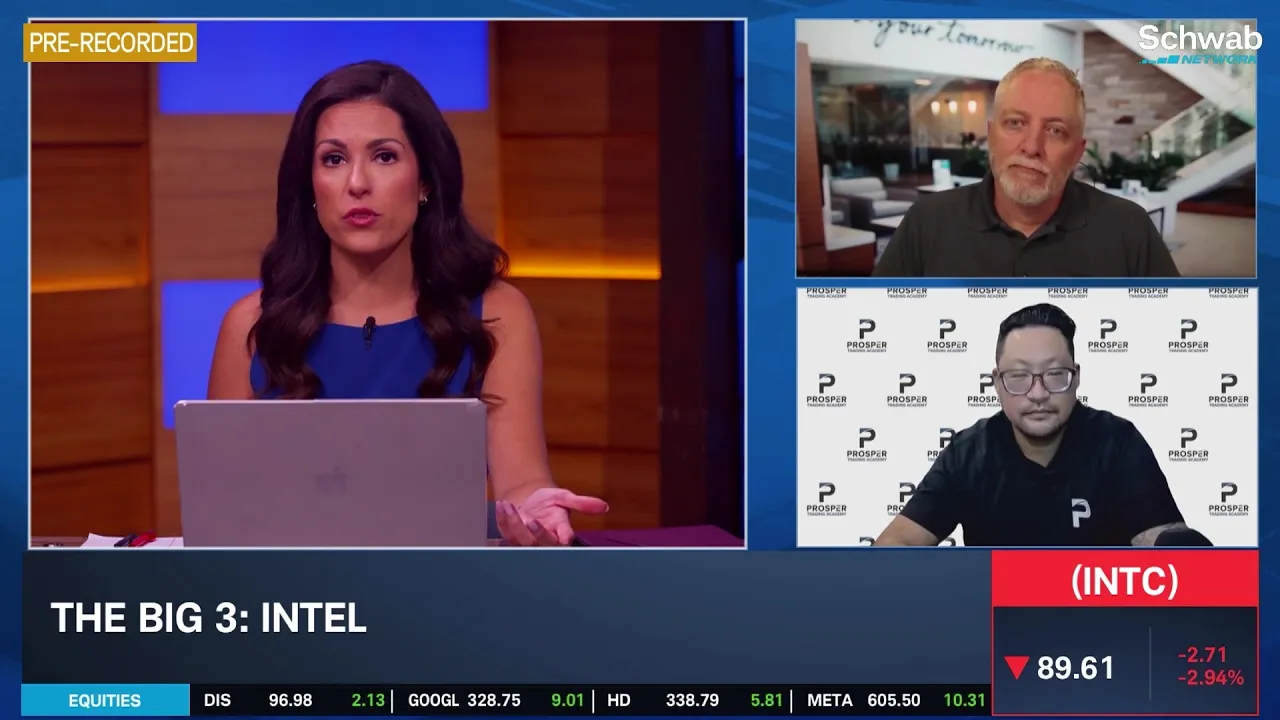
get your podcasts. Welcome back to trading 360. I'm Marley Kayden. It's time for the big three. We've got three stocks three charts and three trades for you. Kevin Horner taking us through the charts here to take us through the trades today. Charles Moon stock strategist at Prosper Trading Academy. Great to have you both on. Charles would love a big picture thought on on the action that we're seeing today. Nasdaq still holding out in the red. But the rest of the indices are trying to maintain some positive gains on the morning. Yeah. And that's kind of been the state of the market. You know the s p Dow Jones even the Russell all trading relatively close to their all time highs. The Nasdaq continues to break down a little bit lower getting dragged by. You know some of the hyperscalers most notably obviously the AI play right now. So you know today it was a bit of a relief rally. You know it showed to me that, you know the market really is embracing the idea that if negotiations happen, it's going to be a very broad rally. We saw the hyperscalers, we saw the SaaS plays and the AI plays all up in pre-market. And generally speaking, there's been a rotation back and forth within these sectors. When the market is bullish, we see a big rush to buy into the AI stocks. And when the market is fairly bearish for excuse me, fairly bearish, we kind of see a little bit of a relief rally or demand into the SaaS plays as people are seeking value. So you know, until we actually have real negotiations, it's going to be very difficult to kind of anticipate the market, especially the Nasdaq, in my opinion, having any sort of sustainable rally. All right. And then as we as we look to your big three here, you've got a name that's got earnings on Thursday here, a big name. You've got Apple. But an interesting pick here because we've had so many conversations about the AI spend and CapEx and the punishment. I was just talking to my last guest about alphabet Apple sort of a different part of this conversation because they're the one name that hasn't really been spending. So how are you approaching Apple right now? Charles. Yeah, I mean, this is a high risk trade. You know, I like the eight seven August 7th 350 strike at $4. I don't necessarily think they're going to blow out earnings. You know this is certainly going to be critical. The stock's going to be at $0.75. But ultimately obviously if they go down off of earnings you know this is always something that we have to expect when stocks are trading at all time highs. But if they if they you know present the idea that they're not going to spend I phone numbers are going to be truly good. And I believe they are because of Tim Cook's announcement. He basically came out and warned his entire client base that prices for iPhones and for iPads and MacBooks are going to go up a tremendous amount on their next release due to the cost of memory and something that they just couldn't absorb. So I believe that, you know, it's going to be bullish, neutral. I like the upside. I believe that the market continues lower. Apple is going to be the one that's going to be continue to pile in. So I'm setting that stock at around 75%. I think at $3 risk is very palatable. And again, if they do well, I think these options are going to knock on the door of $9 or higher. Again, you know, for me, Apple's just kind of waiting in the weeds, letting everybody else burn all this capital. And once they see, you know, who the true standout AI play is, that's when they're going to look to work a partnership deal. And or, you know, obviously look to spend then. All right. Kevin, so as we look at the setup coming into Apple's earnings here, I mean, a very different chart than some of these other mag seven names. What are you seeing in the technicals. Yeah it's interesting to hear Charles talk about them as a line lying in wait when they're trading at all time highs. I mean the thing that stands out on this chart has been the recent price action breaking through about 315 to the upside. Building a bull flag over the last week breaking it with Friday's price action. I mean it's been really incredible. The weekly look here really validates the the the technical analysis 101 concept of breakouts and throwbacks. We had this awesome break in mid early April, pardon me May. And we rallied up to about 315. We pulled back from there right back to that 280 level bounced off of it aggressively. And then we've seen four consecutive green candles here. And you'll notice down below that MacD in the highest level we've seen on this chart. So it's validating the breakout. So the interesting thing to me might be most notable though Mali on the daily chart here. And that's because values apply to Charles trade. And so as we as we look across there you know on the dailies there, Kevin, you know what's sticking out to you most in terms of the values as they apply to Charles's trade? Well, it's the break of this range. Basically what we're looking at was April through July, where through the end of June, really. And it was about a $4,445 range that we traded within. And if you're just casually applying the $45 range to the upper level from which we broke out. 315 it can give you that neighborhood of 355 to 360 for short term upside. Just if we realize the range breakout potential. So to me, the the trend is certainly strong. We're trading at all time highs. You've had a recent test of horizontal support and a trending moving average. That being the 20 day to day rising quite fast, utilized at or coming in at around 317 or so, giving traders a way to manage risk if you're long shares. But you know, from the trade standpoint, the small amount of risk we're talking about 3 to $4. Whether you choose to employ the stop order on the trade is certainly palatable for the opportunity that could be present. All right, Charles, let's jump to your next one here. It's another strong trend this time in the other direction though as I'm looking at the chart we're talking about Intel here. They had strong earnings but we saw them fall 8% in the wake of earnings. You know another another good number is not good enough situation much like we've seen with many of these names in the AI trade. How are you looking at Intel. Yeah. You know it just seems so far this earnings season. Any company that's even mentioning you know, a little uptick in CapEx expenditures just getting punished. We saw it initially with TSM. And that's kind of clued me in on, you know, how they're just viewing some of these AI plays TSM mentioned, you know, additional expenditures. Obviously, Google's raising their, you know, year end, you know, CapEx numbers. Tesla alluded to that same fact as well. And then Intel came out and said that they're going to raise it a bit this year, but substantially next year. Numbers were robust. I mean, the the data center numbers were really strong. You know, they basically hit numbers beyond where Wall Street was expecting. Everything on paper is something that you should like. But the mere mention of CapEx has really just punished Intel. And so for me, the downside opens up as near as $70 is a gap fill there. There's the 200 simple moving average. There's really not much technical support. Obviously the the AI play continues to work lower as the Nasdaq continues to slump. We just broke a key swing low. And this is where, you know, Intel doesn't really have much technical support, not much reference for buyers to jump in and and sellers to kind of take profits. So if the momentum continues, I like the August 7th 85 strike puts again, it's going to be right around $4. Same risk. It's going to be $0.75 or 75%. I just believe $3 in this, you know, high implied volatility environment just isn't that big a risk. And the payoff could be really, really good. These will trade easily at $9. And again, if it gets really, really ugly these will be trading at around $12. So you know for me until the markets you know, or until the United States and Iran actually get back to the negotiation table, establish some sort of MOU and really get back to trying to work out a deal. All of that is hearsay and the market is just reacting as such. And again, it's very negative for AI. All right. Kevin, so as we as we look at Intel here, are you seeing the potential in the charts for the momentum to continue to the downside. Yeah, I certainly am. And it all hinges on this week's action. The weekly chart is pretty interesting. We've seen this stock explode to the upside. You know traditionally you get an explosive move to the upside. You're not shocked to give some of it back on the daily or the weekly. Look here though what you're seeing is we're trading under the 20 week moving average this week as we start the action under $95. And the pullback has been really substantial from the peak from 140 approximately down to 90. So it's been an ugly break even on the weekly. Now that doesn't mean we couldn't hold up. But from a momentum basis Charles is certainly viewing this the same similar way that just about any trend trader would. A significant week on deck here for Intel if it can't hold this level for sure. And then as we look at the daily chart here and we zoom in a bit, I mean, what are you seeing for the setup here? Because as I highlighted, I mean we had another strong earnings report, but we also saw another sharp move to the downside following these numbers. That's just contributing to this downward trend. There's nothing less less appealing than a stock that shows good numbers and doesn't react favorably to it. The interesting thing on the daily, I think, is that we're we're really grasping at straws. If we're trying to find support at this ledge, it is a 50% retracement of the move. From late March to the peak we saw. And that could be a level of support, but it's just that it could be a level of support. Price action needs to dictate that. And I think Charles is right. We're seeing a trend trend to the downside here. We've got that 20 day crossing, the 50 day to the downside over the last week plus. That's provided a little bit of momentum move. And and like you said, there's just not a lot of support down here unless we are squinting our eyes. That doesn't necessarily help the trader, though. I think it makes more sense to pay attention to the overhanging resistance and the negativity that's been in play for the better part of the last 3 to 4 weeks. All right. And Charles, your last pick here is going to move us out of the AI trade and into the AI disruption fears with Salesforce. We're moving to software here. Salesforce having a great session so far today. As you already mentioned, we're seeing some of this rotation back into the software names, but up more than 6% today for CRM. So how are you approaching Salesforce? I mean, it's, it's almost as if we're putting all our eggs in one basket. But quite honestly, this is where I'm taking a little bit more of a passive approach. But that's the key factor here. If the AI play continues, lower these these, you know, software as a service plays become far more attractive. You know, we've seen names like Adobe and CRM bottom out and, you know, obviously now turn lower after earnings. But there's they're also performing pretty well. And again, if the AI continues down, I just feel like a lot of these stocks are just going to be forcibly pushed higher. Again, I'm not in love with the name, but I do believe in technical structure and price action. And the key level I'm watching is right around 175176. This is where the stock has struggled here over the last few weeks. It got knocked back off of this level, but we're rapidly approaching this price. And if we break through this level, there's this beautiful profit pocket where there's just a lot of open space to the upside. It's literally inverse to the Intel play, where there isn't much technical resistance until the 200 day simple moving average. And for me, I'm always focused on these key psychological levels. So it's the it's the laws of attraction. It's the laws of psychological resistance. And that's just where I could see the trajectory of this stock. If it breaks 176 for a run around $200. So I believe all of this could happen near term. Again, I'd like to keep things a little bit more tighter to the vest and not in a broader picture, because the broader picture is a little muddled. I'm looking at the August 14th 170 two half 180 call vertical. I like it for three and a quarter, $3.25 or lower. Don't need to risk as much, only 40%. For me. Again, this is going to be something where I'm looking for a sustainable hold above key levels and that early breakout. And again, if it does break, I believe that the upside could be nearly as high as $100 if it approaches or I'm sorry, 100% if it if it approaches that $200 marker, it's a lot of what ifs. It's obviously very conditional to the markets. But, you know, we're finally starting to see some demand really sustain in Adobe and CRM. And now it's starting to get very, very intriguing to the upside for me. All right, Kevin, so as we look at Salesforce, are you seeing a similar I know we're going to start with the broader, more muddy picture, as Charles called it. But as you look in at the technicals, are you also seeing a level of 175, 176 as being important here? Yes. Marley. I am. In fact, I think the chart once again supports Charles view here. There's a couple of key things playing out. What we notice here lower lows of late. Granted, the last two months or so, six weeks, let's call it. We've rallied off of that low, but we really have seen price action improving. Look at the MacD down below. We've got an improving upslope there as price was moving to the downside. And we're approaching the 20 week moving average as we speak right around 175. So that's in the same zone that Charles was mentioning. And the upside here looks to be to that 200 to 210 level 200 being prior recent resistance, horizontal resistance that is recent highs. And the Downsloping aggressively downsloping 50 week moving average. Today it's around 211. I put the number at 210 because we're so far below it. Another week off the table, we're going to see that moving average moving lower still probably coming into play near the 200 level. But that's excellent upside from a percentage basis, particularly if you are playing a long spread like Charles is considering here in this trade. And then as we look more focused in at the daily chart there, Kevin, what are you seeing there. Yeah. On the daily we are as you called out Marley making a great move today. We're up 6.25% through the 50 day moving average. 170 there, 175 being our goal, our target for the week. But you'll notice we're basically trading at the highs we have seen dating back to early June. And what we want to see is a follow through here. So day two tomorrow above the 50 day moving average would be a nice development as would a similar candle to today. So if we got a continuation move tomorrow, that would more or less validate the 50 day moving average as new support for us in trend, it does give us the opportunity to maybe rally into that 200 period moving average, the 200 day today at around 206. Well, we're still about $100 off of our 52 week highs. But as you just mentioned, we are getting closer to the highs that we saw back in late May and early June for Salesforce having a nice 6.5% pop to the upside, we're at 174.15 for this name. Really appreciate you both. Joining us today,

Comentários 0
Entre para participar da discussão.
EntrarAinda não há comentários. Seja o primeiro a compartilhar sua opinião!