Contexto
"Jimmy uh as well he says he does not think that the associated stocks in the semis related to uh this whole trade uh are even close to peaking... I agree with Adam on Micron."
Contexto
"Microsoft is up 39% in this recent run... I believe Microsoft can continue to run."
Transcrição Completa
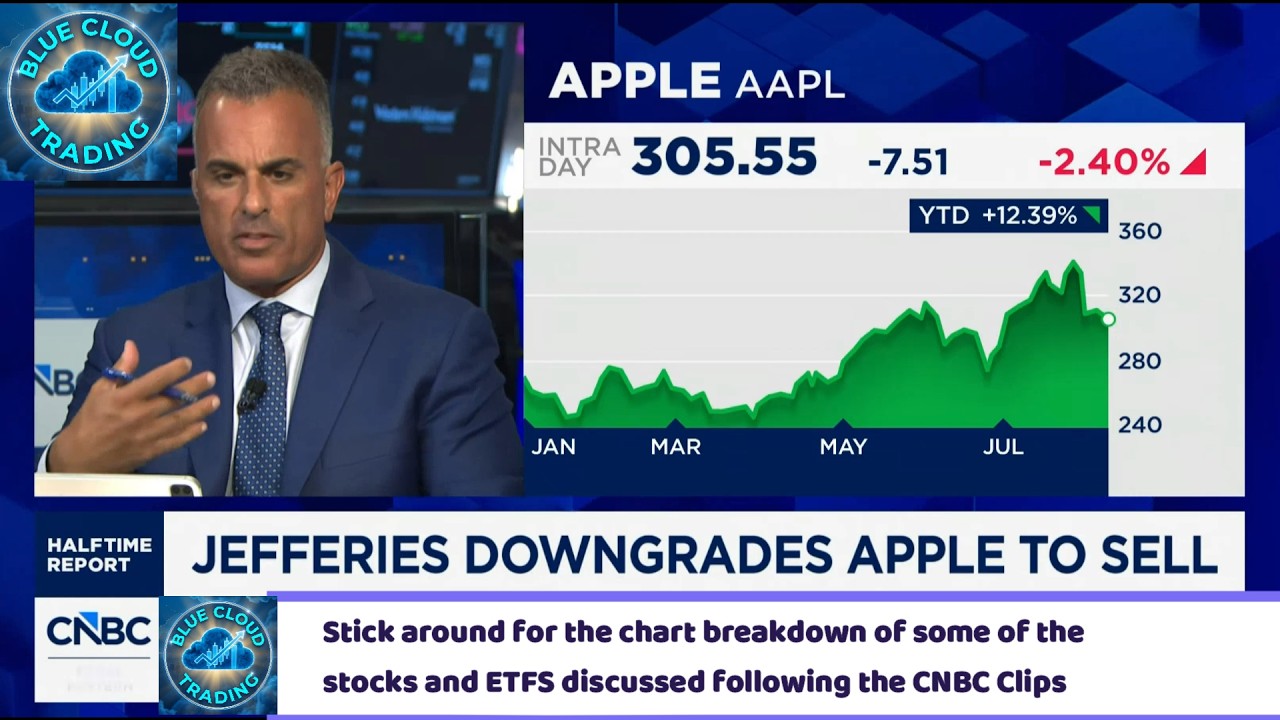
Blue cloud trading [singing] through the night. >> Welcome back to the channel everyone. [music] In just a second, I'm going to play a few CNBC clips from today's episode of the halftime report. I'm going to pull up the charts and dive into the technicals of some of the mentioned stocks. We're going to look at the key support, resistance levels, momentum, and see if the price action actually backs up what the talking heads are saying. Hit that like button. Subscribe if you haven't already and let's roll the tape on the first clip. >> All right guys, thanks so [music] much. Welcome to the halftime report. I'm Scott Walker front and center this hour. Higher targets for stocks. That is the story again today. More firms are joining the 8000 club and beyond. We'll tell you who's lifting their outlooks now. We'll trade a big Apple downgrade as well. Joining me for the hour today, Joe Teranova, Carrie Firestone, Anastasia Amaroso, and Jim Leventhal. Let's check the markets here. S&P is green. Everything else is red. So we are at record highs. We we have been we're coming off the best week since April. Those guys were just talking about CPI on Wednesday going to be a big event obviously with the Fed very much in focus. Oil's been higher. Yields are up a little bit. You have 522 on the 30-year. Keep an eye on that. We certainly are. And then the other numbers that matter. JP Morgan goes to 8,000 joining the club of what is a growing number of members. So there's your 30-year. So JPM's now at 8,000. Why earnings growth? U seemingly why everybody else continues to raise their targets too. Evercore today says the odds of a bull case to 9,000 are rising as well. >> Tony Pascarella of Goldman Sachs says both the fundamental backdrop and the technicals support a broader continuation of the bull trend. All that positioning's cleaner. Deleveraging happened. Gross leverage is down a bunch. Degrossing from hedge funds has taken place. So you got a cleaner outlook and that's one of the reasons why people are feeling pretty bullish across the board >> and it's steady as we go. Uh market continues to move higher built upon phenomenal earnings, historic earnings when you really go back and study the last seven quarters. 8,000 I think that's kind of a foregone collusion uh conclusion here. Kind of feels like it, right? >> Kind of feels like it. Here comes 9,000. I don't know, Scott. 10,000 by December of 2027. Why not? I think the market could get there uh if we continue to have this type of earnings growth. So, I really like a lot of the notes and and Tony Pascarella's note was excellent just talking about how we've seen positioning reshape itself. You've seen the deleveraging that allows you to rebuild once again in the bull market. I think that's what we're seeing in the moment. It's about alpha generation. What's interesting about today and and you know the uh the Jot ETF at the end of July went to 10% waiting for energy. Well, today we're getting rewarded for that. We're seeing a lot of capital flowing into energy today. If you look at the 11 Spider ETFs, energy is actually seeing the strongest volume today. So, the alpha generation opportunity might just be an energy in the near term because a lot of positioning stepped away from it. But overall, the market's in a good place. >> We haven't heard from you, Carrie, in in a minute. Um, so there's a lot of bullishness obviously because earnings have been really strong and the estimates are that it's going to remain very much the same way. Are you as bullish as >> the others are are now seemingly how they've gotten? >> Well, I I think that um it's great to be bullish right here. Uh we had that pullback in June, July. That could happen if we get the market up another five six% because people will talk about now the market's a little bit ahead of itself. But what but going for us right now is that we finished earnings season great numbers. I mean high double digits I mean in the 20% range. You've got more retail engagement. the retail uh buyer is the individuals are 25% of the market where they were 5% you know 25 years ago interest rates even if they make a rate even if there's one race still relatively low odds are there'll be no change in that um doesn't matter what happens to the war apparently the market doesn't seem to care enough and they assume it's going to be settled and you know I think that there is a belief that we're we're hearing more of it that the US equity market definitely has broadened out. We've got more participation. It is not just about seven to 10 names. You've got financials acting while healthc care is up 15% in the last 3 months. You've got industrials strong this year. Even if those can't drive a market higher because they're not big enough. There's enough momentum in them. The equal weight came off. It just came came off its best week since May. >> Correct. It's up 15% this year versus 133. There's your broader story. I mean, as long as the earning story remains intact, why change, you know, if if you were bullish, >> why change your stance as long as the earnings picture doesn't change? Unless you believe that the earnings picture itself is a bit of a bubble and then it only is eventually going to go one way and maybe sooner than people are expecting. I I don't know. You you tell me. >> I mean, I certainly don't believe that earnings is a bubble in aggregate. You know, if you look at the S&P 500, if you look at the small caps, if you look at the Bloomberg developed markets index, all of those earnings are picking up very nicely. And even though they are going to come off those peaks as we go into 2027, we're still going to be looking at 10, 12, 15% earnings growth. So, that is really quite solid. And Scott, the reason why I think this goes on is because uh there are what I call the three C's in the economy, which is corporates. Again, we talked about the strength there. the capex. We've had the best rebound in capital goods uh numbers going back to 2022 and we have the consumer that is also continuing to hang in there. So maybe you know the question is uh Scott to your point is what kind of ruins that and maybe it's the Fed that's probably the most plausible explanation that I could think about but I don't think the Fed will actually do that and you know we're waiting for those CPI numbers this week but here's one stat that I wanted to share. If you start to uh adjust for real-time real world data, for example, the Zillow uh rent inflation, the real time inflation, the core CPI would actually be about 1.6%. So, is that something that Fed share war is doing right now? And is that what going to be the numbers we're going to look at in September perhaps? So, I don't think the Fed actually spoils this. I feel like, you know, the market today is reflecting the fact of a wait and see for the CPI and, you know, we'll see what tomorrow brings. But again, Wednesday morning, we'll get that read and then we can move on and figure out what actually it means for the Jackson Hole speech later this month and then a September meeting when, you know, the the market still thinks there's a a reasonable chance of a of a hike perhaps, although on the back of the jobs report last week, maybe those have diminished too. Let's talk about Apple. Okay, let's show the chart because a rare event happened today. You just don't see it all that often that Apple gets a downgrade. This one was to underperform by Jeff. The target goes to 263 in change from 285 in change. They say, here's the commentary that has moved the analyst to downgrade the stock to what is essentially a sell call. Our supply chain checks suggest that the all glass iPhone supposed to come in September of 27 has been cancelled due to low yield. We view this as a major setback to efforts to bring the higher priced iPhones amid soaring memory costs. So if you're, you know, if you're paying more for memory, but you have a higher priced phone, obviously you can protect your margins a little bit better. And that seems to be one of the issues that they're hanging on as well. Apple just raised its trade-in value for iPhone by 5% about 2% in the US and Europe and potentially driving more pulled in demand for the iPhone 17. But more pressure on iPhone 18 sales. iPhone 19 Pro Max could move to 16 gigs of DRAM from 12, indicating still limited breakthrough in Apple intelligence. So Apple said to be testing Chinese memory chips. That's part of the story. There was another report out today that's making the rounds. A lot of people are talking about it that the cost of making the 18 Pro is up maybe 40%. So if you want to drive sales, you got to sacrifice margins potentially. All that is what people are thinking about today as this stock gets a rare downgrade to and underperform. One of only, I think, five in the universe of those who cover the stock and there are 51 in total. So five say bounce it. >> What do you think? Well, it's an aggressive call to go to sell. And for a taxable investor who's held this stock for any period of time, you have to really think that the stock would have to go down 25ish% if you're a federal tax player. More like 30 35% if you add in state taxes. So, that's kind of it's a big call. Now, that said, >> you went to sell >> I well >> on half your position. >> That's right. I did because and here's to the point that I generally agree with the thesis that the analyst is putting out here. And when the stock was at 330 going into earnings, I thought that it was a little frothy. And I can again I do think the analyst has a point here and it's more like kind of death by a dozen cuts if you will. There's margin pressure. We know the raw material inputs in terms of chips that are going in. The upgrades are kind of now listen to me. It's kind of met. I know everybody came out of worldwide developer conference saying, "Hey, Apple's got it. Apple's got the AI." I kind of felt like this was the third fourth year in a row where they promised something that yeah, I'll believe it when I see it. And I think the market's kind of waking up to that a little bit. So, let me let me summarize this by if you have an oversized position, I don't think it's too late to take some of that off. If you're a long-term holder and I've got shares that have a $15 cost basis, that's a pretty heavy lift for me to say to my clients, I'm going to give you a 25 to 35% tax bill, but maybe we'll get this at 200. I don't think that's gonna happen. That's inherent in the sell call. But the trim call for stock shares that I had at like 190, I was happy to do that. >> What do you want to do with this? Because you have been one of, if not the biggest advocate. You and Josh probably together have been the two biggest advocates on this program of this name. >> I've bought this stock six times. It's has moved higher uh since March. The stock has had a 26% run higher from its June 25th low at 273. So, I'm going to tell you what I'm seeing right now in front of us. What I'm seeing in front of us right now as it relates to momentum and positioning is that people are beginning to pair back their holdings concurrent to what Jimmy is saying. So, it is losing near-term momentum for sure. What does that mean? It means it is vulnerable for a deeper decline into what I see as the support of moving averages. I will take the other side of it when it gets there. I believe it will be a pause that refreshes based on the fundamentals as I see them and I will continue to add to the position because I believe over the long term this is the MAG 7 that is going to stand out above the others. But in the interim it is vulnerable to further downside. the the chart looks like the stock peaked at least for right now. >> There's a big there's a big gap but I'm also looking I'm also looking at what I do proprietarily as it relates to momentum what I see as it relates to positioning and without question the momentum on a daily basis continues to moderate significantly. Do you think the you have the stock too? Do do you think the valuation question has started to resonate a little bit louder because it's one of the it's it's not maybe not the only knock. Not dismissive of the AI questions obviously, but >> you do hear it a lot. >> Stock is historically, you know, more expensive than it's ever been. I don't know what is it now like is it 32 something like that? >> 33. >> Yeah, it was 33. It came down a little bit. Now I would say with Apple there are always fundamental issues whether it's about manufacturing or about chips about China about competition and those heat up the more expensive the stock gets on a PE basis. So when you're at 33 times earnings it's easier for people to use all of these arguments against it and the market to listen because of valuation and people move some if they're overweight. That means it's seven or 8% of their portfolio. That's a big chunk to weigh into Apple. So you reduce it to 5% or 4% and the stock may come down and then people will get on the bandwagon again which they do over time every single time it gets to be in the you know 23 times earnings. It's very cheap and then they load up again. So I you know I think this is a normal cycle and I don't have a problem holding the Apple because you know we don't have a 7% position. We just have a goodsized position. >> This is kind of a a typical pattern, isn't it? Stock is like on a on a beline higher. >> The company reports earnings and then there's some profit taking off of the beline exactly higher. Has anything really fundamentally changed since the earnings report? So, great point, and my answer is a solid no, but relative to where the stock went, I mean, I I'm not going to look as as I'm talking to the camera, but if we pulled up like a 20-year chart, we would see that that chart is pretty much straight from the lower left to the upper right. >> Just look at a one year. I mean, a one year looks even better than that. >> Well, I mean, that so that chart is showing the point that I'm trying to make. It has highs and lows even in that overall trend line. So, what Carrie and Joe are saying about there will be a time to add back what I took off. Absolutely. And I don't think it's $200 a share. And you know, if if I sold it at 330 and you know, if this got down to 270, boy, I'm back in. >> If you're going to say who has pricing power in that universe, does anybody have more fundamentals >> than they do? Well, the fundamentals are at least from a memory chip cost standpoint, the fundamentals have changed in that regard. They got to pay up. They're trying to figure out how to offset to at least protect as much margin as you can. That that's a fundamental issue, is it not? >> It is. If in fact your consumer is not willing to pay the price increases that you know are coming, >> we don't know whether they are or they're not. At what point do they bulk? I mean, history would suggest, okay, they they obviously have this incredible installed base. >> Uh but everybody's got a price, >> right? Everyone has a price, but I think given the economic climate you're in right now and how valuable the phone is to all of us, more valuable as others have said than your automobile, I would suspect that with strength in the economy, if they are ultimately going to be raising prices attributable to what we're seeing with memory challenges that the consumer will stay there and we'll continue what the subsidies look like too from the from the carriers. >> You you have to have a fundamental thesis surrounding what ultimately is going to happen. And I think you have to maintain a favorable one. >> Make this quick cuz I want to hear from Anastasia, but if you look at a long-term 10-year chart, a price to earnings multiple or PEG ratio, we're clearly at the top. Carrie, you were saying this 33 times forward earnings is simply too expensive. That's a place to trim if you don't have $15 cost basis stock. But if you get down to 25 times forward earnings, and I'd be surprised if you actually get that low, you add it. So you know 27 we start talking about the PEG ratio right now is 3.9 price to earnings over growth of earnings that's just it's just too high. It's a good it's a good I think mechanism to talk about tech which was the top sector last week up 7 and 12% almost 7 and a half% the week alone best since midappril what do you make of that trade right now >> I think you have to differentiate within parts of tech and I do want to comment on Apple just from a macro perspective look everybody is in the memory semiconductor trade and I think from a contrarian standpoint at some point you're going to resolve those bottlenecks at some point those average selling prices are going to come down not great for the stock prices of semiconductors but probably great for somebody like Apple. The other thing I would say, the market has been obsessed with free cash flow of the hyperscalers, but if you look at free cash flow of a stock like Apple, it is actually sizable. The yield is about 3 and a half%. So, it's actually better than some of the other ones. So, I think as a balance in your portfolio, it does make sense to have something like Apple to kind of compare and contrast with all the high beta uh semiconductor chips. But Scott, to your point, where I actually find the most value in the tech space right? right now is actually in those same hyperscalers because the credit markets are scrutinizing the free cash flow, the equity investors have been a little bit more cautious. But so guess what? There is capex, but then there's ROI on that AI capex as well. And I actually think when you project out the free cash flow, let's say a year or two years down the road, it is likely to inflect back into positive territory. So probably the biggest undervalued trade there right now. How about Nvidia? Okay, coming off a monster week up 11%. That was its best week since May of 25. Reiterated today by top sector pick at BFA. Um what do we think of this after that week that this stock woke up big time last week? It woke up. It is tracing out a similar pattern to which I identified in Apple several months ago. I think the stock is in the midst of a breakout. I think we are in a period right now because we have such favorable fundamental conditions. It is a good marketplace that you see investors and characterize investors however you want. Are they are investors like Jimmy who are looking at fundamentals and PE and PEG ratios or like myself they're looking at quantitative strategies the the Jane streets the citadels of the world. Everyone's hunting for alpha and new alpha opportunities. And what's interesting about technology is you're seeing new momentum building in Nvidia while the momentum is waning in Apple. >> Alphabet. What about Alphabet? So the the momentum is actually waning in Alphabet since the announcement last week. >> That's right. >> About losing the chief science officer, >> you know, it was the only one last week that was down. >> Yes. Yes. >> Right. So tech has this huge week. NASDAQ has this huge week. Alphabet is the only one that's down. Amazon barely did anything, but Alphabet was actually in the red on the the AI brain drain. >> So let me tell you what I do with that information personally. I look at that information. and I say, "Okay, I recognize I'm maintaining a position that's losing momentum. Is there something that I want to do with it personally to hedge against it?" The answer to that as it relates to Alphabet is no. Within technology itself, I want to be clear about this. The building momentum in the actual laggered component of technology is software and it continues. Do I trust it? No. It's coming back. I told you I don't trust I don't trust >> Microsoft, my friend. >> I don't trust it. I've said all along if you think software is coming back you buy private equity. I told you last week about Palunteer. >> Those have been going up too, >> right? I told you about Palunteer. I'm seeing right now this is a market that wants to hunt for the alpha in areas where you can identify an equity as a lagard and you see new momentum and in the technology space it's clearly in software. >> All right. So there's a lot there. Um number one on the software thing. >> So it was up 8 and a half% last week. Jonathan Kinsky says reports of software's death have been greatly exaggerated. Goldman today says we're at the beginning of a multi-arter fundamental inflection point >> over the last week. I told you what the index itself did. That's the IGV. Individual names within it. Palunteer's huge burst last week is is well known at this point. It was up more than 30%. Atlassian was up 40 plus. Service now is up 9 and a half. Snowflake 7 and a half. The cyber names like Crowdstrike and Palo Alto up six and 5% respectively. Uh Oracle was up three and a half% last week. Why aren't you a believer? I trust the move in cyber. I trust the move in Zoom communic uh communications which has the relationship with anthropic. We are on the cusp of having further IPOs whether it is from anthropic data bricks or open AI. I still think there is going to be significant disintermediation and disruption as it relates to these software companies to the degree to which I don't think reaches the levels of the software apocalypse that we all described earlier in the year. I don't think it gets to that level. But I'm not not just confident in buying these names right now and believing that over the next several quarters they are going to significantly outperform the return that I'm going to get where I am right now in semi semi-equipment and some of the max >> snow 52- week high crowd uh record high. Palo Alto uh was also at a record high today. So I mean that that's been an interesting story >> too. What do you think? Yeah, I I think the software names were oversold dramatically and that was first of all they were just on a technical basis. They got to a level that were undeniably attractive. Uh Microsoft is up 39% in this recent run. Uh people were talking about Microsoft is dead. No one's going to touch Microsoft. It all seemed crazy. >> Target today by the way goes to 660 from 647 at Bernstein outperform on Microsoft. >> We we'll get to the targets being too high. But the fact is, how do we live without Outlook? I mean, how do we live without our calendar? So, uh, I I'm a believer that Microsoft can continue to run. If you look at Google, it had a really big run from March to the recent high. Now, it's come back. People will get concerned, those salesman shares, then they'll start to buy. >> You know that that software has done well when we talk about it before we even get to semis. For the most part, we hit Nvidia. Uh, but we didn't even mention yet Taiwan semi sales up 45%. You own that name? >> Yeah, I mean it's incredible. I mean there is demand. We hear about it all the time. How much of it are we using? I mean think about what we're asking um whatever you know Claude Chachi every single day building models making charts. I mean I think it's ridiculous. It's my best friend. So I I believe that you you have to drive all this with chips. the chips come from TSL. >> So Adam Parker the other day was with me and said Micron's probably going to double from here. >> Wow. >> So he's super bullish that reiterated outperform by the way. Mazuo 1375 is the target. So I mean that's not so far off of you know the way AP's thinking about it. How about UBS? 1625. So that's that's right in that ballpark. Jimmy uh as well he says he does not think that the associated stocks in the semis related to uh this whole trade uh are even close to peaking. >> Yeah. Well that's the question is where are we in the cycle? I bought micron Scott as you know in two tranches uh not that long ago uh at the last earnings report and just after average price a thousand you see the stock at 877 right now. I got a lot of client clients saying, "Hey, why did you buy it at that price?" And the answer is because if the cycle is going to be elongated by years, which is what I think, then buying this stock at six times earnings, forward earnings, which is roughly what it is right now with those earnings growing through the roof and with the company about to anniversary the chips act after which it can start buying back shares at six times earnings. It's a great setup. Now, the bare case is that the AI trade is a bubble. the data centers are going to stop being built. The demand for Micron's chips and everybody's chips is going to plummet. I just don't believe that. I don't believe that when we see all the hyperscaler reports over the last two weeks that showed nothing but growth and growth increasing. So I agree with Adam on Micron. >> Last comment on chips Anastasia. >> I think the runway for them is not over but I do think the risks are building and eventually these bottlenecks will get resolved and I think the ultimate beneficiaries are actually those software stocks. So that's where I would be looking to rotate to. By the way, fundamentals of software are still intact today. Loans have rebounded and looking at earnings growth. It is running about 22%. So I would be slowly pivoting to software. >> Okay, we will take a break. See you in a couple hours. >> Farmer champ. >> My favorite energy stock that Joe doesn't own but may is Trans Ocean. >> Okay, >> it's five bucks. Maybe that's why he doesn't own it. Anastasia >> private markets. I think a lot of bad news are priced in, but earnings are moving high for portfolio companies. Fundraising is strong. >> I I swear we didn't confer on this. It's Blackstone, biggest in the private equity market, 16.9 on a roll. >> Twilio. >> Okay. Do you like that one? >> That [laughter] was funny. >> I'll see you. >> Hey everybody, welcome to Blue Cloud Trading. I'm George. It's Monday, August 10th. It's 5:43 p.m. Eastern time as I'm recording this video. The markets were down today a little bit. Uh the Dow was down.1%, NASDAQ was down.32, S&P 500 was down 06 and the Russell down was down 0.52% today. In this segment, what I'm going to do is go over a number of stocks that that were talked about on today's episode. We're going to actually review, let's see, about 23 23 items. And out of those 23, there's just six that actually met the criteria that I'm looking for personally from a technical perspective in stocks to actually consider to actually, you know, consider adding to the portfolio. Now, let's take a look uh at some other things that we're going to look at. We're going to look at the SPY, the Dow, the Russell, FEZ, which is the Euro stocks, the Q's, VIX, gold, and silver as well. So, let's go ahead and get started first with looking at the heat map. That's important. The heat map shows us uh the S&P 500 here and you can see the technology stocks did not do so well today. The majority of them were down as far as the semiconductors, right? But the software infrastructure stocks like Microsoft Oracle Palanteer P&W Crowd Strike, okay, Fordinet, those were up. Apple was down 1.62. Google was up.91. Amazon was up 1.31. Tesla was up 7. Bergkshire was up once again 1.46. 46. Look at the energy stocks. Okay, they're doing quite well because because there's some issues going on in the Middle East still there. Uh and that hasn't been uh resolved yet. Obviously, the healthcare stocks also did pretty well today. Utilities and real estate, not so much. Basic materials were mixed and the financials were also mixed. Okay, so let's go ahead and get into the stocks. We're going to start off with Crowd Strike. I like crabs, right? Check this one out. Um, what we're looking at here is a weekly chart. Okay, so we've got the weekly chart up here and we're using the Ichimoku indicator. If you're unfamiliar with this indicator, it's very simple. This is just five lines. You've got the nine period, they call that tenkinson. You get the 26 period, that's the keeunen. Suan A, that's suan B. That's what creates the Ichimoku cloud itself. of the sync span A and sync span B. That's derived by taking the midpoint of those two moving averages projecting it out 26 periods into the future. And the purple line is basically the midpoint of the last 52 periods projected into the future. These lines are are also taking taking the midpoint of the last nine periods for the green one and the midpoint of the last 26 periods for the red line. When I say midpoint, here's how it's calculated. They take the high of the candle, okay? They take the low, they divide that by two, and it's the absolute midpoint. A lot of times you'll see these moving a these moving averages actually flatten out because it's actually looking at that mid point of the candles. And so it can flatten out. There's one more line. It's called the Chico span. It's the lagging line that you're seeing right here. It's actually the current price projected 26 periods into the past. So, the creator wanted a way to to see where price is, okay, in relation to the candle 26 periods ago. If that white line is above the candle 26 period, that's actually bullish. So, we've got the faster moving average above the slower one, that's good. We've got the lagging line here above price. Synchan A is above Seno span B. That's exactly what we're looking for here. That's what that's how you can decipher that this is in fact a strong stock in a strong trend. Okay. Uh well, not necessarily a strong stock. It it will certainly tell you that the technicals are strong. Okay. Uh so the weekly chart looks great. I like the daily chart as well. You can see it broke out above that 21750 level this week. And so let's see if it's going to continue. Now I've got this secondary indicator. It's called directional movement index. I've got it at a faster setting of nine. The positive DI9, the negative DI9, and the ADX9, which is basically um put on on top of this, right? And what I'm looking for is that green line to be moving up, red line to be moving down, as you see here, and the ADX to be moving up. What the ADX represents is momentum is increasing to the upside. If the ADX is moving up, but the red line is above the green line, and I'll just show you an example of that. Let's go back in time, like right here. You can see how the ADX was moving up. The red line was above the green line. Well, that that tends to lead to a decline. And by the way, whenever price is under the cloud, that's bearish territory. You don't want to be adding positions. You can see basically very clearly what happened here when price got under the some of these moving averages. Sometimes they'll recover, but sometimes they don't. And so, you want to be buying into strength. Okay? You want to be That's my That's my strategy. I'm a breakout trader. Uh I don't believe in um you know, buying stocks on the way down because we don't know exactly when that decline is going to end. And so that then you're, you know, you it can put you in a world of hurt as you're holding that position. not necessarily for just a few weeks or months, but it could be years. All you got to do is go back go back to a a time. Uh let's look at Roku, for example. I'm just going to show you guys a quick little um example of what can happen sometimes when a stock goes out of favor and the bears take control of it. It can last quite a while. Here's a weekly chart of Roku. We can see the double top pattern that that was created here on the weekly chart, right? It broke under these lows here. It also broke right under that cloud. What happened? It dropped how long? Over a year. Okay. So, if we look here, it took I mean, we haven't even recovered back to these highs uh of $483 since then. And that was back in 2021. All right. The price right now is $151. So, look at all the years that have have gone by. And so yeah, you want to especially on, you know, you want to look at that weekly chart and the daily chart. Make your decisions based on both time frames. Always consult the weekly first, right? Because it's the higher time frame. It's the, you know, it's the one that's going to show you the long-term uh trend of the stock. Now, here's some good news for Roku, though. On the weekly chart, you can see once it broke above the cloud, right? It happened a couple of times. Those were false breakouts that didn't work out here. Didn't work out here, but now it seems to have taken um flight. So, you can see it broke through here, came down, retested the cloud, found support, and now it's off to the races for Roku. That's the weekly chart, and there's the daily. So, Roku is an interesting one. I like Roku, but they didn't talk about it on the show, but it's interesting how uh now all of a sudden it it makes sense again. Uh, and it's again it's based on the technicals of Ichimoku. So, let's go ahead and take a look at the next um stock. So, I like, like I said, I like Crowd Strike. That was up 5.01. Let's look at PENW, ticker symbol for Palo Alto Networks. That one broke through this box. You know, this box was created um back on um August 8th, last week. So, you know, basically what you want to do is um wait for that breakout. And that's what happened today. I think we're going to see um a continuation to the upside. Look at that ADX moving up. Look at the weekly chart confirming it all. Okay, we got let's look at Snowflake next. Snowflake also looks good. Here's the weekly chart. Okay, bullish cloud price above the moving averages. Everything looks good. ADX moving up and daily chart looks good. Okay, I like Snowflake. I like TWWLO, ticker symbol for Twilio Inc. broke through this 23848. By the way, that happened last week on Friday. It was a basically a spinning top, but it did close above that resistance level that went back all the way to those um back to June of 2026 over here. So, we could see that we broke that. Now, we're going to see hopefully we're going to see a continuation. Here's a weekly chart. All right. Everything looks good there. Do I like the technology sector? Well, it's starting to improve a little bit, but it's not as bullish as some of the other sectors that I discussed over the weekend when I went over the strongest sectors, strongest industries. And then I created a a nice uh watch list of stocks and ETFs for my members. Guys, if you want to become a member, it's really easy. You can do it right through YouTube, which is, you know, makes it so simple. You go to my channel here, BlueCloud Trading. All right? It's free to subscribe to the channel so that you get my videos whenever they pop up. But if you click the join button right here, okay, join this channel. This is how you can become a member. The membership perks uh under BlueCloud supporter, you can request a stock to be analyzed on an upcoming video. All right, it's only $4.99 a month. Under BlueCloud Trader for $24.99 a month. It's basically this is where you get access to those exclusive member only strategy videos that I do each weekend. And you'll be able to access all of them, past ones as well, not just the the current one that I just did. Um, BlueCloud Legend is the next level up at $49.99. And this under this level here, you'll also get daily trade updates like the one I posted earlier today. Uh today I posted it around noon and I shared my trades of the day as well as um yeah uh a new some new stock ideas that came up on my on my blue cloud proprietary scanner. So I do a daily scanner as well and then post the results of that so that my members have more options. Maybe they want to look at some of those that are popping up on the scanner. And so anyway, these are the memberships. Definitely look into that if you're interested. And then if you want to check out some of the other links, click on 10 more links here and then you can find uh the $25 coupon for the charting software that I use. Finn Viz Elite link, my Twitter page, all that stuff is right here. Okay, let's get back. Go, guys. So, Twilio looks good. Let's look at XLF financials. That's right. Up.36%. Here it is on the weekly chart. Holding up above that 5694. Here's the daily chart. Still looking strong. I like XLF. Okay. I like XLI, which is industrials. Now it did pull back a little bit today down.31%. But the technicals are still strong. Price here uh is still above the moving averages. They both have converged here tenken and keyunen the 9 and the 26 but price is still above it. The line the white line that she span is still above the closing price. So it did close above the closing price just barely. And then on the cloud itself we got a bullish cloud. We're above the 200. You look at the weekly chart that still looks very bullish as well. All right, guys. The rest of these folks, there's something off technically. All right. Uh, and if you sometimes u notice that there's not a stock or ETF that I'm that uh that's listed uh on this list that they may have discussed, it may be in my portfolio or it may be something I just decide not to analyze. But [clears throat] let's look at Apple. Let's take a look at Apple. Down 1.62%. Now, this is a weekly chart. It's currently under the 9 period. It's still overall a strong chart. If you look at the weekly here, it's not it's not a terrible looking chart. Um, but it's it's showing a little bit of weakness. Here's the daily chart. You can see it gapped under the moving averages here back on July 31st and it's been staying under. Okay. Uh, so we'll see if it can recover. Notice how the red line is also above the green line. So that gives you a little bit of a hint that you shouldn't be adding positions right now based on that. What about Adobe? Let's take a look at Adobe. I haven't looked at that stock for a while. Oo, interesting. Okay, so let's start off with the weekly though first. So, it's currently still in a embedded decline. Remember I showed you guys Roku earlier? It can last for years. Look at 20. We're talking about since 2024 over here, right? So, a couple of years now, it's been declining recently. These last uh since um June 26th, it's moved up. It's moved up about 40%. It's because it dropped so so much. It went from the highs back here of around 74 20 I'm sorry $720 per share right back in 2021 down to just 272 and uh but it's still not something I would consider because it's under the cloud it's under the 200 on the weekly on the daily yes it's starting to show some strength but look at it it's stalling right at the 200 day on the daily chart as well so not something I personally would consider BX is Blackstone on the daily looks good right it's breaking above broke above the 200 moving up nicely but what does it look like on the weekly chart still under the cloud all right we do have a higher low we broke above this level here so it's starting to look more interesting for Blackstone and the financial services sector is still strong what about Google was up 91% here's the weekly chart price is still holding above the 9 period the 26th jig spin is above price everything looks good on the weekly what about the daily not there yet we're still inside the cloud. So you also don't want to be adding positions when price is inside the cloud. IGV on the daily looks good. It's above the cloud. Everything is looking bullish with the future cloud as well. See how that synchronous span A crossed above the same span B. What about the weekly? Okay. Well, the everything looks okay except for one thing and that's the cloud itself has not turned bullish yet, but that can sometimes take a little while. Uh if you also take a look, we're still we still haven't taken out this high. So I think that when that happens, uh that's when you'll see price probably continue to the upside. But right now, we haven't it hasn't proven itself quite yet. It's improving for sure, though. And we saw the we saw that in the performance of the software stocks. Uh Microsoft also looking pretty good on the weekly chart except for the bearish cloud still, but everything else looks good on the weekly. on the daily chart, everything looks perfect here as far as um the the indicator. Okay, it's the only thing I would say is it's kind of moved up uh a bit ahead of itself. Look how far the distance is from of price versus the moving averages. Quite a distance. So, there is a higher probability that's going to pull back, maybe create a smaller like a a short little leg before maybe continuing to the upside. So, we'll [snorts] see what happens with Microsoft. Uh Micron is still in a decline. And you can see it's in a downward channel they call that. All right, that's a downward channel there and it's inside the cloud. No on micron service now breaking above on the daily chart above the 200 for two days in a row. The cloud is about to turn bullish here on the daily. But what does the weekly look like still under that cloud and it also looks like an inverse head and shoulders pattern which is a bullish one. There's the head. There's a shoulder. There's another shoulder right there. If it can break above that line right there, I think boom gets above that cloud. Yes. But right now, we're still also still under the 200 day. What about Nvidia? Nvidia on the weekly chart is holding up above the moving averages. I like Nvidia on the weekly overall, but on the daily chart, the cloud is still bearish. That's the only negative actually. That's the only negative here. Um, you know, I'm also mentioned this downward channel and I mentioned this trend line not long ago, right? I created that back on July 9th. And so um I said that hey you know when sometimes when price breaks through it may come back retest that trend line. Look at where it stopped right on that trend line. Will it bounce tomorrow or will it re-enter the the downward channel tomorrow is going to be significant. It was down 2.87% today. Let's find out. I wouldn't be shorting it here. I'd want to wait to see what what's going to happen uh with Nvidia. U Palunteer. Let's look at the weekly chart. Here's the weekly. It's above the cloud, but the cloud, the future cloud is bearish on the weekly. Okay. And on the daily chart, it's okay. Everything looks good in the daily minus the fact that it's far away from the moving averages. PSP, which is Invesco Private Equity Portfolio ETF, is another uh it's an ETF that they brought up on the show. Here's the weekly chart. It's under the cloud. So, no on that one. RIG Trans Ocean is under the the 26 period, but it's showing some strength. it kind of broke this little um short lived um consolidation box. So, we'll see if that anything happens from there. That's a weekly chart, but I wouldn't be adding here. Okay. SMH uh still in a downward channel here on the weekly and it's under the TW the 9 period right there. So, I'd hold off on that. Notice the red line above the green line as well. And again, this is the semiconductor ETF SMH team. Let's take Oops, my bad. There we go. Team has been showing a lot of strength recently, right? We have a higher low here. We So, we also broke through this prior high right here. That's very conducive to a continuation, right? That's called an ascending triangle pattern, guys. Ascending triangle pattern. Look that one up. It's a bullish pattern. And so now, where is it going to find resistance? Right there at that 200. It's got the cloud itself. How far does it have to move above it? It's a big move. It needs to move literally about 18.9% just to break through that cloud. It's a big it's it's moving in that direction. So, that's positive. You can see the ADX is looking good here. But, um again, I I tend to not want to add positions when I see stock um the the stock, you know, coming close to resistance levels. Here's a daily chart. The big gap up here. The daily looks very bullish. If you want to trade this in the daily, you certainly can. It looks good, but it is um far away from the moving averages once again. Okay. TSM is the Taiwan Semiconductor Manufacturing Company Limited. Now, this one here is under the cloud. I'd say no on that. It's Chico Span is under price. The cloud is bearish. The faster moving average is under this lower one. The only positive is that price is above the 200 day. That's it. XLE broke through this trend line. That's the energy ETF. Okay. Um, so there's the high there and the other second high that created the trend line itself. It stayed under here, stayed under here, touched it there and dropped. And this was the first day where it broke through. And you can see the directional movement index is turning bullish here with XLE. Here's the weekly chart. Okay. So, I like I'm starting to like it. The only negative again and why it doesn't get a blue flag is because the faster moving average is still under the slower one on the weekly chart. XLK on the weekly looks great. Technology faster moving average is above the slower. The green is above the red. Price is above the cloud. Chica span is above price. Uh on the daily chart, it's uh holding right about did it close back under just briefly under that trend line maybe. But it's above the tenkinson. So, the daily chart, I'm sorry, that's a 4 hour, folks. I accidentally hit the 4 hour. Let me put it back to daily. There we go. All right. So, it looks like it's right on the on the top of the cloud. Um, you know, we still have a bearish cloud here on the daily for technology. All right, let's take a look at the indices. Let's start off with the SPY ETF. Here it is on the daily chart. It's above the box right now. It's still moving up. It's consolidating a little bit, building a base. Weekly chart looks good still. Okay. Um, we're not seeing crazy moves here in the markets, right? We're just kind of everything is still sort of on hold. The very measured moves up and just a lot of uh there because there's so much indecision still, you know. Let's take a look at the Dow DIA ETF. It looks great here on the weekly. still nice strong momentum on the weekly on the daily chart. You know, just kind of sideways actions right now. Um, it does get a blue flag though. And the Russell 2000 does as well, even though it's still in a consolidation stage. Still inside this long extended box. All right, this is what I'm talking about. We're not seeing huge moves now to the upside yet. Once we break through, the momentum might change, but look at the momentum right now. See that ADX is dropping? See that right there? So when that's dropping, it tells us, okay, well there's it's just uh you know, nothing really happening. It's just sideways action. And then what about FEZ, the Euro stocks? Well, this one looks, you know, the momentum is increasing to the upside, but uh it's starting to turn over just a little bit. You can see the the price here is starting to like slowly kind of curve and uh we'll see if maybe it will come down, retest this 7052 and then from there take off possibly. That's the daily chart. Here's the weekly. All right, so we broke through that 7052 level which was based on the high of that candle right there. U I you know overall I like the Euro stocks 50. Now QQQ on the weekly chart, okay, it's not bad. You know, it's it broke back above the tenants in last week on the daily chart. However, we still have a bearish future cloud. So, that's interesting how we can observe the future cloud and get some more input about potential future direction, right? We're also still under this trend line here, right? So, that's another thing that to keep in mind. And the ADX here is dropping still, which means it's just taking a break. All right, let's see what else we got. We got the VIX, which was up 3.42%, moved up slightly, not not a whole lot. It's still a very reasonable level of 15.46, uh, which is conducive to a strong market. Gold GLD still moving up. Like I said, it broke the box not long ago, maybe. What day was that? That was back on Wednesday, August 5th. And since that point, it's moved up in about uh 4.3% or so. Silver also did the same, right? And it's moved up a little over 5.4% and it's going to probably find some resistance maybe at this 6037 based on this prior low. But um it's it's moving in the right direction. That's what we want to see. Folks, I hope you all had a good weekend and uh I'm enjoying a beautiful area right now. I'm in Cape Cod, Massachusetts and um it's beautiful weather today. Anyway, I will catch you all in the next video. [music] The ichimoku guiding light. Blue [music] cloud [singing] traing through the night. >> [music]

Comentários 0
Entre para participar da discussão.
EntrarAinda não há comentários. Seja o primeiro a compartilhar sua opinião!