Contexto
"Let's take the latter for something like, Bank of New York. Now, it's a very steady business trust. Right. And custody bank. But that's an orderly stay long be like..."
Contexto
"Unpopular opinion chart that you hate right now. Tesla."
Transcrição Completa
We focused
a lot on the fundamentals lately. So let's take a look at the charts
with Carter Werth, CEO and founder of Werth Charting. Carter,
great to have you here at The Desk. Thank you for having me here at the desk. All right, so let's get into the charts. We have the S&P 500 hovering
near a record high. And on the surface,
the market looks pretty calm. But you look under the surface right
when you look under it. What do you see? All sorts of opportunities.
But let maybe let's start with the market. And then we can go underneath the
sequencing of a pretty important sell off. We sold off January to the March
30th low due to news. I guess you'd call us around. And then we had an incredible
April May rally, 20% in the S&P 30 in the night,
and we've been dead flat since. Yes, we made a slight new high,
but that sequence of of an important 10% selloff,
a ricochet that recouped all the loss. And then you trade in a tight range. The temptation is to think
that it's going to have a big next directional move,
the quiet, tight range that we're in. It's the tightest. We've been about five and a half,
6% range. There's only been 5 or 6 other instances
that are this tight over a two, two and a half month period
going back to 1950. So this is a very quiescent
despite under the surface, to your question,
a lot of volatility at the stock level. The aggregate the S&P 500 is quite dull. Has no character. And I think that continues continues. So what breaks us out of a quiet
tight range. Does that mean that as we think about where the market goes
from here, we continue going nowhere. Well, so. And that's interesting. Even though under the surface
it's hyper rotation. So it's highly volatile. But there's no there's no real variance
that's that's in. So think about the volatility that we've seen on semi's coming off 3040
in some cases 50%. And yet it's coming to the fore
to shore up the market because it's just punching air
as has been banks. Right. Broker dealers
like Goldman Sachs and Morgan Stanley or deep sort of out of the money
struggling software coming to life. And so we're industrials or health care,
which is at a 15 year relative lower. The S&P has been a real favorably. And so this hyper rotation is this. Well, and it's the human condition. Let's play semis when they're gross. Oh now the crash oil went from 50 to 120
a barrel and then it crash gold was love. Now you can't get anybody
talk about precious metals drops 34. So hyper rotation asset class wise bitcoin what have you or mag seven
it doesn't matter. And yet the or whole the S&P the aggregate is flat
and I think you're going to see more. The temptation is always look
for direction. Sometimes it's directionless at at the macro level rates
don't seem to move. The market right is higher for longer
has disappeared from the vernacular. You don't hear it anymore. And yet we've never crossed over
5% of the ten year yield. Not once. One time intraday was October 23rd, 2023. Almost three years ago we got slightly above 5% and here we are three years later. Still flat when an index is flat. But we're seeing some of these individual stocks
or even sectors making these huge moves. What does that tell you
about the health of the market then? Well to some extent the market is almost
irrelevant is I would say,
and there's an old sort of off you sort of overused phrase,
you know, a stock pickers market. People use that for a reason.
This is what that is, right? Where correlations are sort of low
right in the highest correlations. When you know, stock market crashes,
everything goes to one, right? Everybody sells everything right. But right now correlations are low. And so that is a real opportunity
to either find great winners or to mess it up okay. So talk to us about how you're finding
some of these great winners, given some of the sell offs
that we've been seeing, but then also the fact that, sure,
maybe you don't necessarily think that it means we'll move
higher from. Here, right? So if you think about, of all the factors
that have ever been tested, relative strength, momentum,
these are the most, sort of efficacious. They come back in all test through time
as, as the ones to favor and so on, a week over week,
month over month basis. What is exhibiting good relative strength
in a period where the equity market is dead flat? Well, there's certain industrials
that have been real laggards that are excellent here, showing
all the characters that I look for, for, introducing
starting along or having too long. So for instance 3 a.m. a fantastic instance or Boeing that's
just a name to and that kind of thing. There's opportunities with in health care
obviously biotechs sort of through
the roof has been very strong. But they're laggards like Russell Myer
just starting to carve out a bottom slowly, gradually deliberately bottoming
curing healing after a lot of pain. We have seen software names
rebounding as well. They're well off their lows but still
a very beaten down area of the market. Do you think that the worst is behind us on that front
and where are the opportunities there? If so, sure. So if you look at the let's
take Microsoft, right. The biggest of all Microsoft
has just undergone one of its. There's only one other instance in the history of the stock that it had,
30% move in about 2 or 3 weeks. And that happened at fairly precise
intermediate lows in 52, a close that sets the low by my work for Microsoft,
which in turn add Palantir into that. It's right. That sets the lows. I think the lows are good lows. So this move off of those lows,
you can use iGTV or some other aggregate
to measure, software. But the question is, do they have a lot of upside after this
fairly impetuous, impulsive bounce, i.e. Microsoft is one of the biggest bounces
in the record on a short term basis. What I would look for within
software are laggards. Things like, Rover, for instance. Fantastic gradual bearish
to bullish reversal. Similar to the circumstance
where industrials are making new highs for things like Boeing
and three, are coming to life. How do you know if the comeback is real
though versus a head fake? You can't. Nobody does. That's I mean, you know,
this is not annuities work right. Got to got an eight year bets
and then live with them. But if a stock is down 20% from its highs, how do you tell the difference
between a bargain and a broken. Sure. And that's again we're looking for
that sequence of a protracted decline that then stock starts to stop going down,
which is what basing is all about. And then starts to exhibit week over week,
relative strength. That's impressive. But again,
valuation is nothing to do with that because that's one of the worst
timing tools there is. Right. We know and that there is a 100%
correlation between earnings per share and price per share on a long term
basis three years, five years, 20 years. But there's no relationship at all. Three months, six months, 12 months. Hence, the semiconductor can go up three x
and then drop 50%. Well, their earnings didn't do that right. There is no relationship
between earnings and share price this month, next month, three, six,
nine months. But on the flip side
then when a stock hits new highs, is that something an investor should fear
or that they should buy into? It's both. It depends on the circumstance. Is it parabolic or is it a gradual,
orderly, 45 degree higher. Higher. Ever higher. North by northeast. Gentle. You respect that. That is, intact. Uptrend. Stay long, be long. But something that gets parabolic
where it starts to almost, well look like a straight up line. It's not in a chart. It's not going off to the right each day. You you you shy away from that. Now can you time up. We all try. But look what happened to the cost. Me
again. Look, we have the semis in general. Look what happened to gold.
Look what happened. Oil. Look what happened to Bitcoin. When things get, over embraced, over love, it's
usually right to take the road. Less travel. Give us an example of a chart
that has gone parabolic that you would stay away from,
and an example of one that has, you know, been this orderly increase
that you still think is sure. Let's take the latter for something like,
Bank of New York. Now, it's a very steady business
trust. Right. And custody bank. But that's an orderly stay long be like
my, my work, so might say different. Almost all the parabolic stocks,
have already succumbed, so there's nothing
that's quite still parabolic. Maybe maybe del
it might, reduce that if one had del that hasn't really come in at all. And it's quite extended. We've seen some huge moves in names like
Amazon and Microsoft recently actually. You take a look at those charts,
which I can bring up right now, but you actually see that huge gap
like where that's actually jumped. Do you chase that momentum
or do you wait for it to come back to you? So if you think about
what causes a gap, right. And so here we are in the floor
of the New York Stock Exchange. It would be that the specialist would be. 934 942. They hadn't open the stock.
They couldn't match the book. Now we don't get delayed. Opens right
right away. The computers match it and you gap up
4%, 6%, whatever it might be. On the first day of a gap up, it's always
it's always news related. FDA approval could be 40% earnings
beat could be ten. But typically after you gap up
it's a rerating based on fundamentals. Right. Something good has been said. And there's momentum drift. But we're past that now with Microsoft. We've had the initial gap
and then we've had a second gap. So you don't have price discovery
after one day of a gap or 2 or 3 even. But after 15, 18, 20 sessions,
you do have price discovery. For instance, we would fade Microsoft
here, fairly aggressively. Because. Because again, we've had price
growth gaps up. Why new news. It gaps up
because the denominator changed. They reported good results. And what happens is it's now cheaper. People rush into the stock. What we that wasn't a day ago.
That wasn't four days ago. That's 1618 days ago. You again have price coverage. People have had a chance
now to exit shorts to embrace new. Long as the committee has met, we should
probably put some Microsoft into the. Once you've had enough shares change hands that it's now at a level where again,
we would fade it, pretty aggressively. Would you fade Amazon or would you add. I'd add to Amazon. Amazon's line is extended. I mean it's it's a totally different
circumstance on a chart okay. So for the everyday retail investor
who might be tuning in right here, and this sounds a lot like trading to me
and I'm a buy and hold kind of person. What's the takeaway
for them as they think about what opportunities to add to here
where the market goes from here? Right. And, well, I mean, if you're if you're
a trader, it's to trade the first. The first thing I would say,
and it's the only thing really to say, is you have to know who you are
in the market. If you trade for an hour or two,
then don't ever get off that right. If you're buying hold, don't get off that. Stick with your with your knitting. As the expression goes, stay in your lane. But that's where it goes wrong. If if you're playing for intermediate
moves 2 to 3, 2 to 4 month moves, which were, I believe,
real alphas generated, then stick to that. Don't if it goes wrong,
you know, be disciplined with the stop. Don't.
If it goes well, I think I'll stay longer. Stay, stay, stay the course. Trust your process,
but don't change your process. I should note this is not
an ETF spotlight, but you do have an ETF. And I want to mention the worth ETF w r t
h. It's basically built for this kind of market
that we've been talking about right. The big moves in individual stocks
constant rotation and volatility. Tell us how does your strategy actually
take advantage of that. Right.
So it's a fairly straightforward approach. We sell premium. We're in the business
of selling out of the money calls and out of the money
puts strangling a stock. The risks with that is one can say
well your naked stock could $100. Stock as an example could go to 150. You sold the 120 calls
and the 80 puts were waiting for decay. We're waiting to stay in a range
for a very short period of time. But the we mitigate the risk of a runaway is that we do it
after companies reported earnings. That's very important. The biggest one day mover of stocks
outside force measure something that's out of nowhere. The chairman's been indicted or my gosh,
the FDA approval did not come through. And it's all it is that but an individual
operating business and industrial financial healthcare stock the biggest one day movers earnings
earnings are very hard to predict. That's why we get the gaps right.
So that's particularly poor at it. So if you only sell after a stock is gapped up or gapped down by 10% or more and then play for vol crush. This eliminates
the risk of having an earnings surprise. Then they can call put. And if you do it enough out of the money
10% or more. After a 10% move,
you need a lot of momentum. You have to make
that wrong on either side. And so we're in the vol crush business. We we sell premium and we wait for decay. We wait, we sell bananas, we don't own. And then we wait for the spots
to start to appear. And then all of a sudden
the bananas are black. Worthless. That's what we. Want. What names are on your radar
as we think about the the companies that still are yet
to report earnings this season? Well, obviously Nvidia is a big one. That's a good one. And so for instance, the temptation is
and this is to say well we think who's way well this great team of PhDs
in neuroscience is the number one I rank. We think that Nvidia is going to be good. That's and we're recommending it to you
or someone a trader the better play a lot of astute sort of meta
neutral dollar neutral long short funds don't do the earnings gap
because they know how bad it could be. If you get it wrong. It's
just sometimes a coin flip. Wait for the movie Nvidia down or up
and then strangle it. But last. Week versus Pro. Well it's
what it's doing is it's taking advantage of after something is rerated. Both bulls and bears
believe even more in what they. So that hundred dollar stock
that drops to 80 the bull say this is this is way overdone. I got a buy I got it, I got buy the dip and the bear
say we've been waiting for this. It's not down from 180. It's going a 40. So you get there's still premium out
of the money calls out of the money puts. And then we're waiting for vol crush. I would point out that of course,
we know that 75% of all short term out of the money options
expire worthless. And that's without regard
for how much out of the money if you put it out more than 10% either
side and add other criteria, no bio difference, you can move those odds into the low 90%
that you will get expiration. So basically,
you don't have a list that you can give us or consumers you're expecting. Oh, well,
when you're talking about earnings, we will be very much
looking forward to strangling. And very if we get a big enough
move up or down, we don't care about that. And so in that sense, if you think about
any investment that anyone has ever come to anyone with, hey, invest
in this play on Broadway as an angel, do this real estate
deal, buy this, not go into this one. They're saying
we think we know the direction. This place is worth more. This bar is going to be worth more. This real estate venture. We're saying we don't
care about direction after a stock or most assets have been rerated
aggressively higher or lower in a short period of time,
they consolidate. Think about our natural lineage. Right. It's after exerting yourself in the gym. What do you do? You know, you're
just exerting yourself in the library. Six sometimes you stay there. Your eyes, you got to take a rest. You walk around. But we play that quieter. So it's one of the rare moments
where we're saying, we're betting that this will go sideways. No one does that. They are betting by it here. It'll go up, sell it here, it'll go down. We're saying it just did a big up or down. It's likely to be quiescent
for the next 1520 sessions. So you don't care
about the market direction. But I'm still I'm going to pin you down
and try to get a sense of where you think this market's going. Yeah. Just in terms of when you take a step back
and look at the broader S&P 500 and take a look at that
chart, is S&P 8000 likely by year end? You know, that's very small.
Those are small numbers right? I mean I think the and not to not express
but this is the way to answer the question is that the principle
is the parts compose the whole. The whole comprises the parts. We study the whole by figuring out
the parts. Let's start with the biggest part
of all semi's, if you can figure that out, or then tech in general,
that's 30% of the whole the S&P. So semi's, after a sequence of a great run
up to three years and then a crash of sorts, we think that will be very arrangement. In fact, we would go so far to say that
we think the highs are in for the year in service. So a lot of people are playing for big up, and a lot of they're saying
this is just the beginning. Where do you see what happens. So there's unimportant service. We don't think, semis are a place to be. Right. And think of it that we think
software has already bounced so much. Now that's now it comes 30% of the market
right there. Right, because of tech. So the question is,
do you go all the way to underweight tech all towards
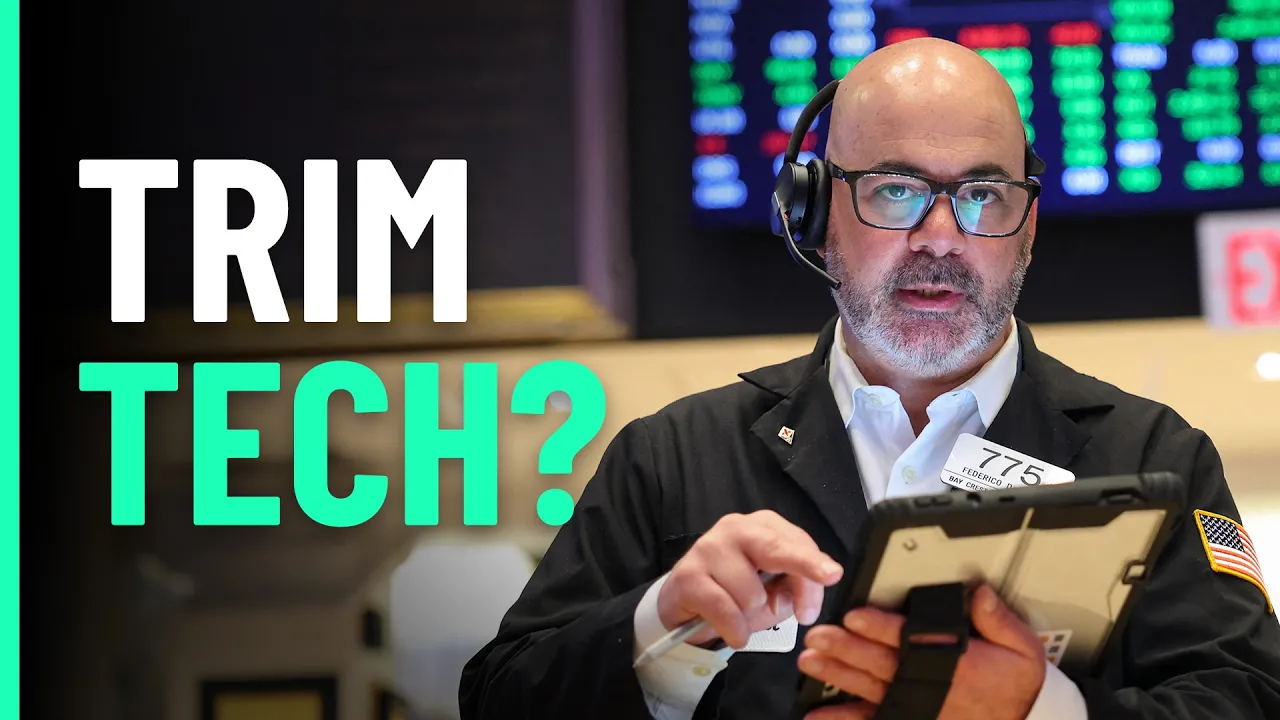
getting to the answer for the market. We think you underweight tech. Well between now and the end of the year. And overweight industrials for instance overweight health care and so and then how does that all net
out of the market. One say well you're underweight
tank and tech's 30%. Are you saying the market's
kind of dead. Fine. We think again that you're not looking at
great big runaway moves from here for the S&P. And that it's asymmetrical. There's more downside
risk than there is upside potential. So between now and you're. So underweight in tech overweight
industrials and healthcare. Yeah. What about some of the other. What about energy for example. Still the best performing overweight here. So that was a huge winner right. Outperforming everything. And we know why energy was dead flat
for almost four years. If you look at the XLE for instance. And then it had a one of its
biggest breakout type moves on record, then we get a major give back. But notice how well the stocks are acting
even as oil has come in. We think there's great value,
not from a value point of view. Couldn't just be valuation, but there's great value in owning energy
as overweight. Okay. What else would you underweight here? Like staples? I just think there's low energy there. They're always sort of dull,
but they have, Well, here's another way to look at it. If you look at the relationship between the Russell 1000 value versus
the Russell 1000 growth value is from the March 31st all equities global
low on March 30th right here in the US. And then the run up cents
and the RV Russell 1000 value. And RL you either have the same percent
gain since the March 30th long. And yet the beta of Russell 1000 values 0.71. The beta of Russell 1000 growth is 1.3. So if you do the same performance and your beta is almost half of the other
on a risk adjusted basis, you're up almost double
the performance of the latter. So value is very, very stretched. Now what can say
give you like energy within value. Yes. But we don't like staples versus small caps. International fine small caps. So it's still a diversified approach. Oh it's not. Yeah. Tech finally just to wrap it up
and then we'll get to our rapid fire rounds, you know, for, for our viewers
who might be sitting in the S&P 500, you know, who might just have broad
index exposure, who say, wait a minute,
tech's not going to go anywhere. What does that mean for the S&P? Obviously it's a big part of that. What's what's the takeaway for that for. Them is the way you started. The people that are sitting in it,
they're buying hold anyway. So just keep sitting. Because eventually it will go up. Markets go up 775% of the time. There are more razors being consumed
in the future than more babies. Yeah, the broad thrust of success
of humanity, of America, of the S&P. Sure. But if they're just sitting in,
it keeps sitting. And what would make
you overweight tech again? That's interesting. It would be the semis truly putting
in a bottom that's enduring right now. After that run up in that collapse, they look to be sort of dull here
like Grangemouth and not making new lows. And then a pulling in
and some of the overdone some to, to fall within within software. But once they've shot the moon
like match up pulling in and the ones that are still coming to life
that are sort of developmental open, starting to continue to improve. What's a tech chart that still looks
strong to you that might buck that? The sideways trend. You mean up and well, again, if you had to
be bias, you had to be directional. I think it video, which is at a four year
relative low or something like that. The software at the same is at the peak. I think you play that long. If you want to be directional,
we would prefer to wait for the play right and strangle. Okay. All right. A good time to pivot to our rapid fire
round of this or that. This is your first time playing. Quick questions quick answers. No hedging. You ready. I don't. Go all right. Here we go. Rally healthy or
unstable. The current rally I would say I'll put it on stable
category. Volatility opportunity or warning. Always an opportunity
because of long short. Market leadership broadening or narrowing. It has brought. Stretched winners
keep running or come back to earth. They've already all come back to Earth. One name that's still overstretched. No one that's run far
that you've still bet on. Back in New York, the NY. Tech firm here software semis. Software. But really neither
because they're really great. We should say, Oracle, Adobe
or Salesforce. Salesforce Mega cap, tech chaser. Wait. The whole thing. Chaser. Wait wait. Meg seven with the healthiest chart. Now is within Meg seven. Amazon Meg seven. Name with the weakest chart. Microsoft next 10% move in the S&P 500. Up or down? Down. Better opportunity buying breakouts
or buying pullbacks. Buying breakouts. Better market. Tell S&P 500 or S&P equal weight like that. That's you know that the S&P wait has outperformed the actual weights
since inception. Always go with the equal. Most overbought of being part of the entire market right now. Yeah there's nothing overbought. Well let's say energy sort of refiners and in certain insurance
stocks travelers all state. Most oversold part of the market. We like we think utilities have come down
to where they should bounce. Unpopular opinion chart
that you hate right now. Tesla. One word to describe this market. Quiescence surprisingly. Stocks by year
end higher or lower from here. Lower. That's Carter we're really appreciate it. Thank you so much for shedding some light on on your ETF and charts
and your insights. That's Carter,
Worth, CEO and founder of Worth Charting. If you enjoyed this street talk, check out our full interview
with Michael Landsberg. He explains how to actually
diversify your portfolio.

Comentários 0
Entre para participar da discussão.
EntrarAinda não há comentários. Seja o primeiro a compartilhar sua opinião!