…is fantastic news. When FTX collapsed and Bitcoin went under $16,000, everyone told me it was over, and it turned out to be one of the best buying opportunities of the whole cycle, and nobody can call an an exact bottom. You don't need to. So my suggestion this week is simple. If you've been sitting on cash waiting for a better time, pick an amount you are comfortable with, pick a day every week or every month, and buy on that day, no matter what prices are doing or what the headlines are doing, okay? Then move it on your own hardware wallet, okay? My coins are on my own wallet with zero leverage, all right? And I'm watching $73,100 and $69,700. If this video helped you, please give it a like and please subscribe and tell me in the comm…
So my suggestion this week is simple. If you've been sitting on cash waiting for a better time, pick an amount you are comfortable with, pick a day every week or every month, and buy on that day, no matter what prices are doing or what the headlines are doing, okay?
Contexto extraído por IA
The Fear and Greed Index is now at 29 this morning, and on Saturday, it hit 25, the lowest in 3 months. That is fantastic news. When FTX collapsed and Bitcoin went under $16,000, everyone told me it was over, and it turned out to be one of the best buying opportunities of the whole cycle, and nobody can call an an exact bottom. You don't need to. So my suggestion this week is simple. If you've been sitting on cash waiting for a better time, pick an amount you are comfortable with, pick a day every week or every month, and buy on that day, no matter what prices are doing or what the headlines are doing, okay? Then move it on your own hardware wallet, okay? My coins are on my own wallet with zero leverage, all right?
Transcrição Completa
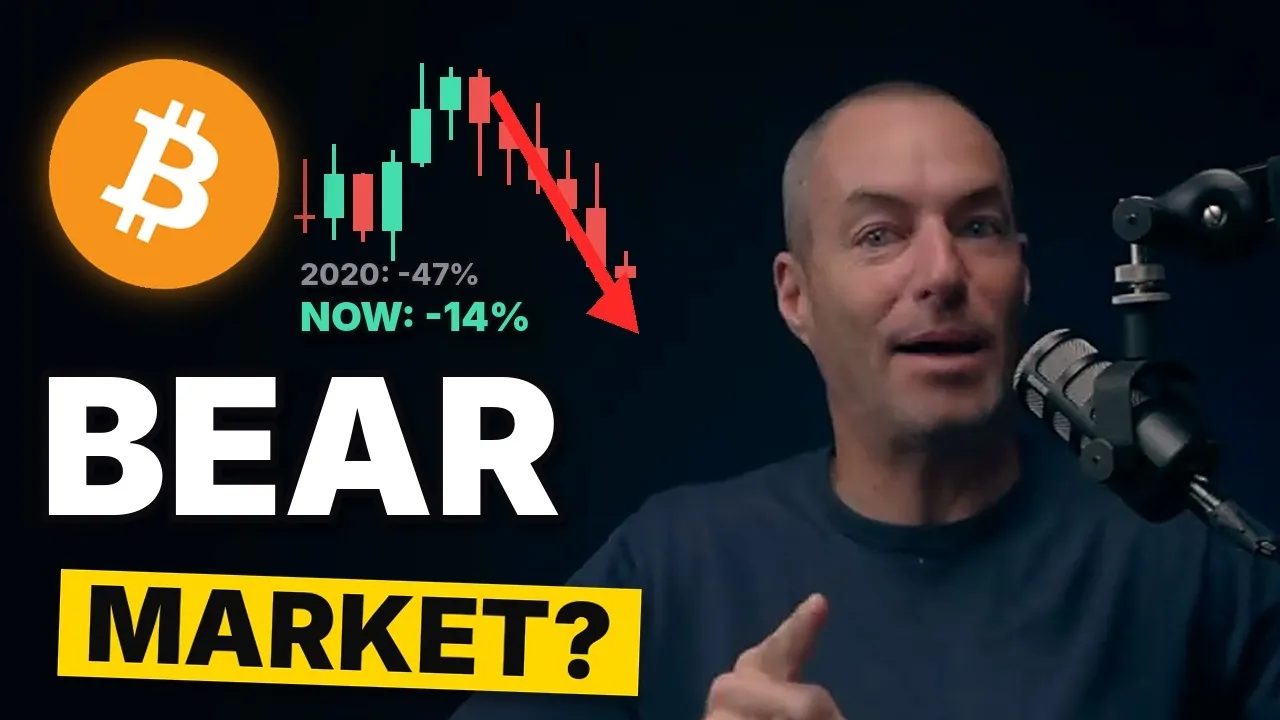
A lot of people are freaking out about Bitcoin right now, understandably. Five red weeks in a row. Okay, that's that's bad, you think. All right? And I think these are amazing prices, by the way. A streak like this has only happened about five times since 2014. So today I'm going to go over what Bitcoin did after every single one of these. All right? And why this streak is the shallowest of the lot. I'll show you the one line on the weekly chart about $69,700 that decides whether this bull market is still alive. And a stat from last Thursday on Bitcoin and the Nasdaq that is genuinely hard to believe. And the chart that tells you why I'm not worried, which isn't even a Bitcoin chart. So let's get into this. Now this is every streak of five or more red candles since 2014. And the red bars show how much each one took off the price. Government shutdown crash of 2020 took 47%. The 2022 streak ran for nine weeks straight and took 37%. And even the one earlier this year took 30%. But look at the mint bar at the bottom because this streak has taken about 14%, all right? From $86,480 at the start of October to $74,585 at Sunday's close. Less than half of any of the others. All right? Now look at the number on the right, which is where Bitcoin was a year after the fifth red week. Up 63% after 2015 and almost 11 times higher after 2020, but down 24% after 2022. Because that one came at the start of a bear market. And in 2015, the price still fell another 35% before it turned. Okay? So a streak on its own doesn't call the bottom. This is a grind rather than a panic. And that means the levels matter far more than the streak, okay? So let's find the floor. Here is the daily chart and the white line is the 200-day average, about $73,100. And today is day 85 in a row that Bitcoin has been above it. And since 2015, there have only been seven longer runs. So the trend, most people think is broken, is actually still intact. Now look at the mint arrow because that's how this run started, all right? From the 18th to the 21st of August, Bitcoin went from $64,681 to below it since. But the gap is now only about $700. And yesterday, after the inflation number, Bitcoin dipped to around $72,700, the lowest since August and just under the white line before closing back above it at $73,698. And the gold dashed line at $75,456 is the average price strategy paid. So they're now underwater on their whole stack. And today is the day MSCI decides whether to kick Strategy out of the indexes. And to be clear, that's not a delisting from the stock market. It's being dropped from the index list that a lot of funds track. With the change taking effect after the 30th of November, if they're dropped, these funds have to sell Strategy shares. JP Morgan estimates up to $2.8 billion of them, all right? But that is selling the stock, not Bitcoin. It doesn't force Strategy to sell any Bitcoin and they've got about $4.8 billion of cash set aside to pay their dividends. So expect a wild day for the shares and maybe a headline wobble for Bitcoin, but it's not a forced Bitcoin sale. Above us, the orange 20-day is about $77,300 and the blue 50-day just under $79,000, both falling. So that's where I'd expect sellers on any bounce, all right? So where's the selling coming from? The Bitcoin ETFs lost $1.28 billion in 5 days last week, the worst week since June, and another $201 million on Monday. So after taking in more than $3.2 billion at the peak in May, 2026 is now about $1.1 billion in the red. In July, this same money kept selling for 2 weeks after Bitcoin had already bottomed. And you can watch that video right here. But this next chart is the one that surprised me. These bars show how much the total supply of stable coins, crypto's own cash, has grown or shrunk over every 30 days since 2022. And the red spike on the right is at minus $15.1 billion, the biggest 30-day drain in more than 4 years. The only time it was worse on this whole chart is that deep red spike on the left, minus $29 billion when Terra collapsed in 2022. That was a phenomenal buying opportunity, by the way. There's now $291 billion left, down from $315 billion in May. So there's less fresh money sitting on the sidelines to buy the dip. But the one thing that I was most worried about has gone completely the other way. This is Brent Crude and that red line has crashed 21% in just 13 trading days from $116.72 cents on the 23rd of October to about $92. It's lowest since August after its worst week since 2020. That's despite the US striking Iran's Qeshm Island right on the Strait of Hormuz and the 2nd of November after Iran shot down an American drone. And again last Friday night strikes President Trump called minor. Oil is falling because traders are betting on a deal from the talks through Qatar and you know I'm against this war, but cheaper oil takes real pressure off inflation. Now look at the box because since the 23rd oil is down 21 percent and Bitcoin is down 9 percent. So Bitcoin got none of the relief and the reason is a chart almost nobody is watching. Last Thursday the 5th of November the Nasdaq fell 5.52 percent and Bitcoin fell 5.55 percent on the same day 300th of a percent apart. In the top half of the orange line is Bitcoin and the blue line is the Nasdaq since the start of September and look at that dashed line where they dipped together almost to the decimal. The bottom half measures how closely they move where one means in lockstep and in late August that mint line was down at 0.10. All right, so Bitcoin was doing its own thing and now it's at 0.72 the highest since March. So right now Bitcoin is trading like a tech stock. If the Nasdaq has another bad day Bitcoin goes down with it, all right? And that's exactly why the next chart really matters. This is what Wall Street is betting the Fed does on the 9th of December and those two mint bars add up to a 97 percent chance of another hike with 12 percent about one in eight on a half point. Yesterday's inflation number came in hot, prices up 0.4% in October against 0.3% expected. Gasoline up 37% in a year and there's no annual rate at all this month because nobody collected the prices during the last government shutdown. You know I call it the CPI because they keep changing how they measure it, but it's number Wall Street traders trade on and within hours Bitcoin was down at about $72,700 with about $200 million of leverage bets wiped out in 5 minutes, which is people gambling with money that they don't have. Now rate hikes hit tech stocks hardest and Bitcoin is trading with tech, but the Fed meetings are theater and the real story is what they're doing while they're hiking. The blue line is the US money supply and it just hit a record $23.41 trillion up 5.7% in a year. This is the fastest since May of 2022 even though the Fed raised rates in September. That's about $120 billion of new currency created every single month this year. The orange line is Bitcoin which peaked at $126,198 in October last year and is now 41% below that record. So the money is at an all time high and Bitcoin is 41% off its high. And look at 2020, the blue line shot up first and Bitcoin followed months later, okay? Your government doesn't care about you. With this much debt they can't stop. They're going to print it back, they're not going to pay it back and Bitcoin has only 21 million coins. Yeah, all right? That's that's the good news here. So BlackRock and governments want as much of it as they can and right now they're getting it cheap from the people panicking and they're not getting mine, okay? So is this bull market completely over? Here's the weekly chart and this is the line I promised you. Sunday closed at $74,585 just under the white 50-week average at about $75,500 and the orange 20-week has crossed under the blue 50-week. So the slow trend is against us. But the line that decides it is the gold one, the 200-week average at about $69,700 and look at the shaded area because Bitcoin closed 16 weeks below it this year. And the last one on the 16th of August at $62,819, then it broke out and hasn't closed a single week under it since. That gold line is the difference between a correction and a bear market. On the right are my levels. The 200-day at $73,100 is the first floor and if we lose that on the daily close, I think we're going to look for a $69,000 to $70,000 where the 200-week meets the August breakout. Above us, the levels to beat are $75,500 for a weekly close, then the 50-day at $79,000, then the last week's high at $81,080. My base case is about 50% is that Bitcoin chops between $73,000 and $80,000 while the ETF selling runs out. The bad case, about 30% is a daily close under $73,000 and a move down to $69,000 to $70,000 to test the 200-week. And remember, in 2015 and 2022 the price did keep falling after streaks like this. The good case, about 20% is a weekly close above $75,500 and a run at $79,000 to $81,000. If oil keeps falling and the Nasdaq holds up, all right? Today is the MSCI decision. On Friday, it's the producer prices. Next Wednesday, the minutes from the last Fed meeting and Bitcoin is tied to the Nasdaq, so watch the tech stocks. Now, if you built a real Bitcoin position alongside a job and a family and want a calm plan from two people who have done this on YouTube since 2016, that's Learning Crypto membership, all right? The link is in the description on the screen right now. The Fear and Greed Index is now at 29 this morning, and on Saturday, it hit 25, the lowest in 3 months. That is fantastic news. When FTX collapsed and Bitcoin went under $16,000, everyone told me it was over, and it turned out to be one of the best buying opportunities of the whole cycle, and nobody can call an an exact bottom. You don't need to. So my suggestion this week is simple. If you've been sitting on cash waiting for a better time, pick an amount you are comfortable with, pick a day every week or every month, and buy on that day, no matter what prices are doing or what the headlines are doing, okay? Then move it on your own hardware wallet, okay? My coins are on my own wallet with zero leverage, all right? And I'm watching $73,100 and $69,700. If this video helped you, please give it a like and please subscribe and tell me in the comments, does Bitcoin hold the 200-day at $73,100 or do we test the 200 week at $69,700 first? I will see you in the next one.

Comentários 0
Entre para participar da discussão.
EntrarAinda não há comentários. Seja o primeiro a compartilhar sua opinião!