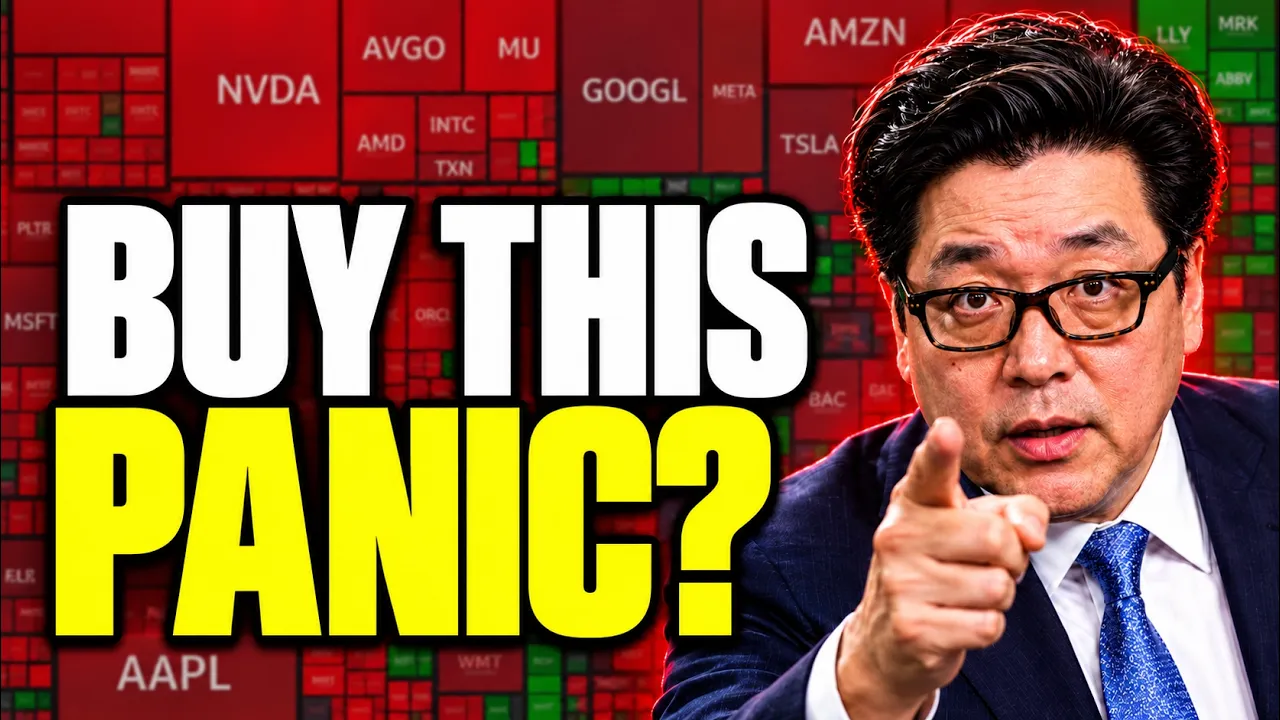
5 Stocks Down Up to 51% — My #1 Buy for November

- Retorno do vídeo
- —
- Chamadas
- 1
- Compra / Venda
- 1 0
- Publicado
Recomendações
Entrada é o preço de fechamento do ativo na data de publicação. Atual é o último fechamento registrado.
-
Entrada $1.150,89 01 nov 2026Atual $1.150,89 30 out 2026Resultado +$0,00vs. índice +0,0% SPY +0,0% no mesmo período
Citar esta recomendação Ver trecho original (772s) *
Contexto da transcrição original
… cycle? SanDisk, it deserves research. I wouldn't make it my largest purchase just based on the model upside. I want more confidence that $18 billion of annual cash flow can be sustained through different conditions before committing much. A small spective position is an approach for someone accepting that uncertainty. For me, TSM, it offers the more convincing balance between quality and forecast risk. The distinction is important when considering the wider market. And we've examined two businesses before the market. Here's why. The weekly heat map, it …
A small spective position is an approach for someone accepting that uncertainty.
Contexto extraído por IA I want more confidence that $18 billion of annual cash flow can be sustained through different conditions before committing much. A small spective position is an approach for someone accepting that uncertainty. For me, TSM, it offers the more convincing balance between quality and forecast risk.
Transcrição Completa
Today I'm looking for the best stocks to buy in November and this selloff has given us serious candidates. Some are down 20, 30, even 50%. So let's see where the valuations actually support buying. And I've narrowed down today's analysis to five businesses including one trading at around five times expected earnings. But the low multiple it comes with a catch and it could change whether the stock is actually cheap. Now, for each company, you're going to get my updated valuation, the main risk, and whether I'd buy at today's price. At the end, I'm going to rank them and show you where I put new money first. And we're going to kick things off with TSM, where revenue and profits, they've kept growing while the shares have pulled back, then Sandis, because it's cheaper earnings multiple. It depends on a very different set of assumptions. Now, TSM on Friday, it closed around $46. It was down just 6% on the day. And we can see they're still up year to date. We're talk around 34%. But when we take a look at their all-time highs, sitting just shy of $490. Well, it's down nearly 20%. Wall Street Quant, they both give the company a strong buy. Seek Alpha, they believe it's a buy, but on the weaker side, where today it sits around the midpoint of the 52- week range. Now, my base case for TSM sits around $492, roughly 21% above today's price. Margin of safety, that's sitting around 17%. It does interest me, but it also requires substantial cash flow improvement. Let's look at what's supporting the forecast. Firstly, in just their latest quarter, they generated $47 billion of quarterly revenue. Operating profit that came in at 27 billion. But before examining the shares, this is the scale of the business that we're buying into. Just look at the recent acceleration in revenue. In the latest quarter, dollar revenue grew around 41% yearonear. Demand, it hasn't disappeared alongside falling shares. The business, it's still growing rapidly. We have 2, 3, and 5 nanometer chips accounting for 69% of Wayfair revenue here. The business is moving towards more advanced manufacturing where customers need increasingly sophisticated technology that in my view supports the opportunity for TSM today. And profitability that's also improving quarterly gross margin that was 66% while operating margin 59%. These are exceptional numbers for a company building and operating factories. And then we look at their operating margin going back to 2017. The improvement here is substantial. It was 40% back then, dropped at its lowest at 34. Now it's sitting at 58%. This is exactly what I like to see. Revenue and profitability both moving higher together, essentially producing more profit per dollar of sales. And management, they sound confident, too. But read the qualification alongside this highlighted sentence. A dramatic increase is not going to happen overnight. So, I'd interpret this as confidence in improvements rather than assuming margins rise dramatically every single quarter. And obviously, like we're seeing with many big names maintaining the position, it costs real money. Capital spending for TSM is increased enormously. Factories, equipment, and new processes. They all need funding, which is why I want to see what cash is left after investment alongside those profit margins. Free cash flow. That's also improved. very good to see because we've covered companies recently where we can't say the same but it also moves around quarter to quarter very clear so what I would say is if you're looking at TSM don't take the strongest quarter and assume that every subsequent quarter is going to match that moving forwards and Wall Street as we highlighted with their strong buy very bullish their average target price $584 implying around 44% upside more bearish analysts sit at $440 more bullish all the way to $1,000. This is just in the next 12 months. And what do those analysts expect for earnings? Well, 2026 anticipating $1750 increasing to $23 by 2027. Now, if we look at just 26 on a forward valuation, it's 23 times this year's earnings. If we look into 2027, well, that's 17.4. The improvement obviously here like it is for many companies that are increasing their earnings is all dependent on the actual growth arriving. The other great thing to see is that the forward valuation is below the 5-year average. Now this is from Simply Safe Dividends using a slightly different forecasted window. So the multiples slightly differ but the conclusion is still the same. TSM is trading below its average and their growth metrics both past and present look very strong. I mean, revenue was up 36% year-over-year, expected to accelerate to 39% in the short term. Earnings per share up 61% expected increase 48%. Longerterm EPS expected to compound around 4344. So, the recent results, they support optimism, but expectations they still remain high. Buying today means relying on continued progress despite the share price dropping. Now my model starts based on analyst expectations of 2026 at $47 billion of free cash flow. That's quite a nice increase from 2025 where it was around 32 billion. The 5-year KGA we can see is 34% annually 10year 25. We've used 20% moving forwards. Discount rate sitting at 9% and then after this forecasted period 3% terminal value. Now recent cash generation helps explain the very large jump in free cash flow. Obviously, it still needs to arrive. So, I would keep checking on a quarterly basis where the annual cash flow is moving towards the level required by the valuation alongside their earnings result. This in turn gives us a value of $492 where we get 21% upside margin of safety sitting at 17%. And here's another test. If we actually don't take what analysts are expecting in 2026 and actually start off with 20% growth going straight from 2026 while the value comes to around $41, that's pretty much around fair value. So the opportunity rests partly on cash generation stepping up quickly. So I call TSM a business worth buying selectively while recognizing that my higher valuation, it needs more than just a routine year. Now, at 15% growth, the value falls to $358. At 25%, it climbs to $675. So, obviously, change in growth changes what I pay. Sensitivity, as always, it does matter. And the current price 406. I'd consider a small stage entry. I'd be more interested around 390 where the model would then give around a 20% discount. That's my preferred cushion against disappointment. Weaker demand, investment running ahead of returns, and Taiwan's geopolitical risk could undermine that view. I control the position size accordingly. Strong recent numbers don't remove risk that a spreadsheet struggles to capture. Now, overall, I'm positive on TSM with entry discipline. Now, let's move to the much lower multiple stocks, SanDisk. It looks cheaper, but the question behind those expected earnings, that's harder to answer. Now, SanDisk supplies flash memory used in storage. Here, the business case centers on growing data center demand. We're buying exposure to how much storage customers need and the prices and profits that Sandis can sustain supplying it. Now, we can see Sandis, they fell more than 13%. This is just on Friday, closing around $1,150. If we take a look at their high, that was $2,354. So it's trading roughly 51% below despite as we can see rising dramatically this year 384%. So it shows that Sandis is an incredibly volatile stock. In terms of ratings see Alpha with a weak buy. Wall Street pretty much in a 4.5 strong buy rating. Quant they also give it a strong buy. And Wall Street with their pretty much strong buy rating they anticipate 76% short-term upside. Their target is just over $2,000. Range incredibly wide as you would expect for a volatile stock, $870 bottom end, 3,000 at the upper end. And expected earnings around $227 for fiscal year June 27. It puts the stock, as we can see, trading at a forward valuation around five times earnings. It explains the bargain hunting interest and quarterly revenue reached $1 billion. Adjusted earnings was $49.51. both be estimates strong results. That's despite the painful share price reaction. Data center revenue that is obviously the most strike. It's moved from hundreds of millions to $4.8 billion in the latest quarter. The recent acceleration for Tandisk, it has been enormous and it also produces extraordinary growth rates across the table. Now, obviously, I'm not going to take the strongest percentage increase and extend it indefinitely. A weak base makes improvements look spectacular. So the starting point for SanDisk is very important. Year-over-year revenue was up 272% still expected to climb 102% so pretty much a double with earnings per share expected to climb 357% in the next 12 months. Longer term still very strong at around 40%. I mean their free cash flows up 866%. where their trailing gross margin that's sitting at almost 80% operating margin that's above 70% extraordinary numbers. The question is how much reflects lasting improvement and how much depends on favorable industry conditions continuing. That's how strong results in a falling share price can coexist. Investors may accept an excellent quarter while worrying about what comes after. Buying means taking in view on those future earnings. And the competing headline here is highlighting flash memory pricing. Now, obviously, it's not establishing that Sandy's profits will collapse. It just shows why industry conditions deserve attention when you're assessing whether unusually high margins can essentially last for a long time. Now, five times earnings, it does look cheap. With a sickle business, though, earnings can fall faster than the share price. I want the purchase to make sense under less favorable conditions alongside today's attractive headline multiple. The other thing is as well, look how wide the estimates range and how there are fewer analysts later on into the period. The final forecast, we've just got one analyst behind it. So I wouldn't treat this as a reliable consensus prediction of a collapse near coverage. That's good because we can see actually it is quite broad. Now my model assumes $18 billion of annual free cash flow for 10 years. In fact, the first year that is actually lower than what analysts are expecting. We've used 0% to be incredibly conservative. That is the lower end of the estimate. Essentially the bare case. The forecast, as I said, it does stay flat. And with that, we get a value of $1,716. That's 49% upside, a margin of safety day at 33%. Now, the multiple and upside, they are tempting, but both depend on the same issue. How much cash and profit Sanders can generate through a normal cycle. We need sustainable earnings to value. And also bear in mind their most recent year was 9 billion of free cash flow. The model is essentially doubling that to 18 billion. Although this is more bearish than what analysts believe. They expect this to be significantly higher. And data center growth it does support the bullish case. So I wouldn't dismiss the progress just because memory has historically been cyclical. You need to establish how much revenue translates into lasting cash generation. If we use the same model but actually have $12 billion of annual cash flow, it gives us a value of $1,155, that's pretty much around today's price. So lowering the assumption, it removes almost all of the cushion. It makes the decision more concrete. To have a meaningful discount at today's price, I need confidence in cash flow above $12 billion. The 18 billion case creates upside because it clears the requirement very substantially. A business can remain profitable, keep serving AI customers, and still earn less than the bullish forecast. The margins show why it's very important estimated value can fall without the entire story collapsing. And their leverage picture looks very comfortable against an indebted turnaround. It's helpful. It reduces financing pressure while leaving the operating question unresolved. What happens to product pricing, margins, and cash flow across the cycle? SanDisk, it deserves research. I wouldn't make it my largest purchase just based on the model upside. I want more confidence that $18 billion of annual cash flow can be sustained through different conditions before committing much. A small spective position is an approach for someone accepting that uncertainty. For me, TSM, it offers the more convincing balance between quality and forecast risk. The distinction is important when considering the wider market. And we've examined two businesses before the market. Here's why. The weekly heat map, it shows technology under pressure with other areas holding up better. So treating every company as one identical selloff is going to miss those differences. Now this chart, it points to a sharp reduction in leverage exposure. It's an approximate reconstruction. So I'm not going to use it to declare the bottom today, but it just helps frame the possibility of selling pressure beyond company results. And Tom Lee, he raised that possibility on CNBC during Friday's selling. And this is the heat map. We can see you lots of areas getting hit and getting hit hard. We're going to listen to his wording. He's interpreting the trading and it helps explain price pressure, but it doesn't establish what a stock is worth today. Tom Lee, what are you seeing? >> Uh Brian, I I I think that there is an internal battle as you kind of highlighted that today looks like someone's getting liquidated. I I don't know if it's an institution. I don't know if it's someone who's had a lot of these names and the these drops are causing for selling. Um but at the same time, uh the equal weight market is rising. So I think there still is plenty of money slloshing around. And reality is our institutional investors just just don't have conviction until after midterm. So, I think between now and November 3rd, uh, it doesn't take a lot for stocks to get to fall a lot because I just don't know if there's as much dip buying conviction till after November 3rd. >> Well, that's that's only three trading I mean two and a quarter trading days from now. You got the rest of today, Monday, and Tuesday. Tom, you think people maybe some retail traders are sitting this one out until they know how things are going to shake out at the polls? >> Yes. Now, that's a possible explanation rather than confirmation of a specific for seller. My response is to separate short-term trading pressure from earnings and cash flow that I'm expecting over several years. The valuation still matters. And these forecasts put five hyperscalers capital spending above a trillion dollars next year as enormous demand for suppliers and enormous investment for the buyers. Eventually, the spending needs to produce a satisfactory return. I mean, Amazon's trailing free cash flow. It shows the pressure that spending can create. It doesn't settle whether the investment is worthwhile. Investors want more evidence about future returns. Even while suppliers report excellent growth and on this comparison, earnings growth across the other 493 companies, it exceeds the Magnificent 7. The market offers more choices than choosing the biggest AI faller. Remember that when comparing opportunities. And we've also got the broader forward multiple that's fallen too. It's useful. Provided earnings estimates hold up. If the earnings are revised lower, the apparent improvement in valuation, it becomes less reassuring. We still need company analysis. That's my backdrop. Better prices, continued uncertainty, and a reason to buy selectively. ASML illustrates this. An outstanding business and a falling share price. They can still leave me wanting more room in the valuation. And before we take a closer look at ASML, just to let you know, I release one weekly article every single Monday morning covering severely undervalued stocks as well as what's going on in the market. You can click below, sign up, read all of these straight away. Now, ASML makes lithography equipment used to manufacture chips. That puts it back in the same investment chain as TSM. customers expanding advanced production. They need increasingly cable equipment, which helps explain why ASML attracts such interest. Now, it closed on Friday, $1,565. It was down just shy of 7% and it's now down roughly 22% below its high at $2,000. Across the year though, shares are still high despite recent weakness, up 46%. We get just one strong buy. That's from Wall Street. C alpha with a buy, but much weaker. And these machines, they're extraordinarily expensive. An average selling prices continue to rise. Product mix that matters, too. So, I'm not going to assume identical machines receive annual price increases, but reflect increasingly sophisticated equipment. Where revenue from installed equipment, that also matters. Service and field revenue that reached around 3.3 billion euros last quarter is another income stream alongside new machine shipments. And ASML's longerterm revenue picture is strong. There are some pauses that we can see as you'd expect when customers make large equipment purchase. But across the period going back to 2017, the business has grown substantially. It's why I personally follow ASML. And Wall Street with their strong buy, they see 37% upside. The average price target, it comes to $2,150. We've got trading operating margin, that's sitting at 39%. Net income margin, we can see a very strong 34%. The company earns substantial profits while developing complex technology is an attractive position at a sensible purchase price. And you've got forward revenue growth that's sitting around 29%. The question for SML is how much strength today's price already anticipates. excellent business results, they can still produce disappointing investment returns if we pay too much for future success initially. Now, analysts, they're expecting roughly $46 of earnings this year, climbing to $63 in 2027. That's around $34 times on a forward P 26 numbers and then down to 25 on 2027. The lower multiple obviously depends on the earnings continuing to increase. And on a forward basis, it sits below the 5-year average. It makes the shares more interesting, but the historical average honestly is just purely a reference point. I still want to judge the return supported by forecasted cash flow. And for ASML, you've also got a buyback program which adds another cash return. It's welcome when purchase makes sense at the prices. Company repurchasing shares. It just doesn't establish that we're receiving an attractive entry ourselves. Now, I'm using 15% annual free cash flow growth, 9% discount rate. It allows substantial expansion over the next decade. The forecast obviously, as you'd expect, assumes continued progress. And that gives us a value pretty much around $1,500, indicating actually no margin of safety, a 5% premium. So even though there's a decline, and it has improved the entry, it hasn't necessarily created a bargain for us today. Now, you could argue these earnings forecasts justify stronger cash flow growth. That's reasonable. It means adopting a more optimistic forecast though rather than assuming falling shares just proves that ASML is cheap. And if we look at the lower growth rate coming in at 10%, it drops the value down to $1,000 20% 2,165. The range makes entry important. I'd like room for some disappointment before just relying on the strongest scenario. I'd keep watching service demand as a sign of customer activity. Continued spending on productivity and upgrades support the case. If that slows, I'd reflect that in expectations before assuming an automatic recovery. I'd prefer an entry close to $1,250 to $1,300 is roughly a 15% discount to estimated value under the model is a valuation watch level rather than a price prediction. ASML, in my opinion, is a quality business where I'd wait for a better entry. Stronger growth expectations could justify buying, but I prefer leaving room between estimated value and the price that I pay. Waiting. It doesn't require predicting another sharp decline. It means the expected return at today's price doesn't yet meet my threshold under the forecast. A lower price, stronger cash flow prospects or both. They could change that decision. Now, American Express takes us away from semiconductors. is investment case rest on spending card fees and earnings growth is going to be a useful comparison when several alternatives depend on the same technology spending cycle and with AMX I want customers who keep spending and renewing their memberships spending fees and lending they all affect the result it gives us different business drivers to compare with chip industry investments that we've discussed today now it was only down around 1.4% 4% on Friday, trading around $319. In terms of year to date, not great, down 14%. It's trading towards 52- week lows, 52- week high, $387. It's down near 20%. The fall, it makes it worth revisiting, particularly beyond the usual AI names. We get a buy from both C alpha and Wall Street. Not that strong, 3.8, four out of five. An average annual spending per basic card member is reached more than $25,000. The pandemic setback is clear, followed by recovery. Spending has now moved well beyond the earlier levels that we've seen. An average fees per card. They've risen from $61 to $136. It explains the attraction. Spending and membership fees can both contribute to the economics of an ongoing customer relationship. And younger customers, they're particularly interesting. Gen Z build business growth. reaches 40% here. That's growth in spending rather than 40% of total spending is encouraging evidence of the brand connecting with younger customers. The ongoing test though is going to be where the customers keep finding enough value to renew at higher fees. The chart obviously is showing us progress so far. I'd want that to continue while the company keeps relationships profitable after funding benefits where AMX reward line that's risen. These companies, they've got different payment recipients and revenue definitions. So, I wouldn't mechanically rank them, but for AMX, the cost of keeping customers engaged, that's what deserves attention. Now, Wall Street with their weaker buy rating, they do see upside. Target around 15%. Price $366. Range 329 low and 425 at the upper end. And return on common equity that sits at 35%. Net margin that's in fact close to 17%. They're attractive figures alongside customer trends. American Express. It also carries lending and credit risk which also affects their future earnings. Forward revenue that sits at 9 and a half% diluted earnings growth on a forward basis sitting at 14.8 is a more measured profile than the semiconductor names. At the right price though, it can support worthwhile returns. Now expect earnings just shy of $18 this year, just over $20 next year. That's around 18 times earnings 2026, 15.8 8 on 2027 is more approachable than many premium business valuations. With a forward multiple, it sits slightly below the 5year average yield pretty much in line with the average. The main attraction here though is the earnings growth in valuation. Today's yield offers no unusual income opportunity. Now in our valuation summary, the averages here comes to $373. Now that's a 15% margin of safety around 17% upside. For the individual valuations, they do differ substantially. Now, I would place less weight on a generic DCF for a lender. Funding and required capital complicate the calculation, so just something to bear in mind. This result needs checking against earnings and cash available to shareholders before I'd anchor this DCF to a sole buying yes or no decision. What I'm more comfortable with is starting with the earnings valuation, then assessing growth, capital returns, and credit quality. If loan losses start taking a larger share of earnings, a lower multiple could offer considerably less protection. Higher returns on equity need support from durable earnings. If profitability weakens, the earnings forecast and the multiple I'm willing to pay could both fall is why the valuation needs a cushion. I see reasonable value with less cushion than the DCF implies. Around $300, it interests me more. Around 20% below the blended estimate is a better entry. The customer story keeps it in contention. Younger spending growth offers potential future relationships. I want those relationships to stay profitable as customers age, keep spending, and decide whether membership remains worth renewing. Now, I'd favor a patient entry over a large purchase simply because shares have fallen. American Express ranks ahead of them on certain opportunities for me, but today's price, it doesn't make me rush. Now booking holdings that's fallen harder this year while producing substantial cash. The central question is whether AI changes travel search and booking. Let's compare financial performance without disruption concern. Booking it connects travelers with accommodation and other travel services through platforms including booking.com and a booking volumes. It shows us the scale. The investment rests on keeping a valuable role between customers and travel providers. booking. Well, it closed at $148, down 1.5% on Friday. I mean, it's down 31% year to date, trading, as we can see, at 52- week lows. I mean, it's fallen massively from 52- week high at $221. This fall is deeper than several of today's names. I want to compare that weakness with the underlining business. I mean, we get a near strong buy rating from Wall Street. Very respectable buy from Seek Alpha and their long-term revenue that's grown substantially. The pandemic interruption that's obvious alongside the recovery. Now that doesn't eliminate future travel risk, but it does write context before assuming today's share price weakness just reflects a business no longer progressing and their operating profit alongside that's expanded to higher sales have translated into a much larger profit pool. We can debate future competition, but the historical evidence shows considerable ability to turn demand into shareholder earnings. Now, Wall Street, they anticipate in the short term 57% upside, average target $233, range 170 to 301. And their trailing operating margin that's sitting at 35%, net income margin, that's sitting around 26. These are strong economics. The question is their durability if travel demand weakens or if customers change how they find trips. I mean, their trading free cash flow is roughly $9.5 billion. That's a tangible starting point for valuation. So we don't immediately need the business to reach a new cash generation level just to justify buying today. And we can see share buybacks. They return substantial cash through them. Now when they're funded sustainably and sensibly priced repurchased, they can increase each remaining shareholders claim on the business. I mean here's the effect. Shares outstanding have fallen from roughly 1.2 2 billion to around 760 million is a substantial reduction leaving future earnings to be divided across considerably fewer shares. Now forward revenue growth that's around 10% diluted earnings growth on a forward basis that's seeing around 18. Obviously forecast can change but they help frame the opportunity. The stock trades at a lower earnings valuation than several businesses we've already examined today. Now, expected earnings, they're $1046 for 2026, climbing to $12.37 for 2027. That's roughly 14 times this year's earnings estimate and 12 times next year's. That price and growth combination is what interests me today. We've also got the forward valuation sitting below the 5-year average by a significant distance, 13 versus 20. Now, I'm not going to assume an automatic return there. If earnings remain durable though, a lower starting multiple, it means I need less help from valuation expansion. Now AI agents, they could change where people begin planning holidays. Existing travel platforms, they might face pressure over customer access and economics. That's a genuine issue to consider rather than assuming every falling share price just represents irrational investors. And the AOD integration, it shows an existing travel platform participating in AI interface. The question is who supplies the inventory, completes the transaction and earns the profit. A new interface, it doesn't settle who benefits financially. Now established platforms, they already handle substantial booking volumes. Scale won't prevent every disruption. But displacement thesis, it needs to explain how replacement handles the travel business behind the interface beyond just attracting users. Now, this revision screen, it does add caution. More earnings downgrades than upgrades and more revenue downgrades than upgrades. I'd keep that in view. A stock can look cheap while expectations just keep on falling. Now, my model is starts with a historical 25 figure at $9.1 billion and then it assumes 5% growth. Now, 5year keer much higher 38, 10 year 10%, most recent year at 15, year prior 13, and 13% before that. The attraction here is how close that starting assumption sits to the current cash generation. I still need growth and resilience, but I don't need cash flow to double immediately. That makes a forecast easier to assess. And the model also use a fixed share count. I haven't assumed another decade of shrinking shares on top. Future buybacks could help per share results, but I count that benefit as cash actually return to shareholders. Now, the value comes to $237, giving 60% upside and a 38% margin of safety. Net debt relative to EBIT DAR that looks manageable here. It helps when assessing capital returns. I'd still want buybacks funded responsibly if travel conditions soften or the company needs to invest more in its platform. The zero growth scenario, it gives a value of $161 only modestly above today's price. The model needs little growth to approach today's valuation. Sustained cash flow deterioration that would still weaken the case. now booking a report on Tuesday, November the 3rd, after the market close. That could change both estimates and the share price. Finding long-term value in deciding how much to invest before results, their separate decisions. Now, their recent record of beating estimates is encouraging without guaranteeing the next report. I'd focus on the outlook, too. A backward-looking beat can still disappoint investors if management's comments weaken future earnings and cash flow. bookings. It gives me the strongest cushion of these five with more modest growth requirements. I'd consider a small initial purchase keeping money for after earnings. The opportunity deserves attention alongside a plan for earnings risk. Now, there are also three other notable mentions. Haven't gone in depth because we've covered these recently. Well, the first one is Brocom, a very strong contender for perhaps maybe the best buy this month. My intrinsic price $516.37 margin of safety. Wall Street sit higher 63% upside. You can see we use a 20% growth rate. That's pretty much in line with the 5year below the 10-year reverse ECF 13.2%. So you can see if you believe the lower growth rate is more appropriate while the upside is significantly less at 13%, middle case though 58% does make it increasingly attractive. The next notable mention is Nvidia that was down around 4% just on Friday. still up year to date around 10% double strong buy as well where I see a 20% margin of safety Wall Street a lot more bullish at 61% although bear in mind I've got a discount rate of 9% where the lower end at 10% comes into fair value if you believe 15% 25% and if you want to see previous episodes we go into a bit more detail around the future free cash flows from 27 to 2030 and then there's Amazon that was up around 4% year to date they recently released the earnings we've done a deep dive specifically just on the company. I'm watching how the investment program converts into future cash generation alongside the performance of the business. That one looks around a 23% margin of safety. Wall Street see it higher 38% upside. We'll use a 15% growth rate. Reverse ETF is much lower. But again, very important to understand the recovery that is expected by analysts in their future free cash flow. So if you want a specific deep dive for Amazon, just check we have released it in the last few days. Now for a quick recap. In fifth was Sandis. There's substantial upside in the model, but the widest gap between that spreadsheet and my confidence in sustainable earnings. I'd keep exposure small until I understood cash generation through the cycle. For this ASML, I'm more confident in the business, but want a better price under my base assumptions. I prefer an entry near $1,250 to $1,300 unless fundamentals raise my valuation. Third, American Express. The multiple customer trends are interesting. I'd prefer a price nearer $300 and I'd watch credit quality. I wouldn't base a large purchase on that generic cash flow model alone. Second, TSM. I consider a small entry around today's price than at a larger discount. Business performance is strong. Position size should still reflect Taiwan risk and the cash flow improvement my valuation assumes. First booking, current cash generation, a lower multiple, and modest model growth give it the strongest combination for me. I'd start small or wait for earnings. then reassess before committing the full intended amount. I'd focus buying research on the top two first. We don't need all five to complete a list. Position size should reflect uncertainty and existing holdings, particularly where companies share an investment cycle. If cash flow expectations weaken, I lower the valuation. If prices rise without improving fundamentals, the opportunity becomes less attractive. That's the discipline I'm carrying into November. Use the numbers to guide decisions as evidence changes. Which would you put first and which assumptions do you disagree with the most? Let me know in the comments below. Don't forget as well to sign up by clicking on the pin comment to the weekly newsletter. Next one coming tomorrow morning. More importantly though, have a great day. I'll see you all on the next one.
Comentários 0
Entre para participar da discussão.
EntrarAinda não há comentários. Seja o primeiro a compartilhar sua opinião!