I'm actually going to go in and do some accumulating
Contexto
If we see Microsoft coming back down to $465 or below anywhere down here, I'm actually going to go in and do some accumulating because I think that there's a very real world that Microsoft comes back down, finds some sort of higher low and actually does continue this trend upwards.
My game plan when it comes to Google is actually to accumulate at these levels
Contexto
My game plan when it comes to Google is actually to accumulate at these levels because look, I don't know if it's going to do it successfully.
I'd be willing to do some small dollar cost averages on Amazon if it does continue down into these lower liquidity levels trying to find some support
Contexto
I'd be willing to do some small dollar cost averages on Amazon if it does continue down into these lower liquidity levels trying to find some support cuz I do think it will do a good job at using that support to try to make another run back up towards the top side.
I'm interested in buying Google at the golden zone
Contexto
I am interested in purchasing them. I'm interested in buying Google at the golden zone. I'm interested in buying Microsoft if it does start to pull back towards the bottom side of this golden zone. I'm interested in buying Amazon if it comes back down towards the green zone because their prices are showing signs that support and buyer side pressure could be there to try to force the price back up, but also because I still have a lot of conviction in the long-term narrative.
I'm interested in buying Microsoft if it does start to pull back towards the bottom side of this golden zone
Contexto
I am interested in purchasing them. I'm interested in buying Google at the golden zone. I'm interested in buying Microsoft if it does start to pull back towards the bottom side of this golden zone. I'm interested in buying Amazon if it comes back down towards the green zone because their prices are showing signs that support and buyer side pressure could be there to try to force the price back up, but also because I still have a lot of conviction in the long-term narrative.
I'm interested in buying Amazon if it comes back down towards the green zone
Contexto
I am interested in purchasing them. I'm interested in buying Google at the golden zone. I'm interested in buying Microsoft if it does start to pull back towards the bottom side of this golden zone. I'm interested in buying Amazon if it comes back down towards the green zone because their prices are showing signs that support and buyer side pressure could be there to try to force the price back up, but also because I still have a lot of conviction in the long-term narrative.
If we see Amazon coming back down towards these lower levels, I'm buying
Contexto
If we see Amazon coming back down towards these lower levels, I'm buying.
Transcrição Completa
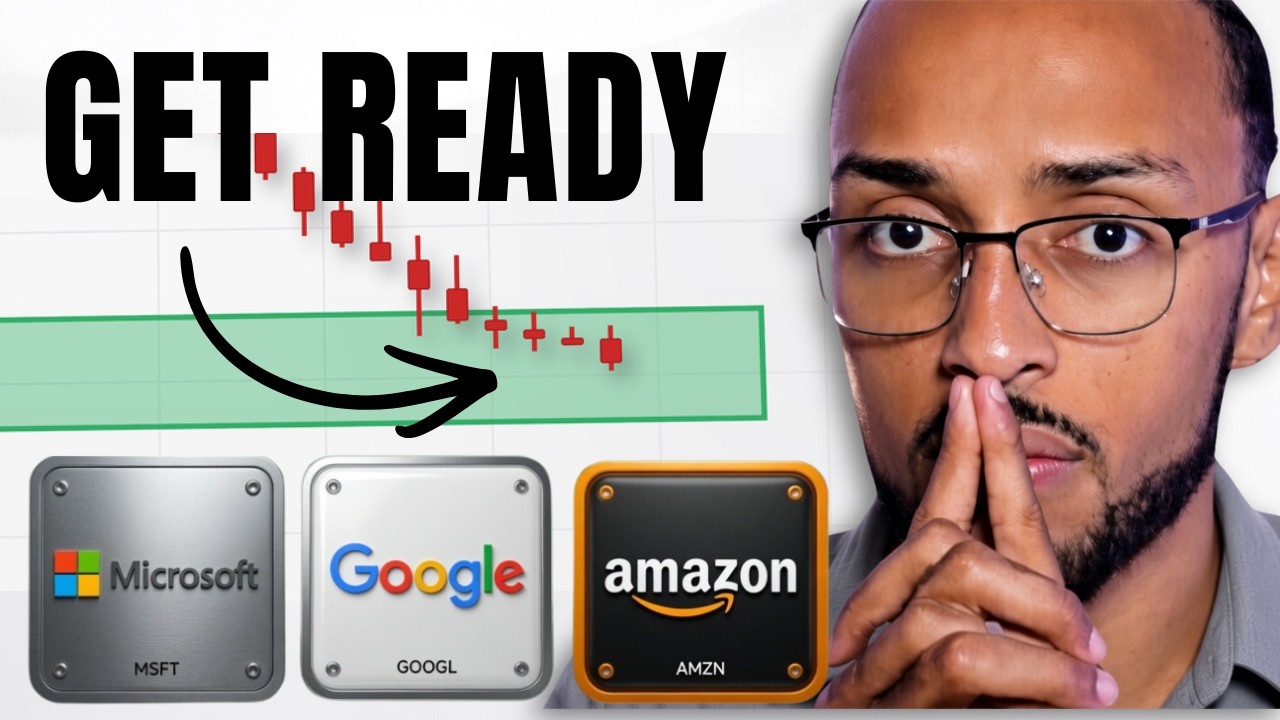
All right, what's up everybody and welcome back to another Monday here in the stock market. Well, in today's video I'm going to talk to you all about three different stocks. We're going to take a look at Microsoft. We're going to take a look at Amazon. We're going to take a look at Google because as many of you know, these are the three positions that we've recently opened over in the hyperscalers trade just a couple weeks ago. And I am seeing some things on their charts right now that are encouraging me to make moves in this trade this week. It is very likely that I'm going to buy some Google, maybe some Amazon, maybe some Microsoft as a result of what's happening on these charts. And I figured you guys, of course, would want to know and see it in advance before everybody else starts talking about it. And so, in today's video, what I'm going to do for you all is just walk you through it all. We're first and foremost going to take a look at the spy chart because, as many of you know, it's important to get the context of the market before you start looking at individual stocks. Then, we're going to dive into Microsoft, then Google, then Amazon. And once I walk you through these charts, I'm going to come back to the portfolio, this little trade here, and I'm going to show you exactly what I'm going to do in these positions as a result of what I'm seeing on these charts. And there is a world in which it does actually influence my main public portfolio as well. So, I'll keep you updated on what's going on there also. So, we have a good bit to get into today, and I don't want to keep you too long on a Monday, folks. But, I did want to let you all know, um, this sort of video where I'm going to be diving into more specific stocks and looking at their charts like this is a bit newer here on the channel. So, if you guys do enjoy it and you want to see more, you know, maybe with other things like, you know, semiconductors, memory companies, etc., hit that like button, let me know down below. But with that in mind, let's go ahead and let's jump straight on in. So, first and foremost, as I mentioned before, let's take a look at the spy. Let's get a little bit of context as to what's happening in the market from a technical perspective because what this does is it sets the foundation for our expectations on these individual stocks. You never really want to go into looking at an individual stock blind and dry because realistically the context of the market will have a massive impact on how that stock performs. Okay, so let's look at SPY first. So when it comes to SPY, it's a very easy, very intuitive thing that's happening right now. Okay, let me walk you through it. So as we can see here going into May, SPY was making some beautiful moves and it continued those moves all the way into the very beginning of June. When June came around though, SPY started to go a little bit sideways and it went into this sideways correction right here to reset some of that momentum. We saw a beautiful run upwards, but it needed to slow down. It needed to calm down. The way that I envision this is that this is a pit stop. Imagine you're driving through Texas and you know you're going through Houston, you're going through Katy, you're going through Austin, wherever, and you end up running out of gas. Well, of course, you're going to pull over to a bit of a Bies. You're going to get some snacks, some Beaver nuggets, you know, little sour strips, maybe a little bit of fudge. You're going to refuel a little bit and then once of course you have enough of the energy that you need, you're then going to try to continue on about your way. That's what this is, right? That's what the buyers did. They had to see a bit of a cool down, a bit of a correction. Well, now that they've seen a cool down and a correction, I told you all the first next pit stop that they were going to make, the next place that I thought they were going to maybe run into a little bit of trouble was right here between 784 and $771. And the reason being is because this is what's called an extension zone. And I've made it very clear to you all. You don't want to play around with an extension zone because if anything can kill the momentum of a pump like this, it's an extension zone. And this one, as I mentioned before, ranges between $784 and $770 for the S&P 500 ETF, SPY, SPDR. Okay. So, and that's exactly what happened, right? We got this beautiful extension upwards. We spent 4 days going straight vertical up until the point in which we did see um SPY push into this extension zone. Well, now that it's in this extension zone, what you can see is a major battle happening. The major battle is occurring between the sellers to the top side of this channel right here in this little red zone. And you can see it a little bit clearer if I just get rid of this for now. There you go. You can see there are sellers sitting very clearly in the top side of this channel. And there are buyers in the bottom side of this channel. And now that we're in that big extension zone back there, you can see that the sellers and the buyers are having a battle real quick to see who's going to win. Who's going to take control of this? Are we going to be able to see SPY actually start breaking up through this channel and trying to extend up into the 800s? or are the sellers going to take over and push spy all the way back down towards 755 because if spy does get rejected out here I'm telling you that is very likely where it's going like 755 to 758 somewhere back here to retest this liquidity so this is a very important moment and I've told you all many times over the last week or so you got to watch what happens here because this is going to set the tone this is going to set the stage and the context for the rest of the market so there's a massive decision being made in the broader market right now that is going to be so impactful that you need to look at it and keep a very close eye on it no matter if you hold AI stocks hyperscalers, financial companies, it doesn't really matter. This is going to be impactful for everything. Okay? And so with this in mind, knowing that there is a very clear battle happening right here for the broader market, let's now look at how that is impacting or what sort of context that's setting for some of our other individual stocks. Starting with Microsoft. Well, when it comes to Microsoft, it's really no surprise because what you'll notice a lot of the time is that when SPY is making a move, some of your major players are also making a very similar move because they take up a pretty big percentage of that. And what we can see if we look in Microsoft right now is that Microsoft is currently sitting in a major import a very very important decision-making zone itself. Let me set the stage for you. So, what we can see is that Microsoft made a very beautiful move itself all throughout last year. I mean, this thing ran all the way up to what was this? $554 at the very end of July of 2025. It made another run towards $553 in October of 2025 before ultimately putting in some sort of double top and giving you some sort of macro rejection back down towards $351. I mean, what a beautiful move. You got all the highs and all the lows. You got people making money on both sides, right? Well, as you can see though, as it came back down to this buyer zone, and the reason I say it's a buyer zone is because buyer stepped in here, buyer stepped in here, and buyer stepped in here. But as it stepped back down into this buyer zone, it started to show very clear signs of a potential reversal. And this wasn't particularly a surprise to us. We were watching these reversal signs and it's the reason why we open up a position on Microsoft right here on July 24th. You can see we started this is the public port. Let's go here. We started to build into this hyperscalers trade. Let's go here. And as you can see, the very first purchase that we did on Microsoft would have been Sorry, I should have had this pulled up for you guys. Um, boom. here. $1,500 purchase on Microsoft at $384. So, we started building into that position on Microsoft right here because a lot of the signs and signals were saying like, hey, there's a good chance that this thing tries to give you some sort of reversal sometime soon. And that's exactly what happened. Microsoft saw a beautiful bounce towards the top side. And not only did it come up and start breaking out of the trend, for example, which was this line, but it also started or the structure, I meant sorry, it started to break out of it structure. It also started to break the trend where Microsoft had previously been consistently putting in lower highs, right? All these highs are getting lower and lower lows. All of these lows are getting lower. You can also see that it started to break through again that trend where it set a new higher high. So, Microsoft gave all the clues, all the signs in the world that this move was going to get really vertical and really euphoric and we rode that puppy all the way to the top. And the coolest part is that the Microsoft position is now sitting up pretty decently well. I mean, the Microsoft position is now up 26% in the span of 2 and 1/2 weeks just because we started to kind of recognize those potential signs. It happened way faster than I was expecting, but nonetheless, it's worked out pretty dang on well here. But now that Microsoft has made this beautiful move towards the upside, you can't ignore what's happening now. You see, a lot of people are having are having their um their perspective clouded a little bit. They're seeing Microsoft up a lot and they're saying, "Okay, we're going straight up towards 650. Okay, we're going up straight up towards 680." And although it is possible that we do that, there is a battle that is happening right now before that can even be an idea, right? And the battle is the golden zone. Now, if you watch my channel, you know that I talk about the golden zone all the time. The golden zone is one of the strongest levels of resistance or support that a chart will see that an asset will see on its chart ever realistically. And right now, Microsoft is in one of the strongest golden zones that it's ever seen before. This is the golden zone that has spanned over a year. It was created a year ago. And so naturally, this is going to be a major major zone of resistance. The sellers are going to be here. They're going to try to force the price down. And this zone ranges between $52 and $465. Now, another thing to consider is the fact that at $500, there's a psychological level of resistance as well. Sellers are going to sell at 500 just because the letter the number 500 just looks like it does, right? That's called a psychological psychological level of resistance. And so, we have a major major seller zone sitting directly above Microsoft right now. and it's going to be very hard for Microsoft to get above this zone. There is actually a world in which Microsoft comes all the way back down to 466 before being able to build up enough support to get above that. And you're going to want to watch this very closely because realistically, what happens here at the top side of this golden zone for Microsoft is going to tell you everything you need to know about the rest of this month. I think if you start to see Microsoft really rolling down, really rolling off of this thing, yeah, it's probably coming back down towards the bottom side of the golden zone around $466. Not only is that the bottom side of the golden zone, which is just naturally a very important level, but it's also this key point of resistance right here, right? You see how we had this resistance right here? Well, guess what? When the price starts to get above that, sometimes it's going to break above it and come back down to it and try to flip that resistance into support and use that support to try and continue upwards. Especially when you consider the fact that, let's look at our HCI really quickly. Yeah, especially when you consider the fact that your HCI is now sitting at a 3.92. I mean, all the writing is on the wall that Microsoft easily can get rejected off this level and start heading back down towards these lower levels. Now, if it doesn't, which I think is the more likely scenario, I think it does. Sorry. I think it going down is a more likely scenario. Probably about a 65% chance. Um, but if it doesn't do that and it takes a more hail mary route and it, you know, goes for this 35% shot, you could be looking at a Microsoft chasing down an all-time high over the span of a week. I think within the span of one week, you could see Microsoft extending from $55 to $555, taking out that all-time high and possibly on track to push into the 600s. I mean, it could happen extremely quickly. It's not super likely that that happens, but it is very possible. And that is something that again, you're going to want to watch close. And so, not only do we have the SPY, for example, in a position in which it's in a major zone of resistance being at battle between the buyers and the sellers, but that's also reflecting in Microsoft as well. And it's going to be extremely important that you watch to see how this interaction plays out because it's going to set the stage for what the next big move is. So yes, I'm saying that Microsoft can go up or can go down to those of you who love to comment that. Yes, that is what I'm saying. But that is what technical analysis is sometimes is sitting back and establishing the odds. You're not saying for certain it's going to go up. You're not saying for certain it's going to go down because you can't read the future and no one can. But what you are doing is saying, "Okay, based on the position that we're in, based on the data set that I have, I believe there's a 65% chance that it rolls over, 35% chance that it pushes upwards." But one way or another, once it does make this move, it'll give us a clear idea of what the next move is. And personally, what I'm going to do in my portfolio, the next move that I'll make in my own Microsoft position is accumulating on Microsoft if it does give this roll back. If we see Microsoft coming back down to $465 or below anywhere down here, I'm actually going to go in and do some accumulating because I think that there's a very real world that Microsoft comes back down, finds some sort of higher low and actually does continue this trend upwards and it starts to make that trend start to, you know, push in the upwards direction. Because one thing to consider is that although Microsoft has set a higher high, it's not set a higher low yet, right? Because look, we had a low, a lower low, a high, a higher high, meaning that this is only the first half of an uptrend. Microsoft may need to come down and actually set the higher low and establish that buy zone before it can clear any major zones of resistance. So, I'll be going in and I will be doing some buying in the Microsoft position if it rolls over. If it does pump, if we see it break out, uh, I'm probably not going to go in and do any accumulating. It just I don't like to buy things when they're when they're going vertical. It's just not really exciting to me. But I'll keep you guys updated. But I know for certain if it starts to roll over, I will be looking for accumulation. Okay, now let's move on to Google. Let's move on to Google because Google's in a much different position. Okay, Google's in a much different position. As you can see, Google has actually done a really good job from, let's call it March of 2026 all the way up until May of 2026, we saw a huge extension. I mean, we saw Google rally from $271 to $49. Absolutely fantastic. The thing is though, since then, it's really not gotten treated super well, right? I mean, as you can see, since it did give us this extension towards the top side around 410 bucks, it's really just pulled back. At one point, we saw it pull back basically consistently for 39 days straight, falling all the way back down here to around $332. And then it got even worse because when it dropped their earnings report, was that on July 22nd? Yeah, on July 22nd, we ended up seeing it crash even further. Right. So, Google's been taking a bit of a beating um ever since May of 2026. But all in all, when you do just zoom out a little bit, it's definitely still performing extremely well. Now, a lot of people are going to look at this Google chart and they're going to go, "Okay, this is just, you know, Google just had a high, had a low, had a high, had a low." But it definitely does go a little bit deeper than that. And if you have an understanding of how to use the Fibonacci, what is happening for Google is actually very clear. There's a very obvious story playing out for Google here. You just need to know how to see it. So, let me show you how to see it. So, what you're going to want to do is you're going to want to go to your fib retracement tool, and you're going to want to draw in a high from here and a low here. When you do this, the whole story becomes obvious. And if you have my settings from the Golden Zone videos that I post, you'll know exactly what this looks like. But if you don't have your settings turned on, this is what you're going to want to do. Copy, pause the video, copy these settings, make sure fib levels based on log scale is turned on. If you're unable to turn that that function on, go to your settings right here, come to logarithmic, give that a click, and then go back into your settings, and it will allow you to um turn your fib levels based on log scale on. But once you do that, this is what you're going to have. This is what you're going to see. And the story is very clear. The story is very obvious to me. We had a high, we had a low, we had a golden zone. What you can see is that um Alphabet, Google, broke up towards that golden zone and actually did a fantastic job at breaking above it. Once it broke above it, many of you know, my theory is always the same. Once you break the golden zone, you're likely going to chase down an all-time high, but there's still going to be a magnet above you in this green to blue zone right here, and it's going to try to pull that price up. It's going to try to pull that price up into this extension zone. And this is your sell level. This is where you can expect the sellers to step in, start trying to push the price back down. And that's exactly what happened. Google [clears throat] came up, it broke through its golden zone, and it went straight up into the magnet zone, right? This little $48 to $374. It got pulled all the way up here. did a very good job. But the second that it got up into this magnetic zone, this old big old seller zone up here, the green zone right here, we ended up seeing Google starting to get rejected, right? And it was unable to maintain this momentum. And that's normal. It's very hard to continue upwards after you hit the zone. And that's what I keep trying to tell you guys with everything. You know, even when it comes to the spy, for example, I've told you you guys many time like, you know, you're looking at the spy and you're seeing it up here and it broke through the golden zone. Great. But the fact that it's now sitting in that that green zone up there, I mean, that's where the danger is, right? And so what you can see is that yeah, Google started to get rejected and not only did it get rejected, but it got rejected all the way back down into the golden zone. So the same major level of resistance back here is now being flipped into support. And so what Google is trying to accomplish right now, let me get to the moral of the story here. What Google is trying to accomplish right now is that the price is trying to flip this major zone of resistance into support. take this major seller zone, flip it to a buyer zone, and use this buyer zone to continue upwards. And it's doing it successfully. What you can see is that not only did Google find support on the bottom side of that golden zone, but it used it to break the downtrend. You see how we had a high, a lower high, a lower high, oh, a bit of a higher high. Oh, higher high. Right? So, this downtrend that we were in did get flipped into currently an attempt at an uptrend. That is a sign and a signal that this buyer zone is working. The fact that the first time that we saw Google start flipping around and going into an uptrend is right after it hit the golden zone. It means that the same amount of resistance that was here is going to provide the same amount of support and Google's in a pretty good spot right here to try to accomplish this. And so now that Google is getting, you know, a bit of a rejection right now as soon as it hit that major zone of resistance again and coming back down to this level, what you need to be on the lookout for is whether or not it can maintain support. The goal and the job for Google is very simple. Set the higher low. That's all it's trying to do. set the higher low. As long as Google sets a low that is higher than $317, I think it's going to go for an all-time high. I think it's more than reasonable to assume that Google's going to come down, try to find some sort of support, work itself up, and use that support to break up towards a new all-time high. And the reason why I believe that is because of the structure. Google was in a downtrend. Lower lows, lower highs, lower lows, lower highs, lower lows, lower highs. Boom. Then it hits the golden zone. Then it comes back up and it now sets a higher high, breaking the downtrend officially. And now it's coming back down to try to set the higher low. if it's capable of setting the higher low and working itself back up. There's only one way that it points and that points upwards. And I think that puts Google trying to go back up towards $410. And so my game plan when it comes to Google is actually to accumulate at these levels because look, I don't know if it's going to do it successfully. I don't know if Google will successfully find this higher low. And if it doesn't, it's gonna get bad. It's gonna be bad. It's gonna be bad. If you know, you know. like you're probably going to be looking at a Google coming back down towards $300. If it fails to hold support here, you're probably coming back to 300, then you're coming back to 270. So, it's going to get really bad really fast. The thing about that is though, I'm so willing to buy Google at those lower levels. I don't care. That's my spot. It's like, yeah, I'm willing to start accumulating now because there's two options. It's either going to bounce and start chasing down a new all-time high or it's going to continue downward and I'm going to really, really build up that Google position. I mean, the Google position is in profit right now, don't get me wrong, but it's not good enough for me to truly care, as we can see here. I mean, it's sitting at 3.8% profit. It was a little bit higher at one point, like 10 or 12%. But we're just slightly sitting positive right now. I have about $2,400 in market value. I'm more than willing to accumulate now. And if it continues to fall, let's say, you know, Google falls another 20% towards the downside or something crazy like that. I'm so willing. I'll probably put $10,000 in Google, $15, $20,000 in Google if I can buy it in the 200s, no problem. So, this is a win-win to me. I'm either going to win in the short term because I'm going to be right. It's going to bounce, or I'm going to win in the mid to long term because it's going to come down to these support levels, find support, and then try to bounce. Both of that is fine to me. So, Google is actually the most appealing hyperscaler to me right now because of the price action that it's giving me. Um, and so yeah, the story is very clear and that's why I tell you guys, right, just looking at the price, yeah, it'll give you some information, but once you know how to dig deeper and use your Fibonacci, use your golden zone, it makes it very, very much um more clear as to what's happening there. Okay, so that's Google. Let's go into Amazon. When it comes to Amazon, Amazon is a whole different beast. Amazon is a completely different story. Okay, because what Amazon has has done, I mean, is really it's outperformed the vast majority of the upper other hyperscalers. What you can see is that over the last, let's say over the course of this year, Amazon has been in a pretty clear uptrend, right? Pretty clear uptrend. It put in this low at the beginning of the year between February and April after it missed earnings here. It rallies all the way through March, April, going into Yep. going into May before seeing a bit of a pullback. Throughout May and June, it started to give us a nice little return back towards the downside. But the signs started to show here, right? the sign started to show right here and right here that something would potentially change for Amazon pretty soon because we were getting bullish divergence right here. But we were also back at the golden zone as you can see. Boom. So Amazon came back down to the golden zone right here. It found some major support and it started showing bullish divergence which was a sign and a clue like hey maybe want to start getting some purchases going. And so naturally we went in we did do a little bit of long-term purchasing for Amazon. As you can see here, the very first purchase that I did on Amazon would have been $750 worth of $233, which was right around there on July 24th as it was approaching that golden zone again. Okay. After finding that golden zone support, Amazon made a beautiful extension straight back towards the top side, pushing back up above and hitting a new all-time high and hitting the top side of this big old structure that it's been in for a while now. And so now that Amazon has made that move, I'm basically in like a full stop moment, right? I mean, it did exactly what I wanted it to in the short term. It came down to macro support. It pushed all the way towards the top side of the channel. Now it's getting rejected off the top side of the channel exactly like it did here. Exactly like it did here and exactly like it did there. And uh yeah, those are the first three times. And so right now the game plan for Amazon is extremely simple. Let's just let this thing pull back a little bit and find some support because that's all it's doing, right? What Amazon is doing is it's coming back down and it's trying to identify buyer side support because think about it, it took so much buying pressure, so much strength from the buyers to get back up towards the top side of this channel that I mean they exhausted all of their reserves. They completely ran out of gas. The second that they got to the top of this channel, they immediately ran out of gas and the price started falling. And so because they ran out of gas so quickly, what they're doing right now, what the buyers are doing is they're looking for some gas. They're looking for some support. They're looking for other buyers to step in and try to help them out to try to make another run back up towards the top side. And what I think is going to happen is that Amazon is going to start coming back down into some of these lower levels like 258, 250, 255. Maybe it got close already. So maybe I'm a little bit late on this one. But what I would expect to happen is that it's going to come down towards some of these towards some of these lower levels of support and try to use them to give you a bounce towards the top side. Now, will that be successful? I honestly have no idea because we are sitting at the top side of the channel and you're going to want to be careful. But nonetheless, it definitely could. And if you look at the 4hour chart, it's actually doing a really good job on the 4hour chart. I mean, we are seeing Amazon finding the support and using it to give you these little micro rallies every now and then. And so, yeah, I think there's a world in which it could try to do it from a more macro perspective and try to find a bit of support and try to continue back towards the top side. And so, because that's what Amazon is doing, I am in a full hold moment right now, right? I I I think it's reasonable to assume it could at least come back down to around 258 bucks to retest this previous liquidity right here and try to flip into support. But if we do see Amazon start coming back down towards some of these lower levels, yeah, I'd be willing to do a little bit of purchasing. Probably not a lot because I do see better um ROI opportunity in things like Google, which is in a much bigger pullback, or even a Microsoft if it does pull back towards some of these lower levels. But it still does look pretty appealing to me. So yeah, I would do some small dollar cost averages on Amazon if it does continue down into these lower liquidity levels trying to find some support cuz I do think it will do a good job at using that support to try to make another run back up towards the top side. Now look, there's a chance in which I'm wrong, right? And sure, if you actually look at the macro structure of Amazon, Amazon is in this ascending channel and I think there is a chance that one day Amazon does pull down out of this structure. So I'm definitely not going to be doing big purchases on Amazon. It would probably be maybe a little bit bigger than the Microsoft's purchases, but a little bit smaller than the Google purchases. But I definitely wouldn't be going like all in because look, I mean, look at where we are. Amazon is still in like the top half of this structure. The big purchases that I do on Amazon come at the bottom half of the structure or if for some reason Amazon starts falling out of this structure. I'd be doing massive gigantic purchases down here, I'm just not quite convinced we're going down there, right? So, because we're in again the top half of this structure, I'm not really going to be doing big buys. I would be saving my big buys for the bottom side of the structure, but I would be willing to do some small little accumulations, some small dollar cost averages just because I do think Amazon's going to try to find some some of this support and use that support to make another attempt towards the upside. And there can be an opportunity to build into a position at one of these local lows. Okay? So, I'll keep you updated on it. But all of these, you know, hyperscalers are in a very similar spot. Whether we're talking about Google, whether we're talking about Amazon, whether we're talking about Microsoft, they're all in a position right now in which they're coming back down and they're finding support. And I'm interested in purchasing them. I'm interested in buying Google at the golden zone. I'm interested in buying Microsoft if it does start to pull back towards the bottom side of this golden zone. I'm interested in buying Amazon if it comes back down towards the green zone because their prices are showing signs that support and buyer side pressure could be there to try to force the price back up, but also because I still have a lot of conviction in the long-term narrative. I have a lot of conviction in the long-term plane. I think that all of this news that we've gotten recently, [clears throat] especially that Nvidia news that we got um in which Nvidia secured all of that financing from the likes of Goldman Goldman Sachs, Black Rockck, etc. I mean, I think we're in a spot in which it's pretty obvious that the AI buildout is still continuing and the hyperscalers made it very clear to us that they are going to make a lot of money from this these investments that they're doing even though the market doesn't particularly believe it yet. And so, I really do believe in the long-term narrative and I'm willing to continue to build in these positions, although I'm positive. And look, it's not going to be easy, right? And I don't particularly want to buy Amazon when I'm currently sitting up. How much I'm up on Amazon? Let's see. Uh when I'm up 14% in two weeks, right? I don't particularly want to buy Microsoft when I'm sitting up 24 or something. Yeah, 26% in two weeks, 3 weeks. I I don't particularly want to, but I have to look at this from a more long-term perspective and go, "Yeah, I still think there's a lot of macro opportunity." And I am personally in the field of people who believes that one second, let me get this pulled up. um that you know we're gonna see Google for example I I think it'll be a 10 trillion dollar company one day. I think Microsoft obviously is going to be a $10 trillion company one day. I think Amazon's obviously going to be a$10 trillion company one day. I think they are all all three of these will obviously cross 10 trillion one day. Probably not anytime soon, right? But I think with in you know the next 2 three years you're probably four years maybe if we go through some sort of bare market like you're probably looking at these things pushing towards 7 8 9 10 trillion in market cap. And so the reward is still there and considering the fact that these are some of the biggest least risky companies in the world, it just makes a lot of sense. So that is a part of the reason as to why I am willing to accumulate outside of just what the technicals say. And that's something that I say all the time, right? Like yes, it is important to watch the charts. Yes, it is important to see the charts and understand what's happening on the charts, but you need to have the fundamental analysis to back up what's happening on the technicals because in my opinion, you shouldn't do technical analysis without having done fundamental analysis first. I I'm a firm believer in that because fundamental analysis sets the trajectory. Technical analysis maps the journey. And what I mean by that is I think Amazon will be a $10 trillion company one day and the technicals will show me what that path to getting there looks like. But if I didn't believe it was going to 10 trillion, I wouldn't maybe be confident to purchase in a moment like this. Does that make sense? So I'm not one of those people who says that technical analysis is bad because I think that's actually stupid. It's it's data. It's perspective. It gives you a much clearer understanding of the asset you hold. I think anyone should have at least base understanding of TA, but I'm also not someone who thinks that like technical analysis is everything. You need to use them in lock step with each other. And that's what I personally am doing with this. And so I'll continue to build this portfolio. So my goal is actually remaining about the same. Now that we're seeing a pullback in the hyperscalers, I am looking to get this up to a $10,000 position, but who knows where it goes after that, right? Again, if you see a Google, for example, coming back down towards shoot 200 in the 200s, guys, yeah, I'm probably going to put 10 $15,000 in it. I just couldn't really help myself, you know. So, I'll keep you updated on the moves that I make, especially as the week goes by because yeah, if we see Google pulling back, I'm buying. If we see Microsoft continue a pullback towards the golden zone, I'm buying. If we see Amazon coming back down towards these lower levels, I'm buying. So, I'm getting some cash ready. I'm getting ready to buy. And I'll keep you guys updated as I continue to do it. So, again, if you have enjoyed this sort of video, I know it's a little bit longer, but if you do like these more deep dive versions of technical analysis on some of the the stocks that I hold in my portfolio and some of your favorites as well, please do let me know. I'd love to do this once or twice a week just so that you guys can have a clear understanding and image of what's happening on these charts and how it's impacting my decisions. So, if you did enjoy it, again, let me know in the comments. Um, don't forget to smash that like button on your way out. And hey guys, I will let you all know I have an Instagram. I don't know if you guys use Instagram, but I have one. It's in the description. Feel free to go follow me if you want to see a little bit behind the scenes of my life. But all in all, that's all I got for you all today. Of course, I hope you guys do have a great Monday, and I can't wait to see you all in the next one. Peace out everybody.

Comentários 0
Entre para participar da discussão.
EntrarAinda não há comentários. Seja o primeiro a compartilhar sua opinião!