US Stock Market - S&P 500 SPX | Price Projections & Cycle Timing

- Retorno do vídeo
- —
- Chamadas
- 3
- Compra / Venda
- 1 2
- Publicado
Recomendações
Entrada é o preço de fechamento do ativo na data de publicação. Atual é o último fechamento registrado.
-
Entrada $713,44 22 ago 2026Atual $713,44 21 ago 2026Resultado +$0,00
818 they both turned up to very bullish on the QQQ and IWM
-
Entrada $309,35 22 ago 2026Atual $309,35 21 ago 2026Resultado +$0,00
There's Apple as bearish and you know, Apple's been under a lot of pressure uh as you can see there.
Contexto "There's Apple as bearish and you know, Apple's been under a lot of pressure"
-
Entrada $264,36 22 ago 2026Atual $264,36 21 ago 2026Resultado +$0,00
Texas Instruments is bearish also
Transcrição Completa
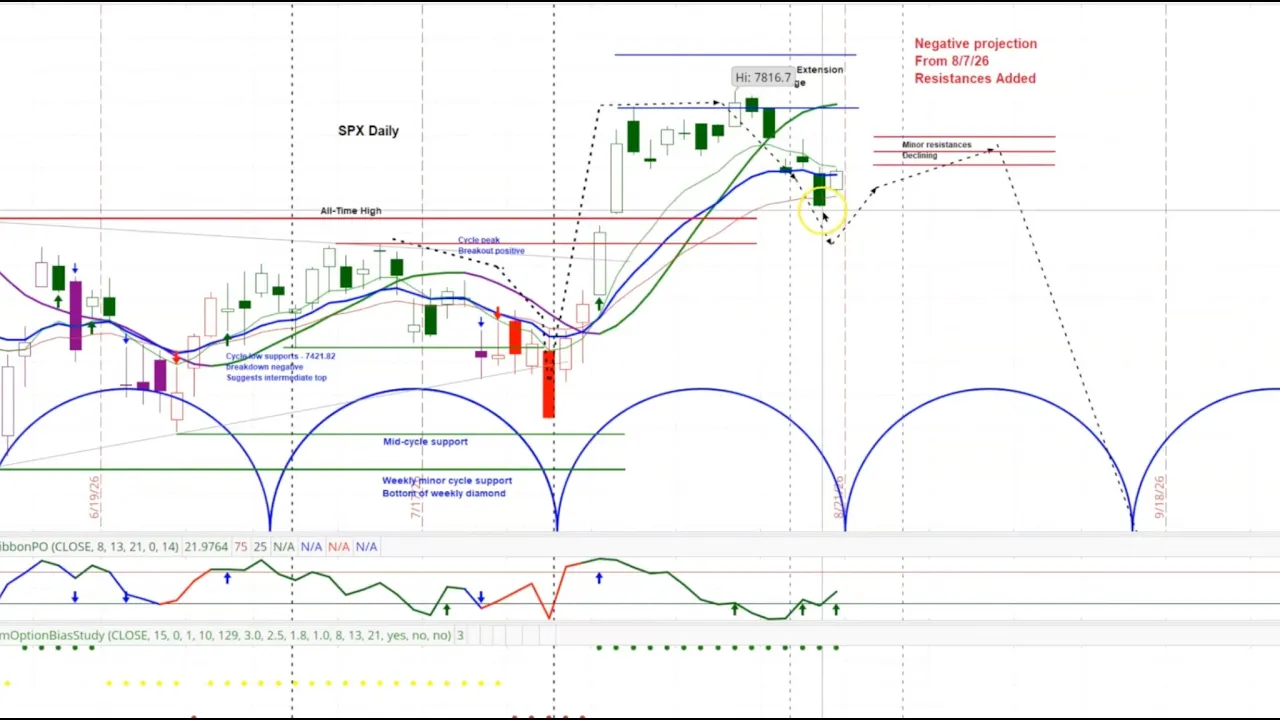
All right, this is the analysis in the stock market. We're going to look at the S&P 500 analysis and projections. Then we'll look at the MCM uh and that's our market condition monitor and take a look at what the market conditions are. Market is not telling us a ton right now. Uh I did projections 2 weeks ago where I showed you negative and positive projections and those projections are actually still live. I'm going to show you those again and there was really nothing to adjust. All I did was put in some resistances and overall those projections pretty much remain the same. There is a question though about the uh larger patterns and whether or not the corrective period we saw and then the breakout we saw on the upside ended or not. It's still a question. The market's going to have to tell us. Some weeks we can just scream and say this is what the highest probability is and some weeks we have to let to let the market talk. So let's take a look now as we uh switch over and look at the charts and this is the S&P 500. And we're looking at the weekly chart right over here and we're looking at the daily chart right over here on the S&P 500. And let's take a look at the weekly first because this is where there are questions. >> [clears throat] >> We had seen this diamond forming in here in the weekly chart and then we saw the breakout happen right here. Now when you get an upthrust like this, generally if it's solid, then uh what once you get past four or five bars and now we're only in the third bar right there, uh it's pretty much sure that it's a solid breakout. Uh there's still a few bars that could be in here what reverses to the downside and I believe that if the S&P 500, which you see got down almost to that top of the range. uh If that gets back into that range, it's not going to be a good sign and it's going to pretty much prove that we were looking for here. The move out into mid-September is on. Now, it's possible that this break right over here was the end of this whole pattern and then it's just moving up again. Based on valuations, I have a hard time believing that is the highest probability. Still, I'm going to let the market talk and let me know. You can see in here there are basically two scenarios. The scenario is that it actually came down and ended right there and is moving up again or the same pattern right over here just is in the process of peaking in these next few weeks. We'll see this drop sharply into mid-September, which was our original call. So, the I I I can't tell you what the highest odds is right now. Looking at this, what I can tell you is that momentum was negative, a correction occurred, the correction was sideways, broke out of this rectangular shape, and that's where we are now with momentum positive. This is a key. Momentum is positive, those are strong conditions. When I show you the MCM, you're going to see that's the condition that exists. Is there still risk into mid-September? I don't know for sure. I just have to wait and see what the market says, but I will show you those scenarios right now. But before I switch out of there, a quick look at the Nasdaq right over here and you will see that what we have are these multiple sell signals right over here and another failure this week, and this may be telling us that where we have a possible trough right over here, that low, that these next several weeks could see this downside move into mid-September. So, the Nasdaq is much more the shape we were looking for, but then it did have that earlier trough and moving up. So, again, we're not exactly certain what this is telling us. We're going to have to let the market speak. Let's take a look here at the daily chart on the S&P 500. Now, this is really interesting because let's just look at these last few cycle patterns right in here. You can see these rhythms right in here and how they work. And what we were looking for on the S&P 500 was that it would have a corrective period here into August and then another rally. So, the next week is very important to this analysis. Let's review the projections that I put out there on 8/7. So, this is where the market is right now and getting into this period where it's likely that it's going to have an upward turn. Now, we don't know for sure that the upward turn is going to come. That it's coming now or it might be 3-4 days out yet before we actually have this corrective period ending. Now, note, there's a lot of things in here that are positive. The slim ribbon right in here, positive. The slim ribbon PO giving you these beautiful signals in here of upward resumptions. The option bias indicator here telling you that the long side is the right side. All of those things positive on the short term right in here. Uh so, even if the market does take another couple of days, uh it's likely there'd be another rally. And then we see if we're going to get that top that takes you out over here in this decline, out into September. Let's take a look at those projections that we did 2 weeks ago that actually hold up pretty well right now. So, this is the positive projection that we put out on 8/7. I didn't do anything with these lines other than putting in where these resistances are now. >> [clears throat] >> So, if it's the bullish scenario that I talked about uh on the weekly chart, then this is what would happen. Because this formation is so positive right over here, it projects going to test the high or a higher high. It would then get through these minor resistances that you have right over here fairly easily. And then you'd have this cycle pattern out into September forming in a positive way, as you can see. Now, the corrective period in here could be deeper, you know, something like this. It could be shallower. We don't really know for sure, but this is the positive scenario. This is the one that we put in there on 8/7. I didn't change it at all. This is the resistances. That's the only thing I've added. Now, the negative scenario that I gave you on 8/7, August 7th, is right over here, which basically allowed for the same thing we're seeing now. And you can see I didn't change the lines at all. Just followed it nicely. It just, you know, not quite as deep as it could have been here. Then the question is, will the next rally get up into these resistances and then fail? So, that would say that, you know, you'd bounce around in here somewhere. You probably would not get above 7746, uh which is about, you know, 50-something points higher than we are right now. And then this is the risky period out over here where the market potentially could decline sharply out into this mid-September period. So, these are the same projections that I put up in 8/7. You can see how the market followed very nicely. Uh and now we have those two scenarios. The negative scenario right over here and the positive scenario right over here and where the market conditions are right now, which is the scenario right over here. So, question, you know, let about the market condition, we're going to let the market tell us. A very important to understand that when the market conditions are positive, as we see right now, the declining phases in the cycles are shallow. You only get pullbacks into the resistance areas onto the support area, sorry, and they don't break into them very deep and then the market then turns up again right as you see right over here. Question is, what will that upturn look like? And that will tell us. So, that's why I said this next week is very important to the analysis and I wanted to review the projections about which I did 2 weeks ago and I think that shows you that so far what's happened has aligned, but we just don't have the message yet whether this is the important trough on the weekly chart or that is yet to come. And if it's yet to come, then outside of next week, which could have some attempted upside, the market would have a lot of risk in the next few weeks in the downside. We're going to learn a lot. I can't say to you, "Wow, I think this is an extremely high probability." It's not right now and my whole team looks at this and says, "We need to let the market tell us what these conditions are because there's just too many unknowns right now and right now the conditions overall are positive on the longer term, though on the shorter term, they're starting to get neutral and I'll show you how I know that and we'll take a look here as [clears throat] we look at the market condition monitor. So, this is our fantastic application. There's over 350 symbols in here and you can really see how market conditions are existing in different time frames and how they're actually changing, and you can be notified on that. So, let's just look here. You can see the intermediate right there on this market condition monitor. I'll just get the four indexes here. They're all in the intermediate very bullish. They were bullish. 811 it turned up to very bullish on SPY and 818 they both turned up to very bullish on the QQQ and IWM and the Dow on 821. All of those turned up to very bullish as this market has been strong. Of course, the spy much earlier than any of them. Now, on the intermediate right over here, let's take go from intermediate to short-term. You can see what's going on and that is we've got some of the real short-term indicators in the two hours starting to turn negative and that has turned the short-term neutral. Now, if you were using this application, you'd probably want to get notified when you started to go negative in here and you could just do that by clicking on here. I had it set to tell me when it turned to neutral, so I'm just going to switch this over to slightly bearish right there. Well, I'll unclick that and then you can see that I have it set in there. So, you you can really use this and you can use this on all the stocks the same way to get notified as things change. So, right now the short-term conditions in here are neutral. The Dow was slightly bearish and then today it turned back to neutral. So, overall this is the kind of conditions we're in. Intermediate look positive. We have neutral conditions on the short-term. Now, if I look at the near-term, this is just over for traders that trade for a few days swing trade. You can see again, it's neutral when you look at that. Now, when you start to get these to bearish and very bearish, it's like a domino effect. They will then be affecting the short-term and then you'll start to see things go negative. This is what you really want to watch. Let's just take a quick look at the individual stocks in here and uh by the way, this is the change log as things change in here so you can watch that also, which is very helpful. Let's just take a look here as uh I switch over to uh look at the trade conditions and the ones that are very bullish. I'll just scroll down a little bit in here and you can get a look at those as I move this down. Uh you can see the ones that are very bullish in there on the short-term. And uh these are of course stocks that if you've been trading them on the long side, you've done very well. Now, the ones that have turned to very bearish, let's see how they have done. You know, the market just had uh a week that started to turn down after a big upside surge the previous week. Let's take a look in here and you can see the ones that are very bearish in here and this is really so helpful to you and that's why it's important uh that uh if you want to try out our our information. If you take advantage of this level four special that we have going on right now for $99, you're going to get this application and it is really so helpful uh when you look at that. So, uh you can see in here all of the things in here that are very bearish. Interesting, a lot of utilities are showing up right here as very bearish. There's Apple as bearish and you know, Apple's been under a lot of pressure uh as you can see there. And that interesting, Texas Instruments is bearish also. Yes, the semiconductors uh have gotten sloppy again. So, that's the ones that are very bearish right there. So, just click here on symbol and you get that set up back where you can look at the indexes right there. That is the MCM and I hope you find that extremely valuable. That again is our look at the stock market, the S&P 500, which we're waiting for it to speak to us right now and I gave you those scenarios. And that is our look at the stock market and the look at the market condition monitor. This is a time when we want to let the market talk to us. We have a lot of conflicting stuff going on right now. And the potential for risk on the downside to really be what plays out or the potential for market to show us continued strength and fight all the reasons that are out there that the market is overvalued and should move down. Whatever Whatever you see there right now, let the market tell you right now when you're a period where you don't know, it's time to trade your smallest units. That's what we always talk about is varying your unit size based on your confidence level, based on what everything is telling you. Right now, in my opinion, unit size should be the smallest that you trade.
Comentários 0
Entre para participar da discussão.
EntrarAinda não há comentários. Seja o primeiro a compartilhar sua opinião!