Worried About a ‘Lost Decade’? (Watch This Before You Panic)

- Retorno do vídeo
- —
- Chamadas
- 1
- Compra / Venda
- 1 0
- Publicado
Recomendações
Entrada é o preço de fechamento do ativo na data de publicação. Atual é o último fechamento registrado.
-
Entrada $292,66 25 ago 2026Atual $292,66 25 ago 2026Resultado +$0,00
like a QQQM or SCHG or VGT or these types of ETFs
Contexto "like a QQQM or SCHG or VGT or these types of ETFs."
Transcrição Completa
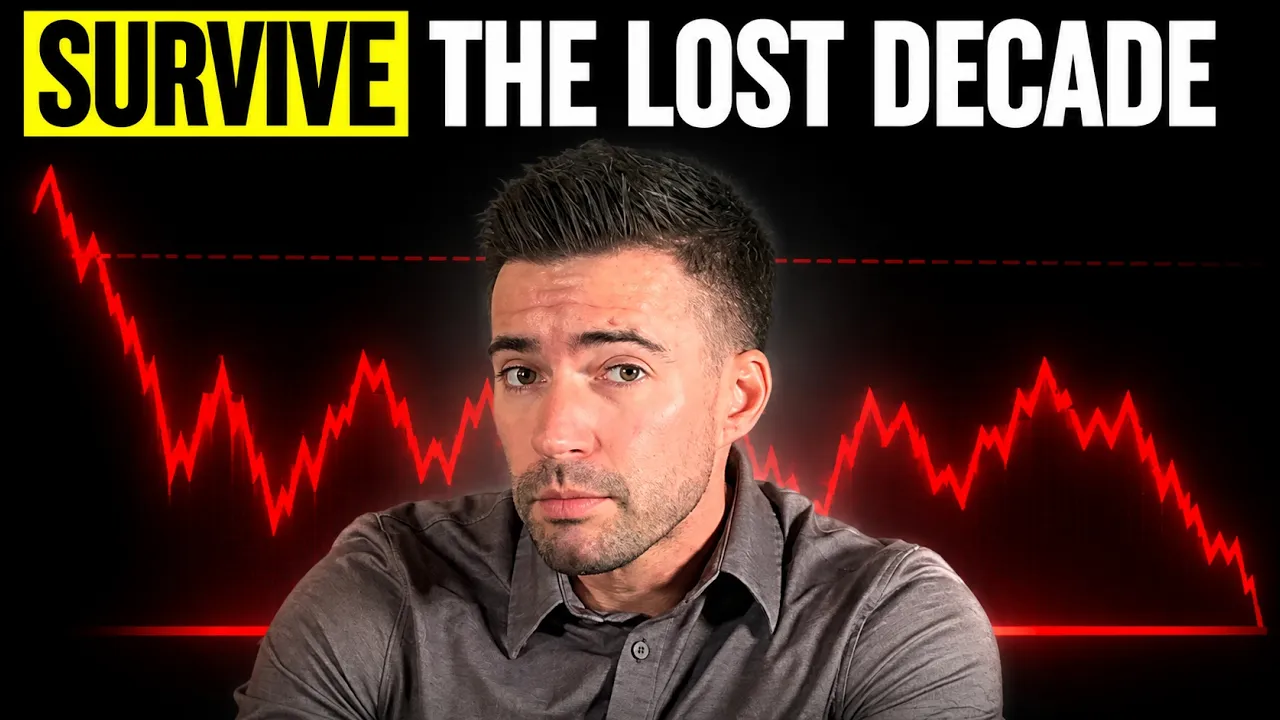
What if I told you that the stock market could go almost nowhere over the next 10 years? Not crash for a few months, not have one bad year. I'm talking about an entire decade where you invest your money, wait and wait, and potentially end up almost exactly where you started. It happened before. And with valuations at where they're at today, there are some very smart investors warning that the next decade could look very different from the incredible run we've gotten used to. Let me clue you in on a little secret, though. A lost decade for the stock market does not have to mean a lost decade for you. Now, in this video, I'm going to show you exactly what happened during the worst lost decades in market history, what happened to someone who actually kept investing through them, and most importantly, five things you can do right now to prepare your portfolio if another one is coming. Because the goal isn't to predict the next crash. It's to build a portfolio that can survive it and potentially come out significantly stronger on the other side. My name is Nolan Goa. My students call me Professor G and I made this channel to make investing simplified. Remember that all investing carries risk. So do your own research. This is not financial advice and I'm not a financial adviser. Imagine if you had invested $10,000 right before the dot bubble, right in like 1999. 11 years later after the dotcom crash and the financial crisis, even with every dividend reinvested, you'd have only about $10,460. That's why your investing time horizon matters. Now, that was one of the worst time periods in our entire stock market history as far as investing. Let me give you the more accurate data as to what is probably going to happen, what has happened over the last hundred years so that you can make a little bit better of a decision and not just go based off of fear because everybody on YouTube is trying to scare you because that's what's definitely going to get the most clicks. And now I understand that I am a YouTuber obviously and I am trying to get people to click in on the video. But what I try to do in all of my videos is set you up for success and give you not just the scary headline or what could happen, but also how to prepare for it or how to make sure that you're going to be able to survive through it. And honestly, you're going to be totally fine. So, let's talk about this. Over the last 100 years, the average bare market falls for roughly 10 months. But from the market peak all the way back to break even, investors have historically waited closer to 2 and 1/2 years. like from the peak to the bottom takes about 9 to 12 months on average. Hartford funds and Ned Davis Research puts the average bare market at 289 days, which is about 9.6 months with an average decline of about 35% since 1928. From that bottom, the absolute bottom to the previous high, so back to just exactly where it started, typically takes another 1.5 years. So all in all from the peak down to the bottom all the way to back even is roughly 2.5 years on average across commonly cited S&P 500 bare market data sets. And now along with that here are the five most harsh and longest bare markets in its history. The first one was the Great Depression in 1929. The peak decline was 89% and it took about 25 years. Then we had the 197374 stagflation at negative 48% and that took about seven years, seven months. The dotcom bubble was a negative 49% that took a little over 7 years. The global financial crisis then was a negative 57% that took about 5 1/2 years. Then there was that 1968 to 1970 bare market with a negative 36% drop and that took about 3 and 1/2 years to get back to normal. Now, all of that was as if you put money into the stock market into the S&P 500 or solid index like that and didn't reinvest dividends. But let me show you what happens when you do reinvest dividends. It shortens that break even substantially. Like the Great Depression, instead of it taking 25 years to get back to normal, it took only about 15 years. That second one took about 7 and 12 years without dividends reinvested, but with them reinvested, it took four years. The.com bubble was six years rather than seven. The financial crisis was about four and a half years rather than five and a half years. And then the 1968 to70 bare market was about 2 and 1/2 years rather than 3 and 1/2 years. So now I just wanted to show you that to show you these are the worst ones that we've ever seen in history. Most likely we're going to see more like the average that I was talking about from before. A bare market that does happen lasts about nine months or so and usually takes about two years in general to get right back to it. Which is why I always tell you to have at least three years worth of cash if you're a retiree and you're depending on your investments based off of those averages. But let's go back to that last decade because the Great Depression was a once in a millennia situation that I do not think we're going to see ever again. But a lost decade is something that is definitely possible. Remember though that the last decade wasn't just one big crash and it took 10 years to get back. It was actually two huge crashes. And that's why it took so long. If you invested $10,000 into the S&P 500 on December 31st, 1999 and left it invested through December 31st, 2010 with dividends reinvested, it would have grown to about $10,460. Like I said from before, that's only about a 4.6% total gain over that 11 years. essentially a 0.4% annualized return before inflation. The problem was that you got hit with two enormous bare markets. From 2000 to 2002 was the dotcom crash. There was three consecutive negative years. 9.1% 111.9% and -22.1%. Then the market started to stabilize a bit. It actually started coming back. But then we got hit with that 2008 financial crisis which was another negative 37% year. There were strong rebounds as you can see in 2003, 2009, 2010 and that ultimately got the investment slightly above where it started. So in total during that period had you invested in 1999, you basically made nothing over that period. But what if you did what I always suggest, which is just a dollar cost average, rain or shine or whatever it may be, get that money in month after month, no matter what. What if you started at that $10,000 and you put $500 a month in throughout that whole period? What happened then? So, the initial investment was $10,000. You put $500 a month in. The total monthly contributions was $66,000 and total money in total was 76,000. The portfolio then at the end of 2010 was $89,600. An investment gain of 13,600. A $13,600 gain on $76,000 total invested is a 17.9% total gain. 17.9% total over a 10 or 11-year period isn't very solid, but it's also not nothing and it's definitely not negative. And here's the biggest thing that people actually don't understand. At that point in 2010, when things came back to where it was in 1999, that was actually the start of one of the craziest bull markets in history. But most people that had brought their money out of the stock market because they were scared during that other period didn't get their money in in 2010. It took them a couple years to put it in. So, let's say that you had done what I talked about from before. You had invested that $10,000. Then throughout the whole loss decade, you put that $500 in each month. And now, sitting at the end of the last decade, your total is at $89,600. But what if then you didn't put another dollar in? All you did was reinvest dividends from then all the way till now in mid 2026. That $89,600 would be worth approximately $735,000 today. So we're talking about roughly $76,000 of your own money turning into $735,000. That's approximately a $659,000 investment gain or about $867% above the total dollars contributed. So that's the lesson of the last decade. The biggest mistake wouldn't have been investing in 1999 right before the crash. The biggest mistake would be not having stayed invested in 2010. So how do we actually prepare if this is a possibility if we could see a very big crash which then leads to a couple of year journey to getting back to normal but then another big crash happens. So yes, we might see another lost decade at some point in our investing careers. How do we actually prepare for this? You don't prepare by trying to just predict when it's coming. What you do need to do is follow a very strict set of rules and you build out an actual plan. So, here are my five that I think that you should definitely consider. Number one would be diversify beyond yesterday's winners. The S&P 500 can still be the foundation, but consider exposure to small cap or midcap international value/dividend, maybe some growth, and depending on your situation, maybe bonds or other defensive assets. The.com era showed what can happen when one expensive part of the market dominates your portfolio. That's kind of what this whole channel is all about. I talk about my three or four fund portfolio. And what I'm trying to get you to figure out is make sure that you have different categories of your investments. Have some stuff that follows the basic market like the S&P 500, the total US stock market, maybe even total international market. That would be the foundational section per se, but then you should have stuff that's safer like an SCHD, VM, VTV, value style or dividend style ETFs. and then also maybe have something for higher growth so that in the good times it actually increases much more like a QQQM or SCHG or VGT or these types of ETFs. Number two, keep investing during the bad years. A lost decade is much worse for someone who invests at the beginning and then stops. If you're still accumulating, prolonged weakness means your contributions and reinvested dividends are buying more shares at lower valuations. This always baffles me. You do a bunch of research. You understand the ETF or the stock that you're invested in. You're excited to buy it at call it $250 a share. But then when it drops to 200 or it drops to 150, you get scared and you say, "I'm just going to wait." Or even worse, you sell out of it. To me, when I've done that research and it drops that much, it's a no-brainer. I'm throwing some money in there, or at the very least, I'm dollar cost averaging as it's dropping, knowing that it might even drop further. But all that presupposes that you've definitely done your research. So make sure and take some of the things that I have to say and other people that you trust that have shown a proven track record and then do your own research yourself. Number three is just to reinvest dividends. Even if prices go sideways for years, businesses can continue paying and growing dividends. Those distributions buy additional shares and can meaningfully shorten your personal recovery period. That's why I showed you those five largest dips or five largest market crashes and and longest times to getting back and showed you how it was without dividends reinvested versus with dividends reinvested. Obviously, the dividends reinvested made it much shorter to get back to where you were. Number four, keep enough cash outside the market, especially near or in retirement. You don't want a 40 or 50% crash forcing you to sell stocks to pay your bills. an emergency fund and potentially several years of safer assets for retirees can give equities time to recover. In the video that I'm going to link to at the end of this video, it tells you exactly what to do in retirement and how to use different buckets to be able to be safe no matter what happens in an up market, a down market, whatever. But no matter where you are, even if you're not even close to retirement, having an emergency fund off to the side is very, very smart. Number five, don't abandon the strategy halfway through. This may be the most important one. A lost decade doesn't mean stocks fall every year for 10 years. There can be enormous rallies along the way. Missing the recovery because you finally gave up after years of frustration can turn a temporary problem into a permanent loss. So, this video that you just watched is half of the equation. If you're nearing retirement or definitely in retirement, this video here is the next one that you need to watch to get that full picture. Like I said, it's going to tell you exactly what to do, where to withdraw. based off of the market going up, market going down, or even going sideways.
Comentários 0
Entre para participar da discussão.
EntrarAinda não há comentários. Seja o primeiro a compartilhar sua opinião!