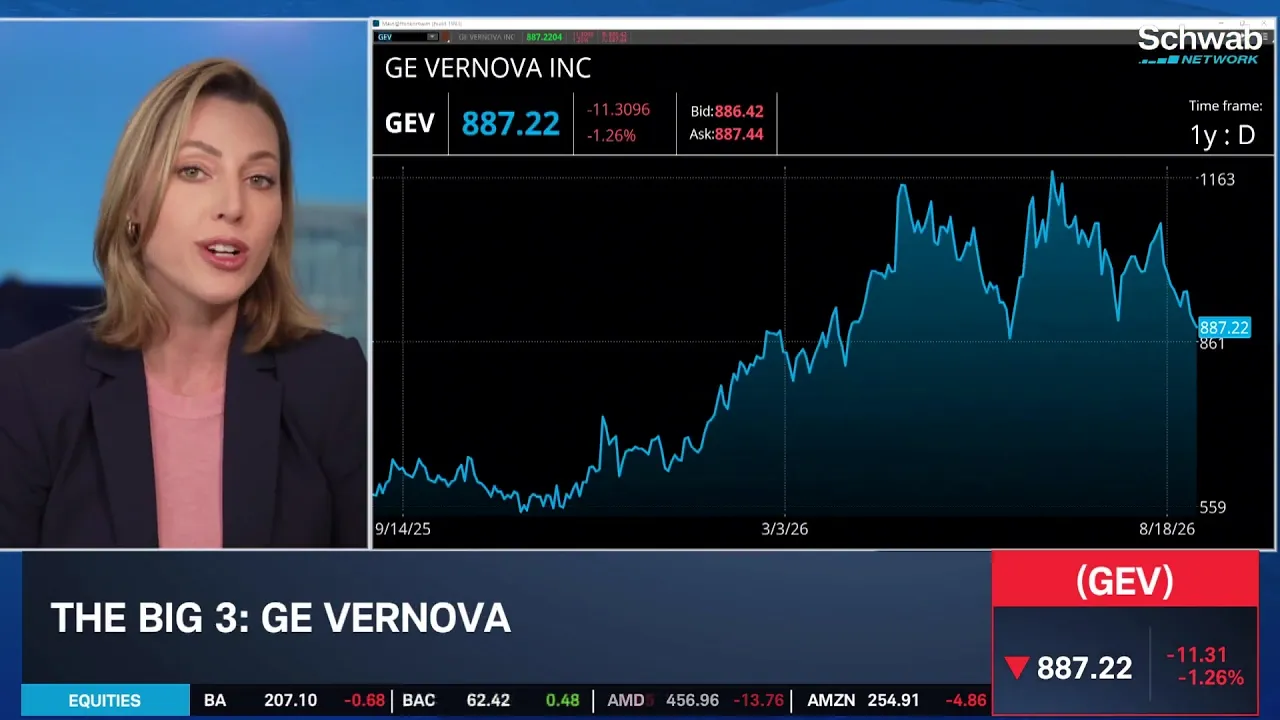
GE Nova was very high on that list with the total debt percentage of assets being at 3.53%, free cash flow quarter over quarter growth is 7% positive EPS revisions.
Contexto
"So for my stock picks for today... GE Nova was very high on that list..."
This is a great way to get exposure to a really a broad portfolio within BlackRock.
Contexto
"This one the total debt as a percentage of assets is 8.5%... This is a great way to get exposure to a really a broad portfolio within BlackRock."
those revisions are up over 10%. So even though the one month return is a little low, that to me is showing me that earnings estimates are climbing. And that's what I call attractive valuation
Contexto
"those revisions are up over 10%... And that's what I call attractive valuation"
Transcrição Completa
get your podcasts. Welcome back to trading 360. I'm Marley Kayden. It's time for the big three. We've got three stocks three charts for you today. Kevin Horner taking us through those charts here to take us through the trades is Jessica Inskip director of Investor research@stockbrokers.com. Great to have you both on. Jessica would love to start with the big picture thought here as we kick off a new month of trading. Yeah, Marley, I think that the market actually has a ceiling on it due to what's happening with oil and subsequently yields. And it's very interesting to me because yields on the Treasury and on the curve are really showing us investor demands, which could be related to growth, inflation, geopolitical geopolitical risk, which is adding term premium to the long end. And then of course, fiscal policy. So the known is that there is a lot of risk and it's creating a ceiling in the stock market with those yields. But then the known is is we're paying more attention to debt. And so that's where I'm really positioning my trades. And what I think is interesting is we need that clarity, we need that certainty that maybe the jobs report that may be better AI revenue and earnings. We've got some later on this week and even this evening. And that may even be just some relief from geopolitical tension or a combination of that. So a lot of uncertainty to digest. But it's the bond market that I'm really paying attention to. All right. So let's dive into your first pick today. You've got GE Voronova there outperforming the market year to date. But they've lost some of that momentum recently. So how are you looking at GE Ivanova right now? Jessica. So for my stock picks for today, Marley, I actually wanted to take a look at some fundamentals, but add an additional layer due to what the market's paying attention to. So I actually pulled a screen that is based on free cash flow showing quarter over quarter growth earnings per share, showing a 30 day revisions of being positive as well. And then I looked at that relative to a return and then ranked it based on the total debt as a percentage of assets. And GE Nova was very high on that list with the total debt percentage of assets being at 3.53%, free cash flow quarter over quarter growth is 7% positive EPS revisions. But you're right, trailing from a month. But that tells me fundamentally it's healthy from a balance sheet, especially if I'm looking as debt. Now more onto the investment thesis there. We've talked about GE Nova before. They have an AI infrastructure tailwind. They've got new power systems that supports this continuous, stable electricity required for AI data centers. They're a part of the global grid expansion. They've got new projects in the UK, even South Korea, which is helping upgrade those power grids worldwide. Wall Street is still bullish. There are lots of price targets that are well over $1,200, and earnings are looking to accelerate into next fiscal year. It's predicted to rise from 15.17 to 2514 as that backlog converts over to revenue. All right Kevin, so as we dive into the technicals on this one and we look out over the last year, I mean easily outperforming the markets, it's up about 45% in the last 52 weeks. But what are you seeing in terms of the technicals. Yeah you're right Marley. It's been a really nice uptrend for the majority of the year. But what we're witnessing now is a pretty healthy pullback to an area that could easily be considered short run and intermediate term support. To be honest, what we're looking at now is a pullback of about 2,526% off the most recent high early July pulled back to the 200 period moving average right around 880. It's also the lower band of the one year linear regression channel I've drawn in. And you know, that provides some confidence for traders looking to join the trend at what they consider to be perhaps a low risk area. After a 25% drawdown. The downside in the intermediate term could be relatively limited. It's always nice when you can apply some fundamental story to one of a technical nature, with a stock that's showing a potential for short run support here. So the daily looks like an uptrend that has waned in the most recent two months, but ultimately could be an area of short range support. So let's zoom in though a little Kevin, and take a look more at the near term here. And some of the technicals we're seeing as we're looking at what could be that healthy pullback. And walk us through what you're seeing there. Sure thing. So what this is going to show is a 90 day window of basically just going sideways within a pretty clearly defined range. 880 the low range of support. 1180 the highs we achieved there in most recently, like I said, late June, early July, excuse me, but ultimately a 300 point range. And I put the midpoint in there as well because it's not uncommon to see a move halfway up the channel or the range we've been in, and find that to be a supportive or a resistant area one way or the other, depending on the price action. So I think that holds to what we've been seeing over the 90 days is basically this 300 point range. And again, if you're the longer term trader, that daily chart can appeal to you. But if you're the shorter term trader, this 90 day view makes it seem as though we're sitting on, again, a low risk area, short run support. We are in oversold conditions relative to the RSI, but we know that that doesn't mean it bounces imminent. It just means this is an area where a bounce may come into play and again, offer short term bulls in an area for exposure, but with limited downside risk should they choose to move on. If this were to break down aggressively under this 880 area. All right. And right now, as we look at G e voronova, we're at 88523 is down about a percent and a half today on the session. Do you want to move to your next one though. We've got BlackRock here. Very different chart much more volatile flat pretty much on the year here. What are you seeing in BlackRock. Jessica. So again fell on the same screen. And I have these in order of total debt as a percentage of assets. So it's getting a little higher as we go down the list. This one the total debt as a percentage of assets is 8.5%. They have really high free, free cash flow quarter over quarter growth. I had to double check those numbers of over 77%. So that may not necessarily be sustainable. Still, some positive 30 day revisions to their EPS estimates and the one month return. It's like you said, relatively flat, still positive in comparison to the previous. Now they are more attractive from a valuation perspective. Trading under 21 forward p e ratio, they've got 59% current year EPS growth. A lot of that has to do with the private market expansions. Remember they are associated with Nvidia is doing in the financing aspect. So this is a great way to get exposure to a really a broad portfolio within BlackRock. But they have potential partnerships even in line with Mitsubishi, which could strengthen their position in Japan's growing private credit market. Analysts are still really bullish, but the cash flow is strengthening. And that's what I'm paying attention to as I'm adding this layer onto my stock picks is, again, from a macro perspective, we're paying attention to the debt markets, which means from a macro perspective, we need to add on that layer as well. All right, Kevin, so then let's dive into this chart here. I mentioned certainly a very different looking chart than the last one. More volatile. Lots of highs and lows. But overall I mean up 5% on the year. So underperforming the market. What are you seeing in the technical setup. Well a really great move though since late June early July. So we've seen about a two month rally where we rallied 25% up to that 1185 ledge. We've pulled back from there. And now this looks like what in the intermediate or shorter term window could be viewed as a zone of support. And I've got a couple of levels to monitor. So we've got the 20 day right above us. Having taken that out with today's action, the the last line of defense actually short term at least could be today's low. So interestingly enough, today's low represents the 23% retracement zone, which is coincident with the bull flag breakout we made in late July, early August to those 1185 peaks. But the level below that that really calls out is 1100. Nice and supportive. It was the mid high of this weakening area for a lot of the last year. So May's peak was right around 1100 as well. That's also the 38% retracement of this move up off the June lows. But also look at that 50 day moving average below it and purple. That's catching up to that 1100 ledge, possibly providing additional confluence of short range support. So we're monitoring that as well. But it is nice to see that 50 day crossing, the upside crossing to the upside through the 200 day, giving us the so-called Golden cross here over a longer term time frame. But we're clearly seeing just a little bit of a breather after after a fantastic short term move. We probably should not be surprised to witness this level of a pullback following a move of that nature. And Kevin, can we zoom in a little bit on the rally and the pullback and look more closely at some of those levels that you were just highlighting there? Absolutely. So what I've got next is a 90 day chart once more, going back to essentially July 1st and looking or June 1st excuse me, and showing that we've got this uptrend in place. I'm using linear regression for a couple of reasons. But notice that 1110 ledge once more, the 200 period sloping moving average upward through that area. And the midpoint here of the linear regression channel, the line of best fit all of that confluence of data coming together at about 1100 again strengthens that price ledge for us. So we're looking a little oversold on the RSI. And yet we know doesn't mean a bounce is imminent, but it's at least supportive of 1100. And certainly as always with the technicals, the reminder needs to be that it doesn't tell us what's coming next. It just helps us understand how to manage that risk. So if we get down to 1100 and bounce, well, then that gives traders a good way to manage the risk at that 1100 ledge. But of course, a move through 1100 means that we probably witness additional short term weakness. And bulls should be prepared for that as well. So that 1100 is going to be a pretty crux price range for BlackRock here in the near term if we visit it. And right now we are about $37 north of that level. We're at 113703 down about 1.6% today. Now your last one is the clear outperformer in terms of price action. We're talking about Western digital up, you know, a measly 468% in the last 52 weeks. Jessica. So take us through your thesis on Western Ditch. Yeah, it's very interesting that it's the outperformer. And as we're increasing in total debt to percentage of assets. So it's interesting because that might relate to the pullback. Their total debt as a percentage of assets is about 8.6% slightly under. They have positive free cash flow quarter over quarter growth of about 30%. They're really the key data point that caught my attention, though is the EPS estimates over the past 30 days. Those revisions are up over 10%. So even though the one month return is a little low, that to me is showing me that earnings estimates are climbing. And that's what I call attractive valuation is I like to look at the price relative to the estimates and the delta differentiation, rather than just a p e ratio altogether. Let's look at the numerator and the denominator if you will. We know AI is driving chip flation quote unquote. There is surging memory demand which is pushing those prices higher. So I think if we pay attention to what's happening to Dell today, that's going to feed into what's happening with WTC as well, because that's accelerating purchases of PCs, servers or storage systems, servers, services. So it's important to pay attention to that. But it's the analyst estimates that are climbing a continuation of that, but a continuation of demand as well. All right Kevin. So let's look at this chart because obviously Western Digital has been an outperformer in the entirety of the market. But as Jessica highlighted, we've also seen a pullback in this name as well. So walk us through the technical setup here. Yeah you're right. 50% drawdown from the 52 week high or the all time high down to the low we made in August 6th. Not a great move. Obviously you hate giving up 50%, but the ledge at 425 short term support does seem to be pretty notable. And yet it's difficult for traders to be comfortable here because of the proximity to the 200 day moving average. It's a mere $57 beneath us at 425, so we have to pay attention to the fact we're six weeks below that Downsloping now, 50 day moving average comes in today at about 520 or so, but we've been below it, like I said, since July 15th. And that's notable because we've attempted three separate times prior to this breakdown that we've seen to rally into the 50 day and try and get back above it and have failed each of those instances. So 425 could be short run support. If not, then the potential exists to visit the 200 day around 370. Beyond that though, the chart here is just telling us that we don't have a lot of clarity about the current range when we look at it on the daily right now, just the weakness associated with six weeks below the 50 day moving average. So let's look at that 90 day chart then, Kevin, if you have it, just take a look at some of those tests where it's tried several times and failed here. Yeah. And it's, it's just taking again into account technical analysis 101 stuff. After the move to the upside, we broke down. Now on this chart we're using the 200 period moving average. Again it's a 90 day window for our bars. But we broke it in early July here. So if you were an intermediate term trader on the daily chart, you may not have seen this for another week. But if you were watching it on the 90 day window using the 200 period moving average, we would have caught this maybe a week early here. And we've basically been below that 200 period outside of a couple of one day above it here in mid August, but it's just been making lower highs and and granted matching lows at 425. So could we be holding up here. Sure. But I'd say that the trend is unclear outside of the fact that we've come into this in a downtrend and we're trying to consolidate. And so as much as we want to be bullish when you come into a move of this nature so aggressively to the downside, it's doing so with the deep bearishness. And that really puts the onus on price action. And I think traders would be well reminded to take the approach that says, hey, make price dictate whether or not you're choosing to do something different here because we just haven't seen it right yet. If we can get above 490, I think traders are going to be a little bit more willing to take on an opportunity. But in the near run here, 425 still remains a very important short term area for support right now at 45361, but with a 16% pullback over the past month. Really appreciate you both being with us for big three today, Jessica Ins

Comentários 0
Entre para participar da discussão.
EntrarAinda não há comentários. Seja o primeiro a compartilhar sua opinião!