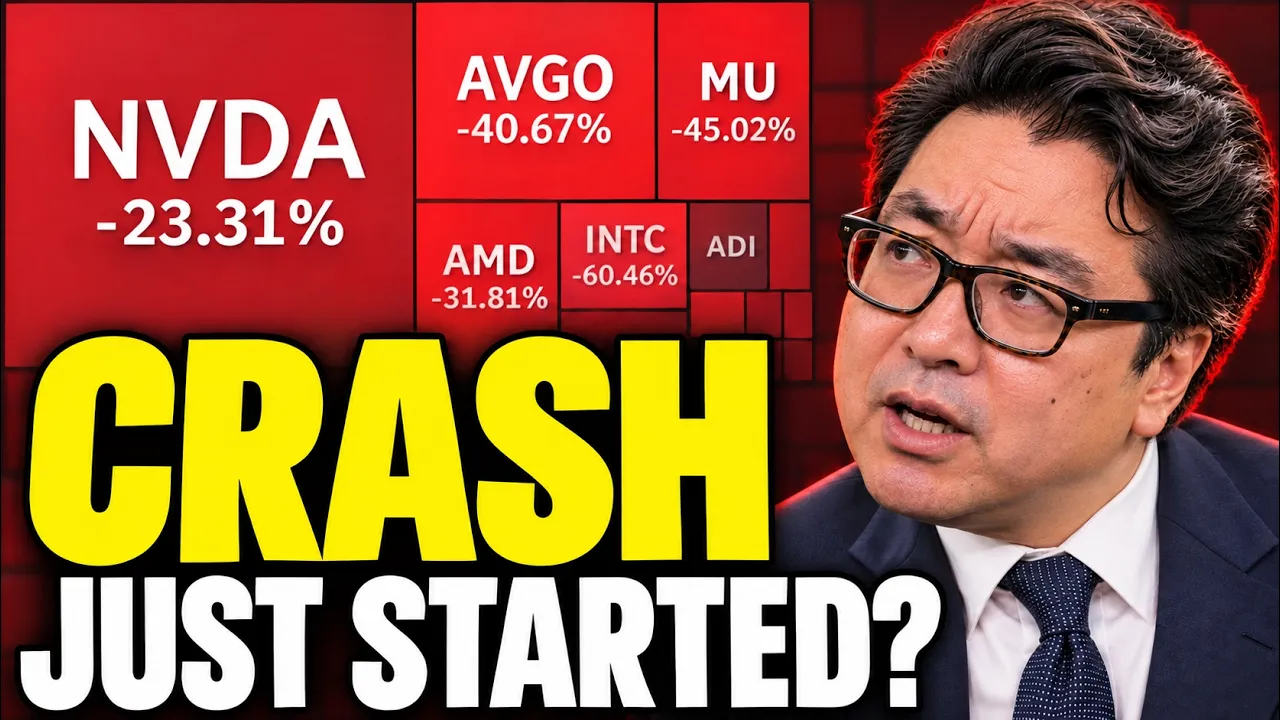
AI Stocks Are Crashing — My #1 Stock to Buy Monday

- Retorno do vídeo
- —
- Chamadas
- 2
- Compra / Venda
- 2 0
- Publicado
Recomendações
Entrada é o preço de fechamento do ativo na data de publicação. Atual é o último fechamento registrado.
-
Entrada $40,31 07 nov 2026Atual $40,31 06 nov 2026Resultado +$0,00vs. índice +0,0% SPY +0,0% no mesmo período
Citar esta recomendação Ver trecho original (1155s) *
Contexto da transcrição original
…so points to a fairly measured recovery opportunity. For me, the next report needs to show that stronger product demand is translating into durable earnings and cash flow. Quarterly beat positive step with a lot still resting on execution. I'd consider Novo for a small patient recovery position. The low multiple in income appeal to me, but I'd leave room to add at a better price. My conviction is below the leading opportunities today. We then move on to Uber trading around $68 is down 16% year to date, down nearly 30% from all-time highs at $95. What interests me most is the cash generation behind the price. We've …
I'd consider Novo for a small patient recovery position. The low multiple in income appeal to me, but I'd leave room to add at a better price.
-
Entrada $68,59 07 nov 2026Atual $68,59 06 nov 2026Resultado +$0,00vs. índice +0,0% SPY +0,0% no mesmo período
Citar esta recomendação Ver trecho original (1404s) *
Contexto da transcrição original
…point beside our cash flow valuation. And the reverse calculation here. It requires very little near-term cash flow growth to justify the price. It still assumes 3% perpetual growth later is why the current cash generation matters so much. Uber for me it's a buy cander at this valuation with a staged approach. I'd keep checking cash generation platform economics. The discount looks attractive enough to investigate those uncertainties rather than dismissing the opportunity. Now Mastercard is the business in this group that has held up the best on the yearly chart. It's closed around $650 and it rema…
Uber for me it's a buy cander at this valuation with a staged approach. I'd keep checking cash generation platform economics.
Transcrição Completa
Thursday's sell-off sent the markets fear gauge up nearly 70% in just a single day. Now, when something moves that quickly, I want to look at what investors are actually getting for their money. And then if we look at the markets, this is the weekly heat map of the S&P 500. Chips, they're deep in the red. While payments and several other businesses, they've held up the opportunities today. They're spread across very different companies. We got Mardo Libé that's sitting at a yearly low even after another quarter of rapid sales growth. But there's a reason investors are worried about how much of that growth actually reaches shareholders. We've then got Axon that fell 18% in just one session on Friday. We're going to look at what changed in the earnings report and whether the cash flow can support the valuation that people are paying. Novo. Well, that gives us something different again. A low earnings multiple and a much higher dividend yield alongside a business whose growth expectations they've come down very sharply. And then there's Mastercard. This one's held up much better. I'm going to compare all five, including Uber, and finish with my ranking and the stock I put fresh money into first. Now, let's kick it off with Melly trading around $1,500. It's down 25% in 2026 alone. When we compare it to their 52- week high at $2,300, while it's down around 36%, this is a substantial reset. Now, having said that, Wall Street give it a strong buy rating, seeing Alpha also see it as a buy, four out of five. Meanwhile, the company, well, quarterly revenue that keeps on climbing. You can see it moving from well below a billion dollars several years ago to almost 11 billion today. Demand that's continued to grow through the sell-off we're seeing. And the latest quarter, it brought in $10.75 billion of revenue. Earnings, it came in at $883. Now, that's below what analysts were expecting. Unfortunately, the sales growth, it didn't prevent an earnings miss. And revenue, well, that grew 45%, but the operating margin, it was 6.3%. The gap between the growth rate and the profit margin, that for me liberate is where I spend most of my time. And this graphic it basically is showing us how the money for the company is moving through the business. When we look at commerce here 6.1 billion it contributes the largest share of revenue. Fintech that is close sitting at 4.6 billion. Both them feed into the same consolidated profit. When we take a look on the right hand side and the customer numbers they explain why management just keep on investing. There are 94 million unique buyers and advertising revenue that grew 58% year-over-year. More activity is creating more chances to earn from the same customer. And we've got items sold that grew 36% while payments volume that was up 53%. These are substantial increases in activity. The question is how efficiently Mellie can turn that activity into cash. And then if we look at the spending below the gross profit, shipping, selling cost, product development, and credit provisions, they all have to be covered. Revenue growth really helps, but shareers ultimately need more money left over. Now, the credit portfolio that's sitting at $18 billion is growing much faster than the wider business. And that in itself creates another source of revenue and a much larger lending operation to manage. and credit provisions. Well, they're an expense for expected losses as the loan book expands. I want to see lending income grow alongside sensible loss assumptions. The provision line, it belongs in the investment case. Now, if we take a look at their revenue split geographically, we can see Brazil, that's their largest source of revenue. Mexico and Argentina, they also matter. So, you've also got to consider currency movements, local economic conditions. They can make the dollar results move around quite considerably. Even with those moving parts, the longer revenue record for Melly's, that's impressive. Growth has remained elevated. What I'm watching now is whether the company can keep that momentum while improving the economics underneath it. And if we move to their growth data, well, this table, it makes the current tension clear. Revenue growth looks strong 47% year-over-year, expected to climb 37% over the next 12 months. But the earnings and operating profit measures, they're less impressive. I mean, EBIT growth, that was down 9%. In terms of moving forward, strong double digit, but below topline revenue. Earnings per share that was down 9%. And moving forwards, yes, again, but again, slower than the top line. Now, all of that considered, the share price now values the business at around twice sales. It's near the low end. After several years, this company, it was trading very high. I mean at one point it was trading in the double digit region. And if we do look at the earnings multiple, I mean that's sitting around 40 times. That's this year's current forecast. So the stock it can look inexpensive against sales but considerably more demanding against today's earnings. Margin recovery, it matters a lot for Micardo Libé. Now if we move to analyst expectations where they're assuming earnings improve sharply next year, it takes the multiple down to around 27 and a half times 2027 earnings. The earnings though they obviously still have to arrive. Now my cash flow gives a value of $2,300 thereabouts. Against the current price today, we're talking 33% margin of safety equating to around 50% upside. The assumptions we can see cash flow analyst expectations that's 1.8 8 billion. In fact, going all the way to 2030 sitting at 5 billion. Bear in mind, Alans are expecting actually faster growth. I've been a bit more conservative, reducing some of these numbers by 2030%. Now, the latest quarter it generated $285 million of adjusted free cash flow gives us a reference point while we judge the recovery that analysts are expecting, whether we think it's basically achievable or not. Then, moving forwards, we have a growth rate of 20%. Now I'm discounting them at 9% using 3% terminal growth and this valuation that we get. It really depends on the company delivering these cash flow paths. Analysts they also see substantial upside with an average target price of $2,263 implying around 50% upside. It supports the interest in the stock but I still need my own assumptions to make sense. Now if we move to the lower growth case it comes to around $1,900 about 24% upside. It's useful although bear in mind this case is still focusing on the analyst projections up to 2030. That's something else to consider for mele. We can see trailing net debt sitting around twice ebit with a lower forecast ahead. For a business combining commerce and lending I keep monitoring the funding alongside growth. For me today me it's a stage by candidate. I start with a manageable amount and look for cash generation to improve the growth that's attractive but I want room to respond if the margins stay under pressure. Axon that gives us a much sharper immediate reaction. The shares trading around $313 at close of play Friday and they were also down we can see 18%. I mean, year to date, it puts them down 45% and they're also down more than half of their highs at $665. Pretty much trading at 52- week lows. Very similar to what we just saw for Melly. Terms of Wall Street, they see respectable buy. See Alpha though, unlike the previous company, they see this as a hold. And the company, it missed both numbers, topline revenue as well as earnings per share. Revenue came in 99 million. We can see expectation 943, EPS also lower 172, expectations 189. Now having said that, revenue still grew 28%. But just look at the recent trend. It's a slowdown from the mid30s growth we saw earlier this year. It matters when investors paid for consistently rapid expansion. Now management, they're putting much of the outlook reduction down to three federal ded appointments around $130 million of revenue. It's now excluded from the expectations this year. So I can understand the argument that timing made this quarter look weaker. What I want to see over time is the revenue actually coming through alongside growth in the rest of the business. We've also got the software side. That's encouraging. Software and services revenue reached $437 million with growth accelerating above 43% is an important part of the Axon longerterm case. However, the cash flow chart here, it's much less comfortable. Revenue that's moving higher, but free cash flow, well, that's been weak across several quarters. The latest quarter, it shows us another cash outflow. And gross margin, well, the history also deserves attention. The trading figure here, we've got 58.5% below several earlier years. The business mix and the cost of growth, they both affect what shareholders should receive. Now, I like the expansion in software revenue. A larger software business could support better economics over time, but I'd still judge that progress alongside the cash flow of the whole company. It's why the strong growth grade, it only gets us part of the way. When we look further down, we can see in fact free cash flow measures, they are pretty weak. In fact, year-over-year it was down 59%. We need both sides when deciding what to pay for the company. And based on analyst estimates, well, for 2026, they're trading at a PE sitting just below 44 and roughly 33 times 2027. So, very interesting. A large share price fall like we've seen with the company, it can still leave a demanding earnings multiple. And the sales multiples here, well, they remain substantial too, is trading around seven times forward revenue. It makes the pace of future growth and the profit earned on that revenue especially important. Now, average analyst target does sit much higher than today's price, $561, implying near 80% upside. useful expression of the bullish view, but the cash flow model gives me a more restrained valuation. My middle estimate comes to $383. That indicates around 22% upside and 18% margin of safety. But if we do look at the starting cash flows, the model's assuming $400 million this year, then 750 million next year. It is what analysts are forecasting and then moves in the later recovery assumption of 20% growth. Now just compare that when we do take a look at the last few years free cash flow growth well it's been very very uneven sometimes small sometimes negative so what I want to see is cash conversion improve enough to make the annual forecast that analysts are expecting a lot more convincing the low growth case well that falls to $281 that's below today's price by around 10% so the results they change materially when the business grows more slowly than the middle case assumes there's also more debt. We can see that than in the early years. Net debt to EBIT art will still manageable, but the business is funding expansion while we wait for more consistent cash generation. Now, the reason to stay interested is the software growth. If that keeps expanding and the wider business converts more of its revenue into cash, the longerterm opportunity, it could still be attractive. And in the meantime, I would treat management's explanation as something to track. I want to see how those deployments develop and whether future reports support the recovery investors are being asked to expect. At this price, Axon goes on my watch list. I like the business opportunity, but the valuation cushion looks fairly modest beside the cash flow recovery in the mall. I'd want more evidence or a better entry is why when I look at companies, I don't automatically buy the biggest percentage loser. Ax on Drop, yes, it gets my attention. The next decision comes from what the business can earn and how much of that reaches shareholders. Now before the next stock, the monthly heat map, it explains why I'm looking across different businesses, payments, and parts of healthcare. They've held up while much of the semiconductor trade that's fallen sharply. And Thursday, it also brought a huge amount of options activity. The chart that we're seeing, it shows more than 11 million put contracts. total volume it includes different strategies so it does take context to interpret and Jane Fraser gave city's views are part of the selling her point was that funds reduce exposure they can add pressure across their positions listen to how she describes the activity if you take the step back what are we seeing underneath all of this it's really the it's this is action taken by the hedge funds to derisk so we're seeing them buying back the short positions we're seeing them selling their long positions What's been interesting is less activity by the institutionals um and also retail's not been playing a role but you know we shouldn't be surprised >> that city's observation we also have this CNBC report of heavy retail selling on Thursday now these accounts cover different snapshots of activity so I would be slightly careful about attributing the whole decline just to one group and the same care it applies to fear the VIX rose very quickly but the closing level remained well below the pandemic peak the speed of the move and the final level they do tell different stories and then we've got blended thirdarter earnings growth for the S&P is above 31% it combines reported results as well as remaining estimates but it gives us a useful earnings reference alongside falling share prices and then when we look at the index that's also trading below the historical average it creates a reason to investigate obviously each company's estimates and the risk they still need their own assessment And we're also going to hear from Katie Stockton. She made a distinction between a possible rebound and the longerterm technical picture. Her view helps explain why a bounce by itself wouldn't settle the investment decision. >> You get the feeling that the the S&P will will get to correction mode. And do you get the feeling that the NASDAQ will get to bare market? >> I think we have some indications of that. Yes. It depends on how we close out the month, but in between now and then, I think we'll see a nice snapback rally. So, what we've been recommending is don't sell weakness, sell strength, right? Especially for the names that do appear to have broken support. >> Now, I take that as a reason to keep some flexibility. The decisions in this episode come back to earnings, cash flow, and price. A short-term rebound, it doesn't remove the need to check those assumptions. Now, we move to Novo Nordis, trading at $40. Now the valuation here very different from Axon. We have an earnings multiple trading around 12. In fact the trading yield that's sitting at 4 and a.5%. This is one though where we only get one buy rating weak from seeking Alpha and the company has been battered 21% year to date. Over the last year down 13 over the last 5 years down 30%. Now if we look at the yield it's much higher than the 5year average 4 12% against the five at 1.4. The earnings multiple that's fallen sharply. So it's an attractive starting point for a value investor. Yes, provided though the future earnings can hold up. This we would say could lead to a potential severe undervaluation signal for which when we look at the blue tunnel from simply safe dividends, this highlights intrinsic fair price. The share price for Novo Nordisk in comparison is sitting closer to zero than it is the bottom end. I mean look at the last 10 years. This one, I mean, before 2025. To get this in an undervalued level, you'd have to go to around the end of 2018 just tells you what the sentiment of the company was like not that long ago. Now, the current estimates, they do show why investors have become cautious. Earnings are expected to fall this year, then start to recover gradually over the following two years. The forecast growth is much slower than the company's earlier records. And we can also see this, the change in the growth table. The business still remains highly profitable but the growth expectations they are in fact weaker. It helps us to explain why essentially the market assigned a much lower multiple. Now having said that their latest report did give investors something more encouraging. They raised their fullear outlook and they reported strong growth in adjusted operating profit. I want to put the adjustment in context before we start to get carried away. Now this is a bit of a summary. It shows both versions. Adjusted operating profit that was up 27% at constant exchange rates. Reported operating profit though that fell 9% with substantial non-cash impairment charges affecting the quarter. And we've got the earnings recap here. It shows the results against analyst expectations. Very encouraging. We did see a double beat, but my focus is on whether the improvement can continue after this quarter given the much slower growth in the annual forecast. And the we go pill that brought in 5.4 4 billion Danish croner of quarterly sales. It's an actual commercial result we can follow rather than having to value the entire opportunity from a distant forecast. And the demand that's the part of the improved outlook highlighted the investment case it gets stronger if broader access and the pill roll out support sustained sales with sensible economics for the business overall. Now we can also see the longer revenue history. This is valued in Danish croner. It's just showing how much their business has expanded over time. For the next few years, though, we have to judge growth against today's larger revenue base. Now, next year's earnings forecast, it only increases slightly. So, my starting case needs to work with modest near-term growth. Any faster recovery would improve the outcome, but I wouldn't pay for it all up front. The other thing I want to say is I'd be cautious about assuming that the multiple returns to its old average. The growth outlook has changed. A lower multiple can be appropriate when the market expects the business to grow more slowly where no vote balance sheet it is giving us some breathing room. Net debt is below one sitting in fact 58 helping the company support investment and shareholder payments as it works through the slower growth period. Now my cash flow estimate comes to $48 that indicates a 17% margin of safety around 20% upside. Now model expectations for 2026 $9.7 billion and that's around 8% moving forwards from that point. Now bear in mind cash flow it can move around more than revenue. And in the lower growth case the value here it falls to $36. Now in the higher case around $64. So the range from 4 to 12% upside of well in fact downside here 10% upside of 60%. It really points out how much depends on the strength of the recovery. Now, average analyst target that is more a strain, $46. That's around 40% in terms of upside. So, the headline market target, it also points to a fairly measured recovery opportunity. For me, the next report needs to show that stronger product demand is translating into durable earnings and cash flow. Quarterly beat positive step with a lot still resting on execution. I'd consider Novo for a small patient recovery position. The low multiple in income appeal to me, but I'd leave room to add at a better price. My conviction is below the leading opportunities today. We then move on to Uber trading around $68 is down 16% year to date, down nearly 30% from all-time highs at $95. What interests me most is the cash generation behind the price. We've got a near strong buy from Wall Street as well. Buy from Seek Alpha, weak though. quant respectful by 4.3 and quarterly gross bookings pretty much around $60 billion is the value moving across the platform and the long history here is telling us how much the activity has grown through both mobility and delivery the keer going back to 2019 sitting at just above 19% and we've also got monthly active platform consumers that's reached 250 million more users gives Uber a larger audience across the services the job now is to keep that audience engaged and earn attractive returns. And you've also got the delivery part. Meaningful part of the business in fact in its own right. When we compare Uber's quarterly delivery revenue against in fact Door Dash, we can see its revenue sits at $5.5 billion. It gives Uber another way to earn from the customer relationships. But this here, this is the thing I keep coming back to. The trailing free cash flow that's now sitting above $10 billion. It shows us the change from the large cash outflows to the substantial cash generation in just the last few years. And the table here, it also gives me something tangible to put against the growth forecast. I want the business to keep increasing activity while converting more of that activity into cash that can ultimately support the shareholders. Now, the earnings forecast, they do look much more uneven. We can see a decline this year followed by a large rebound next year. There are in fact accounting effects behind the comparison and that deserves care when we're interpreting these growth rates. So something just to point out and by using the annual estimates the current price sits around 26 times this year's earnings and roughly 16 times next year's the attraction it improves considerably if the next year forecast ends up being delivered. Now coming back to this point cash flow it gives me another additional reference point alongside those earnings estimates. I still want to understand what drives it, but the scale already being generated, it makes the valuation worth a closer look. My middle point model where it comes to $133 indicating a 49% margin of safety with upside near double 96%. Now I am starting with analyst expectations of $10.5 billion of annual cash flow then assuming 10% growth. Now the latest trading cash flow it is close to the starting point. So much of Uber's case today, it rests on maintaining and growing cash that the business was already generating while also on the other side managing the costs of expansion. The lower growth case here in the model 8% gives a value of $116. Now it still assumes a growing business. So I'd also consider what could interrupt that path. Now gross bookings, it does also need some care. The $60 billion belongs to all the transactions across the platform. Uber, they keep a portion as revenue. So, I wouldn't personally value the business as though bookings were sales. And these are also the monthly active consumers. A large audience. Obviously, it helps, but I also want people to keep using the service. More users only create value if the activity produces worthwhile profit and cash. And the multiples, they depend on those economics holding up. If competition means Uber keeps less from each transaction, the earnings forecast could disappoint. That is a real risk even when the current valuation looks attractive today. And the debt ratios they do look manageable. Net debt that's sitting below one. Now analyst their average target that sits at $99 indicating around 44% upside. Now considering below my middle point of the model. I like having more restrain reference point beside our cash flow valuation. And the reverse calculation here. It requires very little near-term cash flow growth to justify the price. It still assumes 3% perpetual growth later is why the current cash generation matters so much. Uber for me it's a buy cander at this valuation with a staged approach. I'd keep checking cash generation platform economics. The discount looks attractive enough to investigate those uncertainties rather than dismissing the opportunity. Now Mastercard is the business in this group that has held up the best on the yearly chart. It's closed around $650 and it remains very close to yearly highs up 14% year to date alltime high while sitting at $682. Even with that, in fact, Wall Street give it a strong buy, seeing Alpha a weaker buy, and their quarterly revenues grown to almost $10 billion. It's the kind of steady expansion I like to see in a payments business with already a large existing network and recurring transaction activity. And their trailing revenue growth that's sitting around 15% is a substantial rate for a business of Mastercard size. The question is how much of the growth is already reflected in the valuation today? where when we too take a look at their forecast still very healthy the table is pointing us to growth around mid- teens across several measures supports the Mastercard quality case with earnings and cash flow continuing to expand now at current price Mastercards around 33 times this year's estimated earnings and around 28 times next year's I can understand paying a premium for consistency but the entry price it still affects the return and sherry purchase for Moscard another part of the story the company spent substant substantial amounts buying back stock over time can support earnings per share as the number of shares start to come down. Now the yield is only around half a percent. So most of my return it would need to come from growth repurchase and the eventual share price rather than just a large starting income payment. And when we do take a look at the blue tunnel we can see sitting right there towards the bottom of the fair value. Now this is a nice comparison. It puts MCAD's net revenue per transaction around 15. It also includes services revenue. So, the higher revenue per dollar of payment volume, it doesn't directly tell us what merchants pay on every single transaction. But look at the incentives that Mascar gives back. They've risen from around 26% of gross revenue to 30 year and a half% here. Keeping customers on the network, it involves substantial commercial spending. That's why I want to see revenue growth carry through into profits and cash. A strong network can still face pressure when customers negotiate terms or the competitive environment becomes more demanding. And the two debt ratios here, they also need context. Net debt to Ebitar is low while net debt to capital is higher. Repurchase can reduce book equity. So I'd read those measures together. Now my cash flow model for Mastercard, it comes to $735. Now we're talking around 12% 11 in fact for a margin of safety. Upsideing at 13%. To get the value I've used 14% annual cash flow growth, 9% discount rate as we have done. Bear in mind that is below both 5-year and 10 year KGA and below the most recent two years sitting above 20%. So the estimate already gives Mascar credit for a long period of healthy expansion and the average analyst price targets coming to $716 around 10% above today's price is another fairly modest upside estimate alongside an otherwise attractive business. And the low growth case it values the shares at $538. So a slower growth path it can leave the current price looking too high even while the business just keeps on expanding. Now the earnings forecast they help explain the premium investors are expecting continue growth in the mid- teens. My concern at this price is how much room remains if the expectations do end up coming down. Now for a new complete purchase I'd wait for a bigger discount. I'd like Mastercard a lot as a business. The return available under the current model. It gives me less room for disappointment than what I'd really like. It makes it a useful comparison with the companies that sold off. Holding up well is evidence of market confidence. I still need the price I pay to leave enough potential return. It's why the final ranking looks at the business and the price together. A more predictable company can belong below a less predictable one when the valuation gap is large enough. So, putting everything together, MScard is actually fifth for fresh money at these prices. I like the business but the modest upside in my model. It leaves me waiting for a more attractive entry. Axon well that comes in fourth. The growth opportunity very interesting especially in software but the valuation depends on a substantial recovery in cash flow. I like more evidence of that recovery or a larger discount. Novo Nordis that comes in third. The stani multiple and dividend they're appealing with some encouraging developments in their latest report. I'd approach it as a patient recovery position, keeping the size sensible while the outlook develops. In second place, Marcardo Libé. The ecosystem is growing rapidly and the share price has reset. I consider buying in stages while checking whether the spending on growth starts producing more cash for shareholders and Uber. Well, that's my first choice from the group today. at the prices we've seen. The existing cash generation and the gap to my valuation gives me the most interesting combination with a platform risk included in that judgment. The choice comes back to the cash flow record. I want to see it hold up as the business grows. If cash generation or platform economics deteriorate, the valuation needs to change with them. For Marcado Libre, I'd follow the operating margin in adjusted cash flow. Rapid sales growth earns attention, but the next stage of the case needs more of the activity to show up in the shareholder returns. For Axon, I'd watch the cash conversion particularly closely. The software growth is encouraging, but the model assumes a much stronger annual cash outcome. Future results need to support that expectation. For Novo, the earnings path is the test. I want the recent improvement to build into a sustained recovery rather than paying a higher multiple simply because the company used to grow faster. For Mastercard, the price is the main issue for me. The business can continue performing well while a new investor still earns less than expected because too much growth was included in the purchase price. Those are the decisions I take into Monday. Uber and Melly lead the list. Novo offers a different recovery opportunity and I keep acts on a mascot on watch for the reasons we've covered. Let me know which you choose at today's price. And if you enjoyed the episode, smash the like button, hit the subscribe and bell so you're aware of future releases. And don't forget to click on the pin comment below where you can sign up, read weekly articles where we cover undervalued stocks as well as what's going on in the market. More importantly, have a great day. I'll see you all on the next one.
Comentários 0
Entre para participar da discussão.
EntrarAinda não há comentários. Seja o primeiro a compartilhar sua opinião!