
- Retorno do vídeo
- —
- Chamadas
- 1
- Compra / Venda
- 1 0
- Publicado
Recomendações
Entrada é o preço de fechamento do ativo na data de publicação. Atual é o último fechamento registrado.
-
Entrada $1,31 16 out 2026Atual $1,31 17 out 2026Resultado +$0,00vs. índice — Sem índice de referência registrado para esta recomendação
Citar esta recomendação Ver trecho original (455s) *
Contexto da transcrição original
… Go get it. You try it. You have 30 days. By the way, there is live coaching every week in the uh member Discord and lots of other good stuff in the members area. All right. So with that, thanks for giving me a few minutes. It is look like it's almost the perfect time to buy XRP. I'm going to leave you with that image right there in that lower right hand corner. It's where I want to focus your attention. Historically, we've seen bounces up from 80 to 194% after that green dot fires. And if you want to know when th…
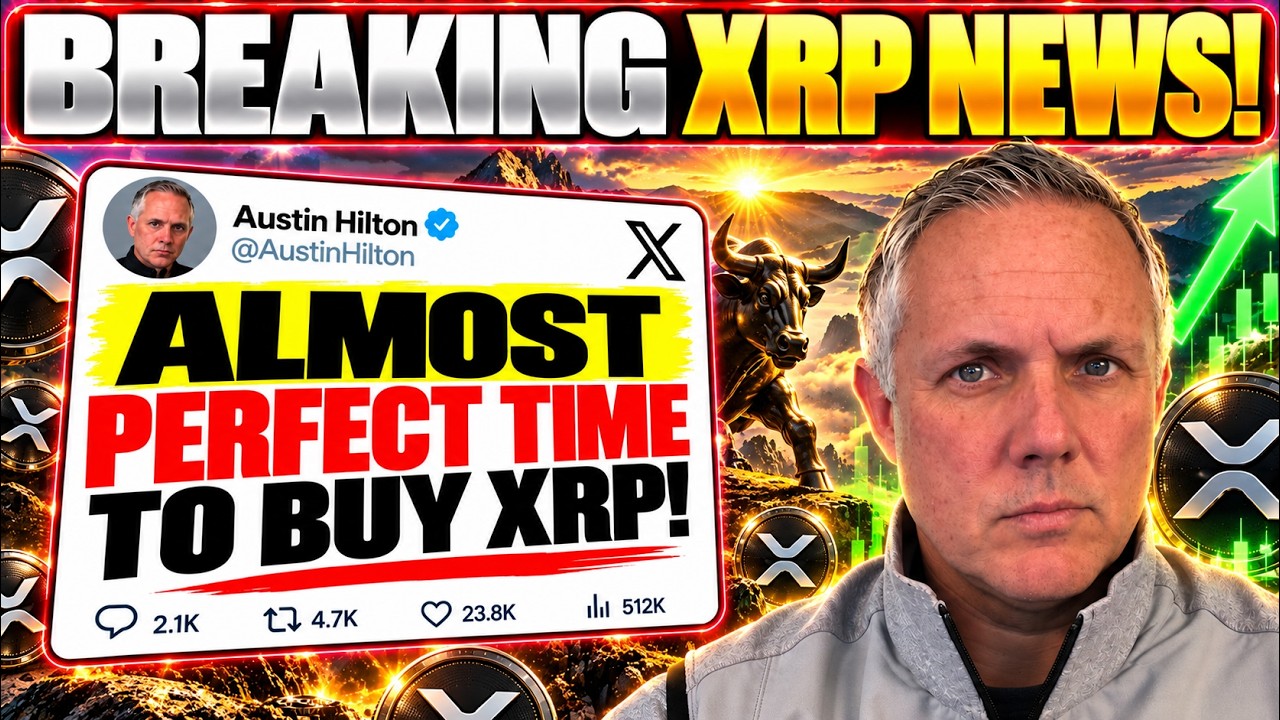
it's almost the perfect time to buy XRP
Contexto extraído por IA So with that, thanks for giving me a few minutes. It is look like it's almost the perfect time to buy XRP. I'm going to leave you with that image right there in that lower right hand corner.
Transcrição Completa
All right. So, how you doing? I've got an interesting video for you. Is it almost the perfect time to buy XRP? That's what we're going to talk about. Now, this is not me just making something up, pulling some headline or talking about it. No, I have some chart data here, and I want to show you some historical patterns that could lend you to kind of be Yeah, that could be looking pretty good here, Austin. Okay, so lot to cover. Stay with me. I promise this is going to be worth your time because it looks like we could be heading for an interesting scenario. Okay, we're going to jump into this chart real quickly here in just a minute. Uh let's real quickly see what is going on with current price market action. So we've got the overall market down 1%. We got Bitcoin down 1.3% and Ethereum down half a point. XRP down 2.26 at a$130 and change. Remember, you should be looking to buy when everybody else is screaming, "Oh my god, oh my god, the sky is falling and it's, you know, it's it's Armageddon." I'm being a little overly dramatic, but you get the point. Okay, so we're going to take a look now at this chart. Okay, so what you're seeing here is XRP chart, obviously, from a from a charting standpoint. And I want to focus you on kind of the the chart at the top where we've seen XRP consolidate now since about the 25th of August. We've been in this consolidation pattern and we've also just broken through this support here uh at a$132. We've been really kind of bouncing back and forth around that now for the last couple of days. And by the way, every every candle you see here is one day worth of trading data. Okay. So now what I want to do is I want to shift your focus down here to the bottom of the screen. Uh you basically well down here [laughter] if you will. Okay. So it looks like let's see if I can. Yeah, I can draw. Okay. Just making sure I can. Sometimes my little drawing feature doesn't always quite work for me. All right. So here's what I want to focus you on. See this right here? See this little how we're starting to move down here in the lower corner. We're moving below this white line and the blue is continuing to go down there. Now, that's the interesting part. That's what got my attention and that's what I want to focus you and your attention on as well. Now, what we're missing here is a green dot below the line. You're like, "What? Well, why does that matter, Austin?" Well, here's why it matters. I want to focus you right here. See this green dot right here? And see this green dot right here? And I go back in time. I guarantee you I can find some more. Uh here's one that's below the line right here as well. Now, this is all, by the way, part of my X1 trading algo suite. If you're interested in that, I'll tell you about that here just in a minute. Um yeah, and so what I want to now focus you on is like look, see this green dot right here and all the way from that green dot to that red dot in 12 days is 194%. XRP went up 194%. The trading indicator gave that green dot notification. Gave the red dot notification. The key is is that the buy alert comes in when we are below the white line. Okay. So, I want to focus you right here. Here's another one from here. This dot to that red dot 10 days 124%. All right. Uh this one right here, you can see it from here. And there's the red dot right there. 11 days, 101%. The conditions are starting to look very interesting with these one, two, three, and I could probably go back in time and I will find more similar situations that have presented themselves in the ha in the past where we have seen that buy alert, that green dot come in below that line, that white line that you see right here, and it issues the time to buy. each time has been over 100% and this time specifically which quite frankly wasn't that long ago was 194% and that period was between the 13th of August and the 25th of August about two months ago. Okay, basically right before we started consolidating. Okay. Now, yeah. Interesting, right? And we are now seeing the exact same pattern. See how see how the blue wave is coming down below this line in the lower right hand corner. Make sure you guys can see that. Yes, you can. Where that red uh where that red is right there. You see that right there? Okay. That is the focus of my interest. And it's presenting like it is potentially almost the perfect time to buy. And then boom, step in because again historical precedent 194%. Uh 100% and so forth. Now I want to go back now. Now I'm just curious. Now you see right here, see how the green dots got close to the white line but didn't go fall below. Now that's what's interesting. See how they they didn't go below that line. But here's one that did see you got you actually have two of them. So you can see right here from there to that first red dot in 12 days is about 83%. A little bit of chop, a little volatility in there. And you can see those and that's the keys that I'm looking for. Okay. So almost the perfect time. Looks like it could be. I like what I'm seeing here. And I'm focusing down here again in this right hand corner because you can see we're breaking down. We're fall we've fallen below our resistance. And if we get presented with a green dot below that white line, it is time to buy based off of historical precedent. Okay. Now, if you want to be able to get that notification and know when that's going to happen, then you can pick up my my trading indicator if you are so inclined. If that's something you want to do, links are right down there if you want to go check it out. I'll drop a link down in the description and I'll drop a link down in the u in the pinned comments. Look, you can try the the monthly plan if you want. And look, and there, by the way, there's a discount code. When you go down to grab that link, you'll see there's a discount code, uh, SP1. SP1, uh, I think it's SP1. Yeah. Um, and that's the discount code you can use. Get an even deeper discount than what you see on the screen. By the way, there's a 30-day no questions asked money back guarantee. What do you do? You get to try it really for free for 30 days. You don't like anything, you cancel, refund anytime. But look, this, you can use this logic, everything for any chart you want to. It's going to show you the perfect time to buy any crypto. When we see that green dot that's happening below that white line, that is your buy signal. That is your buy alert coming in. Okay? And you get that inside of X1 Algo. Links are right down there. Go get it. You try it. You have 30 days. By the way, there is live coaching every week in the uh member Discord and lots of other good stuff in the members area. All right. So with that, thanks for giving me a few minutes. It is look like it's almost the perfect time to buy XRP. I'm going to leave you with that image right there in that lower right hand corner. It's where I want to focus your attention. Historically, we've seen bounces up from 80 to 194% after that green dot fires. And if you want to know when that green dot fires, pick up the trading indicator. Look, it's like 40 bucks. You spend more than that when you go out to dinner one time with you and your loved one or your family or whatever it is. Why not invest in your future? You're here to make more profits in crypto. If you're not using a trading indicator like I've shown you, you're flying blind. You literally are flying blind. You don't know when to buy. You don't know when to sell any of your existing cryptos. You don't know when to jump in at the perfect time and make the most profit off of your trades. You simply are flying blinds. Think of it like this. you are driving with blinders on. Driving with blinders on is very dangerous, isn't it? You shouldn't do it. Obviously, why not take those blinders off, no longer be blind, and know when to buy and sell to make the most profit off of any crypto you want at all. And by the way, you can use this for stocks, too. So, all right. I'll see you. Links down there. Go pick it up. Boom. Give it a shot. Later. Bye.
Comentários 0
Entre para participar da discussão.
EntrarAinda não há comentários. Seja o primeiro a compartilhar sua opinião!