…ve been talking all year basically since the end of February about rates being elevated. And so I think the likelihood that we see them continue to go up versus finally going in the right direction. We're probably closer to that end point. So I just think it's a good time to be adding dollars now to a stock that's been beaten down tremendously versus to the point that I think you guys were all making a second ago, piling more dollars into something that has worked tremendously well, 2% away from all-time highs. Uh Josh, you're adding to a position that was your best position in …
So I just think it's a good time to be adding dollars now to a stock that's been beaten down tremendously
Contexto extraído por IA
But it's also the least dirty sock in the hamper when you compare it to like a United Wholesale uh uh Kenny Mack, the other servicesers uh and loan originators that it competes against. So underneath the surface, they've been taking market share from the other guys. Underneath the surface, they've been getting vertically integrated and making sure that they pay a little bit less each time they originate a lead now because they're going direct to consumer a lot more now than they used to. And so those things will do well the moment we start to see a break in those rates. We've been talking all year basically since the end of February about rates being elevated. And so I think the likelihood that we see them continue to go up versus finally going in the right direction. We're probably closer to that end point. So I just think it's a good time to be adding dollars now to a stock that's been beaten down tremendously versus to the point that I think you guys were all making a second ago, piling more dollars into something that has worked tremendously well, 2% away from all-time highs.
Transcrição Completa
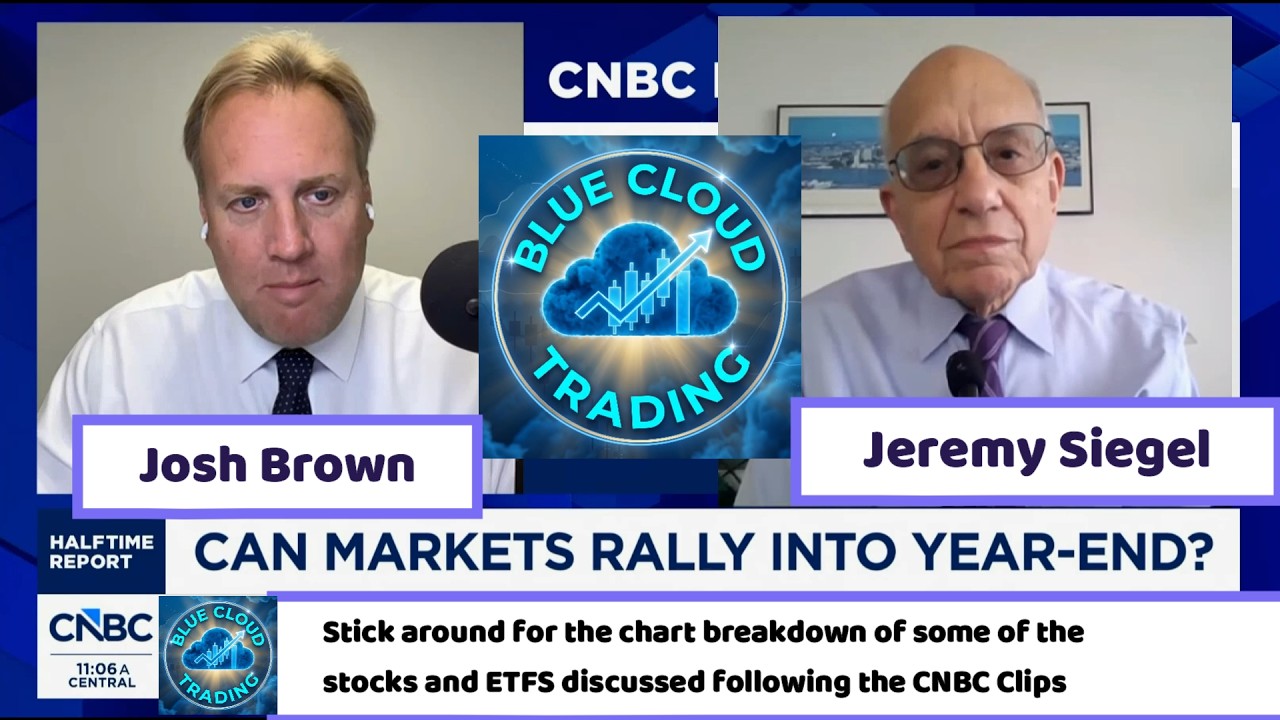
Blue cloud trading through the night. >> Welcome back to the channel everyone. In just a second, I'm going to play a few CNBC clips from today's episode of the halftime report. I'm going to pull up the charts and dive into the technicals of some of the mentioned stocks. We're going to look at the key support, resistance levels, momentum, and see if the price action actually backs up what the talking heads are saying. Hit that like button, subscribe if you haven't already, and let's roll the tape on the first clip. Don't we need to believe that we've also seen a top a peak in oil in order to believe that we've seen the calf on yields? Josh, what's your take? There there seem to be a lot of other factors here involved in terms of yields and where they're going at this point that are out of our control that are beyond earning season. >> Melissa, I always knew we'd be on the air again. I didn't know when. >> I was waiting for the day and today's the day, October 1st. >> I've missed you. All right. Uh to answer your question, I I think it's fairly simple. Oil prices are um wreaking havoc with inflation expectations. I wouldn't say inflation expectations are getting out of control. I think they're like fairly well anchored. But the longer this drags on for um the the the more difficult it becomes to think that we're going to see a resumption of that broadening trade that we all had so much fun with this summer. Um, I mean, Bank of America's in an 18% draw down right now. Nobody's even talking about it. That's a pretty substantial correction in a blue chip Dow stock. Like 6 months ago, it looked incredible. And there are a lot of other examples of that. And I just I think the rates thing um is kind of mountable for large swaths of the market. The good news is it doesn't matter um because the MAG seven is back to max sevening. And I think the thing that people get wrong about these stocks, they think of them like growth stocks. And yes, these are companies that are growing. Um, but they're really defensive. And this is what investors rotate to when they get nervous. And that's I mean, we've seen it like 10 times. I don't know why I have to keep explaining this. The MAG 7 on a year-to- date basis is now back to beating the S&P 500. It's up 12.8% year-to date. S&P is plus 11.8%. Meanwhile, the if you equal weight them, look at the MAX ETF, MAGS, you you've got basically a group of stocks that are trading collectively at 24 times earnings forward. Um the equal weighted uh version is expecting 21% earnings growth. So, that's lumpy. Obviously, they're not all equal. Tesla is not Alphabet, but um that's why people use these as a safety trade. They may not feel good about oil rates, the latest inflation reading, what's the next labor report, what's going to say, but they do know these companies are going to do the number. And I think you see asset managers rotate there. Um, last thing very quickly, uh, Apple, Meta, and Microsoft right now are all within single digits of a new 52- week high, and in most cases, an all-time high. Nvidia is less than 5% away and looks like it wants to break out like literally any second. You may not get a resumption that broadening trade, but we may end up with a good finish to the year and these stocks will be the ones that help us get it done if in fact that's what ends up ends up happening. You get a meaningful drop uh in rates or even a sessation in this relentless march higher, you'll get the rest of the market back too. Maybe not all of it. >> Josh, are you going to start dipping in? I mean, do you think that we have seen that sort of bottom in bonds, the peak in yields? >> Well, uh I don't know if this is good news to anyone. The one year is down five basis points today. So, that's that's cute, I guess. Um I came on the show last I want to I want to say last Tuesday or I don't know the days are the days are all blending together. Um I came on within the last week and said the opposite. What we're doing here is we're looking at a 2-year uh at or around 5%. And we're saying, you know what, we have all these portfolios that have ridden this market up and up and up and up. And what we're having our financial planners do, and it's hand-to-hand combat, it's one conversation at a time, is go to those clients who once upon a time had a 6040 that now looks more like an 8020, uh, and rebalance back and look at this risk-free rate. we can we can earn. Not that we're like gushing over 5%, but like my god, as a risk-free rate of return, that's actually positive in real terms relative to inflation. If we can hang out there, that gives us the ability to capitalize on, you know, whether or not we have a market dislocation. Uh we're t like we're all talking uh tentatively and and the stock market's within 2% of an all-time high. Yeah. >> Like could you imagine we get down? you imagine we get down uh five 500 basis points from here the way people are going to be talking. So if you do nothing at all, okay, that's your prerogative. I guess you won't have taxes next year, but you also won't have that dry powder, that flexibility. Um and we want to have that. So this is what we're doing. And uh I don't know, man. a a 2% a a two-year Treasury at 5%. Given all of the things facing this market right now, it doesn't sound like the worst idea to look at those asset allocations account by account and say, "All right, we let this run far enough. Let's do something adult and responsible. We've done this before. We'll do it again. This is our job." >> I I think that makes a lot of sense. And I think that's a conversation a lot of people, investors are having right now in terms of if if I do if I had $10,000 right now, would I put it into a stock market that's 2% from all-time highs or would I go basically not risking the premium too much and get a 5% return? Let's go to some of the committee moves because we do want to get to it. I mean, obviously we like broader markets, but we like individual stocks. Uh Malcolm, you're buying more rocket companies. Why would you do that right now? We've now spent 15 minutes talking about interest rates and bonds and all the other exciting things about >> your fix is 7.58% 7.6% I think. Now >> I think we basically just made a case for why we may be at the bottom when it comes to some of the fintexs that are extremely rate sensitive like a rocket for example which cannot get up off the floor until the 30-year fixed rate mortgage finally makes a move. But with the sell-off we just got yesterday I think this stock is down just in in in the last uh year to date the stock's down like 40%. But it's also the least dirty sock in the hamper when you compare it to like a United Wholesale uh uh Kenny Mack, the other servicesers uh and loan originators that it competes against. So underneath the surface, they've been taking market share from the other guys. Underneath the surface, they've been getting vertically integrated and making sure that they pay a little bit less each time they originate a lead now because they're going direct to consumer a lot more now than they used to. And so those things will do well the moment we start to see a break in those rates. We've been talking all year basically since the end of February about rates being elevated. And so I think the likelihood that we see them continue to go up versus finally going in the right direction. We're probably closer to that end point. So I just think it's a good time to be adding dollars now to a stock that's been beaten down tremendously versus to the point that I think you guys were all making a second ago, piling more dollars into something that has worked tremendously well, 2% away from all-time highs. Uh Josh, you're adding to a position that was your best position in Q3. So, how much more did you buy Snowflake and why? >> Yeah, so um my first purchases in Snowflake, which we did here on the show, were uh 280ish, uh 286 or something like that. Um I added at 303 and I just added again yesterday. Um I I like to buy when the market is confirming that I'm I'm right. Uh I I don't I don't I'm not against averaging down, but I love to average up and uh my stops get raised along with that. I don't I don't view snow as like a forever position. I just think it's really well positioned for the realization that's happening right now in AI. And we did a whole thing on this show about it so people could look it up. I'm not going to repeat it, but the basic premise is that Snowflake has perfectly gotten the message across to its enterprise customers. Hey, you no longer need to move data to this platform, to that platform. We don't need uh spreadsheets. We don't need to copy paste. We don't need to permission 50 different attachments. You actually can run all of your agentic workflows right here in the data warehouse in the data lake. That is an extremely powerful change in what people thought of this company even 6 months ago. Give me a one-year chart and you'll see um I'm not the only one to have come to this realization. Snow is going to report in December. So, they're a late reporter. They're expected to do 77% 71% year-over-year earnings growth when they report 97% cash flow growth. The amount of large enterprise customers spending big dollars on this platform is going up and up and up. It's becoming a new AI darling and the market is confirming that I'm on to something. So I am adding as the stock rallies. >> Welcome back to halftime report. Guggenheim raising Netflix's target to 80 bucks from 75 reiterating the price target of buy. Josh and Malcolm, you both own the stock which has been getting a lot of attention on the street lately. There's also some commentary that Coco Ted Sandos has said that he's not happy um with the growth in Netflix so far. I think a lot of investors feel the same. Josh, uh what do you think? >> Um as I've said on the show before, this is the stock that I I've been the most wrong about this year. I'm uh look, I'm not like a prisoner to it. I could sell it anytime if I really wanted to. Uh I'm just not going to because I've already I I my average cost is in the 80s. So, I already I'm already stuck in it all year. I look kind of stupid. I've averaged down. Um, but this was 40 times uh earnings last summer and now it's 20. And I don't think there's a person on Wall Street that doesn't understand why the stock's been under pressure. The last quarter wasn't great. People are worried about competition. Um, they always have been. And uh I don't think Netflix has done a great job explaining how it's going to use its position as literally the biggest most profitable and most powerful player in streaming. Like they've added a bunch of live sports the street like that and really not a lot since. So they have to get better talking to the street. It's not the same as the old days when Reed was there. Um I you know it's it's it's just been like uh the shine has come off of it. I don't know what changes that, but I I do think I'll end up making money here. I am not in a rush to add add 68. >> What do we want to hear from Netflix at this point? They're already spending about 5% of their $20 billion content budget on live sports and looks like they're going deeper and deeper. I mean, what what is the strategy that will satisfy investors, do you think? What do you want to hear from that? >> They they figured it out. They figured it out. Okay. They are now actively deemphasizing this stupid metric of time spent. The same way that Apple got itself out of this pickle of having to report iPhones every quarter like like physical unit sales as though that were like this allimportant metric. One day they just said, "You know what? We're not even going to tell you what that is anymore." And everyone flipped out and Apple went down 6%. And I don't know, that was probably 300% ago. So Netflix is not going to be talking about time spent. They're not going to fall into this trap because think about what they're competing with. Like literally Instagram, YouTube, Tik Tok, people, god forbid, reading a book. It's such a dumb way for them to be positioned to say like this was a good or a bad quarter. So now they're going to focus on the profitability of the platform, the growth of the advertising side, the the low churn rate, uh penetrating new countries, um and and and bringing on subs and places that didn't exist. That's the right conversation. It'll take a quarter or two for the sell side to get to get accustomed to talking about that and not talking about literally how many minutes a person sits and stares at the screen. >> I want to get Malcolm in here. Uh yeah, Josh said a lot of really good things. I think to tie a bow around it, the most important thing is the reason this is such a battleground stock is because investors are misunderstanding how they should think about the company now. So, we're talking about the company for what it used to be and how we used to focus on it from an analyst perspective. But realistically, this is like asking uh Apple post Steve Jobs to give you another iPhone and instead of focusing on the fact that Tim Cook came in and just did a really great job of optimizing what they had already built. So, right now, I think where we see Netflix going next is not building the next important thing, not bringing more people into the ecosystem. They've got more than 300 million paid subscribers around the globe. How do we monetize that? And I think they have enough really sticky customers the same way that Apple has enough really sticky iPhone lovers in that ecosystem that this is where they need to figure out ways to just increase that monetization incrementally and year by year. The same way Apple has yearbyear increased the amount that they're able to extract from their customers. That's what Netflix will figure out. >> I'll tell you. >> We are back with Josh Brown's best stocks in the market. Um so this is an interesting one, Josh. And uh if you want to ride the GLP1 boom, this could be it. >> Yeah. So GLP1s are about 18% of revenue. So they are definitely very important to this company. Basically, this is the company that is manufacturing the syringes, the rubber stoppers, all the equipment for injectables. And of course, it's not just GLP1 drugs. It's a multi-billion dollar business. But um when they report, give me a chart while I talk. WST. Um, this is West Pharmaceuticals. When they uh reported second quarter, >> when they report Thank you. when they reported second quarter sales uh they were up about 14%. Adjusted earnings jumped 29%. Management has already raised guidance twice this year. The new earnings forecast is about 50% above the same guidance that crashed the stock last February. On top of that, to demonstrate their confidence in that guidance, they're backing that with a billion dollar buyback authorization. So, basically, this was a co stock because of the vaccines, then it crashed like all the other co stocks, and now they've gotten their groove back. We put all these stop losses and uh pivot areas in the column at CNBC Pro. I think the big thing here is to watch 383. That's the high from earlier this summer. A close above uh would be fresh 52- week highs. I think 350 to the downside tells traders the run may have stalled. 325 to 330 has acted as you can see in the chart as support twice. So for a little bit longer term oriented investor um who wants to play the play it as a trade maybe that's the area that you're looking at. Um but I like it here. Great fundamentals. Are you worried um that as the world moves to multid-dosese pens that that threatens their economics? >> You know, people were asking the same question as the world moves to pills. Um the company has done a really good job explaining it almost doesn't matter. the rate at which the overall pie is growing, the stronger efficacy of the the shot itself, the fact that there is an increased value in making the multid-dosese pen versus just a plain vanilla syringe. And on top of it all, um right now the current estimates are that about 70% of the global GLP population will continue with injectables because they just work better. 30% will be pills in that scenario. And given that it's about a fifth of this company's business, I think the street is very very comfortable with that out outlook. The other thing to keep in mind is there are so many other injectable drugs and more coming all the time all over the world and this is really the company that helps them package it and and get it out to the consumer. >> Morgan Stanley just this week saying that they see 10% upside to the streets estimates in 2027 in their bullcase scenario. Uh, Bill, I know you own a lot of different healthcare names. Which one's your top picks? >> Well, we own Lily as in our top 10, and it's also in our concentrated portfolio. We we really like the the forecast here with with being the leader in the GLP space. And not only that, the chart has been pretty technically very well since we added it in April. I think there's some good legs uh in Lily to finish out the year for sure. >> Welcome back to halftime. Nike reports after the bell. It's the worst Dow stock this year. Is down 43%. Um Josh, you sold the stock back in July. I don't know if that spared you from losses, but what do you think of the stock here going into earnings? >> I mean, the the bar is so low is like the best thing I could say. The problem is if they give increasingly poor guidance, which has been the trend for I don't know 5 years now, like if if if present trends continue, it's not cheap enough that you know people would be like I don't care. I'm buying it. So, I already have two or three of these in my portfolio. I don't need another one. Um, happy to watch from the sidelines. Root rooting for everyone. I just I just want everyone to have fun. >> Well, that's very generous of you. Um, you know, there have been a lot of head fakes in terms of the a Nike turnaround under the new CEO, and I think investors have gotten fooled maybe one too many times. Um, I think what stands out about the Nike story that's interesting to me at least is that the competition, forget what they're doing innovation, but just the competition externally on every continent is there from brands that we have not even ever heard of. I mean, China, their growth market leaning, I mean, there there's a handful of players there that are really challenging Nike and it's going on there and Europe and in the United States. Let's close out with final trades. Josh Brown, >> uh, Snowflake looking good. >> Top position Q3. Uh, Bill Baroo, what do you say? >> Micron blowout quarter, incredible margins. Maybe it's holding it back. Is the transparency looking looking visibility looking out into 27, but I think the stock is going to be heading higher. It's a number two position. >> Sir, >> Morgan Stanley, I think misunderstood. It's the wealth management business that drives it, not the capital markets. >> All right. And Malcolm, what do you say? Yeah, the insurance business is not AI sensitive. It's not also not that interest rate sensitive at the moment. So, I'm going to chub. >> All right. >> And welcome to closing bell. I'm Carl Ktonia in for Scott Wapner. This makeorb breakak hour begins with some rate relief as the 10-year yield does pull back from some 24-year highs. It gets gets your scorecard with 60 minutes to go in the trading session. Bit of a tug of war here between the rate relief and oil which has been stubborn on some headlines regarding additional assets potentially to the Gulf. And that leads us to our talk of the tape this afternoon. How you might position your portfolio as we kick off the final quarter of the year. Let's bring in Jeremy Seagull, professor of finance at the Wharton School and Wisdom Tree Chief Economist. Professor, good to have you. Thanks for joining us. >> Good to see you, Carl. >> Did you get the inkling of the beginnings of a bond rally today? Well, I I'm relieved we we had one because I I really couldn't believe the yields that I was I was seeing. Um uh you know, particular I like to look at the Treasury inflation protected bond yields and the uh the 30-year one reached three and a third percent 3.35% and I don't think we've seen that for you know 20 25 30 years. Um and uh now you know is that compet you know when you get three almost 3 12% after inflation uh a 20p stock market gives you 5% after inflation so there's still a good margin there but that that margin is is shrinking um >> and and in my opinion one reason why tech has held out so well I mean look at the margins of tech of Mag 7, you know, there's 50% 60 70. So, you know, there's a there's a tick up of interest rates, but you know, outside the tech and the re in the real world when they're working on margins of 7 8 9 10%. You start raising those interest rates and you really cut into what what we have profits. So, you know, to, you know, we all thought we had this great rotation going on at the first half of this year and it it certainly looked like it was rolling, but I think this rise in interest rates has really, you know, put a stomp on it, >> right? Are the Bulls right to take heart in what Jefferson said today about taking more time, sort of piggybacking on what we got out of Waller? Yeah, I mean, you know, obviously Wars is in a real difficult situation for um uh the next meeting. It's it's 6 days before the midterms. Truthfully, I I think we need two more increases this year, but he might be able to convey I think two more, but I think he might say to the committee, "Listen, guys, you know, if you guys hold off, let's maybe we'll do a 50 basis point in December. Let's not make this political by doing it six days before the midterms. Um, you know, how much difference, you know, does a month or two make on a 20 25 basis points? So, I think he's got another, you know, juggling job uh to do there. Um but I mean when you take a look at uh the futures market and and and and some of the other I mean just the strength of the economy um and uh and and the rise in yield just tells you that uh you know this this this economy uh can take a rise in short-term interest rates. >> Yeah. Yeah. Nice piece out of Greg Yip today uh at the Journal arguing that a a 63 nominal GDP regresses to a 10-year at 5 and a half with really no problem. >> Yeah. Yeah. And and and normally we we we think of uh you know that the 10-year being uh you know 80 uh basis points above the Fed funds. Well, you know, I mean, if you're, you know, if you're at five and five and a quarter, five and a half, that's way above where we are right now in terms of the normal slope. I mean, some people, you know, uh, uh, have said that the two-year is a good indicator of where Fed funds should be. And wow, I mean, you know, that's that's also mov on and all those term structures issues, uh, it argues for higher interest rates. >> Yeah. So, it sounds like you think that the chair is between a rock and a hard place. Uh that it's a close call, but that you do think it's more likely they continue to hike than pause. >> I think that I mean continue to hike this year. I mean, again, uh you know, I mean, he listen, he pulled out magic last time. I mean, you know, Trump two days before the meeting says he better lower interest rates. Here he raised them and and hardly a a peep. I mean, that was I mean, obviously he called Bessant and he called Hassid. He called the advice. He got get Donald Trump ready for this. Um and and Donald J. He he kept quiet after he said it's not my preference, but you know uh you know I understand what he has to do. But you know when you when you get within a week of uh you know important midterm ex uh uh you don't want the the wrath of of Trump to fall on you. um you know stay stay neutral and I don't think it would hurt the economy even though I think it needs a couple more to wait for looking at December. We're going to get more data you know what could happen you know the the the war in Iran and oil I mean you know I I mean I think that Iran has no incentive obviously to stop conflict before the midterms. Um uh uh so you know they may actually increase the fight and and and send oil up. So by December you will have that windown of what is happening in Iran, more information and certainly a politically more um you know accessible time to to raise rates. But I I think you know the short-term rates going up. >> Yeah. Uh we did have a note out of Citadel today kind of characterizing professor Q4 as a reload. We know seasonality post midterms tends to be more friendly. Would you expect the bulls to to find some sea legs here after the early November period? >> I think I think they could uh you know very definitely but I you know I think these these yields uh you know are are basically a challenge for equities. I still like equities and I'm in them and I don't like bonds because I think they may actually going higher. I mean ultimately you know I mean certainly strong economy is one of the factors but you know ultimately we have a lot of fiscal debt that we have to face and we have to fix in the next three or four years and I think this is the beginning of the bond market reminding us these challenges have to be met. >> Yeah and we did get comments from from leader Thun just this week that we'll probably be talking about raising the debt limit once we get the new Congress into place. Professor sit tight. We want to check in with our Oliver Renick at SIBO in Chicago flagging a big move playing out in the options market that could signal the bond beatd down might stabilize. Hey Oliver. >> Hey guys. Two different things looking at today. First is in the XLU the utilities group which has been trading basically inversely to interest rates for the last two months. That's changed pretty dramatically this week where instead of put flows, we saw actually quite a bit of call trading over the last several sessions that culminated in a lot of call action today that's happening on options volume that's 10 times the 30-day average of the XLU, which usually doesn't get a ton of trading. So, in fact, what we're seeing is actually quite a bit of call buying. So much so that there were more than 200,000 contracts roughly of calls traded, which is way bigger than what we saw in puts, roughly about 30,000 in terms of volume. Now there is some call selling that's happening alongside the call buying. In fact about equal in terms of buying versus selling of calls but in fact one of the biggest trades that saw call selling was paired with also put selling. It looks like a message that utilities are ready to bottom out or potentially rally. Then on top of that I heard from a bond trader downstairs in the bond pits that there was a huge trade in the sofur options which is the overnight rate. It was about a $4 million bet that that overnight rate for sofur across a 100,000 of the March futures contracts are actually going to be moving back towards higher prices and lower yields for the overnight rate that would require us to get back to levels first seen in the first week of August for the trade to pay off. I think combined together, it's a pretty strong sign of sentiment shift, guys. >> Yeah, that would that be music to some of the the bond bulls ears. Oliver, thank you for that. and Oliver Renick. Let's bring in Morgan Stanley's Andrew Slimman joins us here at Post 9 in the Taylor Group's James Taylor as the professor is still with us. Guys, good afternoon. Good to have you both. Andrew, you make the point that every hike cycle begins with kind of modest expectations and sometimes they're right and sometimes they're wrong. >> Right. That's the point. The the the story of this, you know, the last couple months is the battle between good earnings, but what do we pay for those earnings if the Fed's raising rates? That's why the multiple has come down. So if in fact the Fed doesn't raise right into the election and and we get lower rates, the multiple can float back up and I think the market will rip into Europe. >> So a good but if it looks like they're going to have to raise more than what's the nor you know the the comfort level the two to four then the multiple could come further down. So that's the key is it's not about earnings. Earnings are strong and if we focus on that that's bullish. It's what do we pay for those earnings and that's where the Fed comes into play. And and good examples would be on the on the bullish side 2015 and on the bearish side 2022. >> Exactly. But we both times Carl, this is the key. They started with two to four times raising rates. It's always the same. It's how does that play out? That's the question. >> How do you think about the moment we're in James? >> Yeah, I'm actually I'm pretty constructive going into the end of the year. Um I think once we go through the midterms, everyone's, you know, saying the midterms it's going to affect the market so much. I think it actually be a a positive catalyst going into the end of the year. uh whether there's a sweep on either end. The market wants certainty. Uh they don't like uncertainty. I think with rates um I do think there probably going to be a couple more rate hikes going into the end of the year. Uh but to uh Jeremy's point, I think the broad-based economy is in really good shape. I think earnings look fantastic. >> Yeah, I mean just this week alone, whether it's ADP, uh the recent retail sales, Chicago PMI, the ISMs today, I mean it's it's growth and price that reflects the growth. Am I right? >> No doubt. No doubt. And on average, I mean, I know Andrew, I'm sure you know that that stat, but I think on average, you know, since 1950, um, in the midterm elections, Q4, the average returns been around 6 and a half%. Um, after uh midterms, uh, 6 months after, it's about 14 and 12%. So, I think the market wants a little bit certainty. As long as we don't mess up, uh, the rates with rate hikes, I think we're going to be in really good shape. >> I mean, you make the argument, right, that the first quarter we focus on the macro, market was down 4%. Second quarter it was about micro earnings markets up 14%. Third quarter back to the macro markets up 2%. Maybe we'll go back to the micro and that's the good story. >> Professor um to the degree that sectors are ripe for some exploration. Do you turn to financials first? >> Well I mean you know there's there's the challenge with financials with those those higher interest rates. Uh we saw a challenge with financials when uh Meta released Moose and uh everyone thought oh it's going to find you to take out of those lazy savings accounts that give you you know 0.2% and sweep you into higher rates. uh uh you know I I think in a higher rate environment there's there's still going to be challenges um and they put out loans um if there's any slowdown in the economy and I don't I don't see any uh you know um uh you know that that might hurt their portfolio you know let's hope that the midterms the next Fed meeting is is like sometimes called a clearing event we get that uncertainty out of the way u and you know somehow you know that's what I think could bring about a rally in the fourth quarter, but uh you know, I think that the financials are still going to be challenged with this rate structure. >> I'll tell you what, the point's been made, Andrew. Uh when it comes to the banks, they're at the center of so many sort of almost binary conversations about the AI buildout, about the curve flattening, about delayed IPOs, about Q3 not being Q2. >> But what did Oliver just say? He said, "The XLU has been creamed. It's tremendously oversold, and they're seeing a bottom." And that's that's the case. If that's true, that's telling you interest rates might come down. Financials might be a very good opportunity given the fact they've been killed so much recently. Maybe this is a buying opportunity. What's already reflected is higher rates. >> Where does it rank on your list of favorites? >> I actually I like it. I think financials have had uh you know relatively tough year compared to like technology. You know, I was on here at the end of July and I said you know that selloff in technology could have been a really good buying opportunity. We're right about that. We don't retreat, we rebalance. So, we'll take some gains off the tech names and look at some good high quality financial names and um I do think that there's a decent opportunity there. >> Do more hikes mean that the that breath needs to suffer as a result? Does it get even more concentrated into tech? >> I do think it's a stock pickers market right now. Uh I think you're going and buying, you know, just individual like S&P 500 ETFs. Yes, that's worked in the past, but I think you're going to fare a lot better being in a stock pickers market. Now, that's my opinion. That's not, you know, Wells's opinion, but that's what I think. I mean what's interesting about that Carl is you know the bears alls bring up breath but the last time the breath was this bad was in March and what happened in the second quarter mark 14% so be careful >> yeah that's an interesting point we did get the headline professor this afternoon out of the journal uh that the administration may send a third aircraft carrier group strike group to uh to the Gulf 9 to 10,000 troops maybe by the end of November is that going to act as a suppressant on any enthusiasm we can jin up maybe if they do pause. >> Well, you know, as I said, first worry is interest rates. Second worry worry is oil prices and they're they're kind of tied to the hip. If we can get oil down whatever into the 70s, uh, wow, this this market will take off because interest rates will ease. And, uh, you know, I I think, uh, a lot of these so-called value stocks that are non- tech will begin to really see their their margins improve. >> The last thing I'll bring up, Andrew, is that you point out XUS has kind of been doing pretty well relative to us. What's happening there? So it's fascinating, Carl. So what's the real story is stocks respond to the second derivative, which is earnings revisions. And for years, people would say markets are cheap, but then it turned out the E was too high. Well, that's changing. Earnings revisions are starting to move up in Europe and Japan for the first time. And that's why those markets have become competitive return. Japan's rock this year uh with the US. So I really think it is a fundamental improvement. Now you can ask why. We can pontificate that but what I see is at portfolio manager I'm finding more ideas where companies are saying actually business is better than you expected. >> Would you agree with that? >> I do to an extent. We're still overweight the US. Um you know I do think in certain sectors there's more opportunity. I think the overcrowded trades like you know technology has obviously done really well but I like healthcare. I like financials. I think those are undercrowded and then you know industrials is another sector that I do like and I think there's some opportunity there. Final question, professor. Jobs number tomorrow, is it really important or is the is that side of the debate and the mandate kind of well understood by us and by the >> you know Yeah. You know, we get these weekly reports ADP and then we get the you know the Thursday reports on jobless claims and they've shown strength. So, you know, uh you know, I I don't expect a big surprise coming out of it. Uh uh I I guess it will be the last report before the next meeting. But you know I again I think what's what what the Fed sees the bond market doing and uh you know what happens in in Iran and oil I think are are still by far the dominant players over the next two three weeks. >> Great discussion guys. Appreciate it very much. Andrew Slimman, James Taylor, Professor Seagull. Talk soon. Let's get another check on shares of Nike down by about 5.9% under pressure after reporting a revenue miss. Revenue for Greater China down 22% year-over-year. The stock if it opens at these levels are a 13-year low. >> Hello everybody. Welcome to Blue Cloud Trading. I'm George. We just saw some clips from the halftime report, closing bell, and uh we saw Josh Brown, Jeremy Seagull, and some other guests on those shows. Now, what we're going to do in this clip, this segment of the video, the last part, is go over those stocks. Not all of them, but a good portion of the stocks and ETFs. I'm going to show you the list, and then I'll talk about what happened here today in the markets because it is currently 6:28 p.m. Eastern time as I am recording this video. and it's October 1st, Thursday. Those clips are from earlier today. So, uh, let's take a look at the charts here. What we're going to look at is the SPY, the QQQ ETF. SPY, of course, is the S&P 500, the Russell 2000, Bitcoin, silver gold Dow Jones, the Euro stocks. Okay, we're going to look at Ethereum, oil, and uh check out that VIX as well. And then we'll also take a look at about 14 stocks. We'll look at XLK, which is the technology uh ETF, Chub Corporation, the MAGS, Meta, Morgan Stanley, Netflix, Nike, Rocket Companies, Snowflake, TLT, 20-year Treasury Bond, West Pharmaceutical Services, XLE, which is the energy ETF, XLF, Financials, and the Utilities ETF. That's quite a few uh things we're going to go through, and we won't spend too much time on these. Um, by now you folks, if you're following this channel, you already are very familiarized with Ichimoku because I pretty much talk about it in every video. If you're unfamiliar with the indicator, I'll I'll kind of explain it as I go through the the clips. But I yeah, we'll get into that in a second. But first, before we do that, let's take a look at uh the news here today. US stocks closed modestly higher as the 10-year yields retreated from 2002 highs and energy rallied on China export curves ahead of the key jobs data. So there is a really important uh economic release. Let's take a look at that. That's happening tomorrow. Look at the calendar. We look under economic scroll down here for Friday 8:30 a.m. is the non-farm payrolls. That's an important one. You can see the three red dots here that shows the impact on the market. And also down below here, unemployment rate, that's going to be a big one, too. And they both come out at 8:30 a.m. So, we should see a reaction in the early uh part of the day, right, in the morning, uh based on the numbers and how they, you know, they can meet the expectations of Wall Street or supersede. We're going to see a very bullish, probably a bullish rally tomorrow morning, uh when the market opens. So, let's wait and see what happens. Um, but right now, we're going to go back here for a second. Let me go back to this uh home screen and show you guys what happened today. So, you know, things were looking good in the morning, right, when the market opened. Um, the S&P 500, NASDAQ, Dow, they were all up. The Russell was actually down in the morning. And then what happened was it dropped price dropped and around 11:00 a.m. Okay, 11:00 a.m. they all started to move back up. So you can see that the S&P 500 was up just.19%. It really was pretty flat actually. Not a whole lot going on. If we take a look at the NASDAQ, we can see that also recovered. It was only up 04%. Dow Jones was only up 04% and the Russell 2000 was up just 41. So again, pretty flat trading day today. Nothing really major happening. And if we look at the heat map, we can see how the individual stocks in the S&P 500 performed. Whoops, let me get rid of that little thing there. Uh you can see that Nvidia was up 1.09, Broadcom down 2.15, QCOM was down 1.06, Micron up 3.03, 03 Google down 1.7 the healthcare stocks did not do so well today all right uh except for medical distribution that industry the energy stocks did really well and um a lot of industrial stocks and the utilities actually start to recover a little bit as well uh financials same thing here too. So if we look at the groups for example, you can see energy, technology industrials utilities they were in the in the positive for today and the rest were down. Basic materials down the most, 2.26. The oneweek performance just shows technology up 1.4%. Basic materials down 4.63. And here's the one-mon performance. Technology up 6.93 followed by communication services and basic materials at the bottom 8.86% drop. Real estate has not done well. And uh so that's what we're looking at. Now if you look at the larger picture, three month three-month performance, energy and technology are the leaders. Okay, energy in fact is up 14.2% versus technology. All right, let's get back to the charts and now we're going to take a look at these individual uh ETFs and stocks as I get into them. So here's the SPY, the S&P 500. We're going to start off with a weekly chart. You can see that we are still we we actually are currently slightly under that nine period. That's the green line. So the nine period takes is basically the midpoint of the last nine periods and um that's not necessarily a good good sign. Uh Friday again that's that's going to be the determining factor if we can remain above that very important level on the weekly chart. On the daily chart you can see we're still just hovering right above the Ichimoku cloud. So, it's finding support right there. Now, one of the rules of Ichimoku is you don't want to be adding uh new positions when price is under the cloud like it was back here in March. You wait for the breakout above the cloud. You want price to be above the two moving averages, the green line and the red line, the nine and the 26 period. And you want price to be above the cloud itself. That's the key thing. Um you know, you also see this white line and the lagging here. They call that the chu span. It's a lagard lagging line. It's basically the current price. So, it's the right here going back 26 periods and it's in the line form. So, they projected backwards to see where it is in relation to the candle 26 periods ago. Notice how it's under the closing price. So, the spy has been consolidating now for a little bit here on the daily chart. We're been stuck in this rectangle pattern. And uh yeah, we got to see a breakout either to the upside or to the downside for more clarification of where the market the overall market's going to be heading right now. There's nothing really that we can uh there's no clear direction, right? Except for it's it's actually slightly more bullish than bearish because on the weekly chart we're above the cloud. And same thing here on the daily. Still the QQQ ETF looks the strongest out of all these ETFs. If we look start off with the weekly chart, we broke this trend line. We're still above it. We are above all those moving averages, the 9 period, the 26 period, the cloud. Notice also how the 9 period is moving upwards. You see that right there, how it was flat here and that little uptick there on the red line. That's that's actually quite bullish. Uh if you look down below here, the directional movement index, that also looks very bullish. We've got that um you know, ADX9. I've got this at a faster setting moving up. The green line is above the red line. That's the positive TI 9 above the negative TI9. And so this is what you're looking for. So yeah, it's looking pretty good for the Q's. What about the Russell though? Russell 2000 ETF IWM. Multiple weeks now, six uh seven weeks now we've been declining. And uh here's the daily chart. We are we are finding support right at that dotted yellow line at 200 day. So there's a good chance that we might get a bounce here, but it's uh still bearish territory on the daily. I'd stay out of the Russell. Bitcoin IBIT looks pretty strong on the on the daily chart. We're in a series of higher highs, higher lows. We're above the Ichimoku cloud. We broke through it back here on August 20th and we've already moved up 18.6% since the breakout. The weekly chart is still neutral, okay? Because we're inside the cloud. So, um, you know, when you're, like I said before, if you're under the cloud, that's bearish, negative. Once you enter the cloud, it starts to become, you know, neutral. And then once you break through, now you're in bullish territory. Um, as we were back here when we broke through the cloud. Once you enter the cloud again, neutral, bearish is the decline right there. And so now it takes a little bit of time for this whole thing to uh to show its true colors, right? So, you know, but the shorter time frames are going to move quicker and it depends on what time frame you choose to trade, right? There are some people that trade the weekly charts, others that trade the daily. Then you got day traders trading the three minute and five minute charts. So, you choose your time frame. Everyone can do that. Um, silver SLV is under the cloud here on the daily. So, it's it's looking bearish on the daily on the weekly chart. We're also onto the cloud right now. And uh yeah, it's not the time to be adding. I mean, the only positive thing that I'm seeing is the fact that we are kind of staying at least inside this um little box, this little base. But if it breaks under the low of that level too, it's probably going to see continue to the downside and maybe uh try to retest that 4961, this prior low. Gold. Okay, this one has pulled back and this candle, the low of this candle is 376.88. We bounced off that level. I don't know, you know, if we're going to see a continuation here, but we're still under the cloud on the daily and on the weekly as well for gold. All right, so not the time to be adding positions in my opinion. The Dow has also been has been declining the DIA ETF for multiple weeks. It's um but it's finding support now. So, not the time to to short. Certainly not. We're not under the cloud. We're still above the Ichimoku cloud, but we've been declining for a little bit for week after week on the daily chart. We're under. So, the shorter time frame tells us certainly not to be adding here. I wouldn't be shorting it either. We're right at that 200 day moving average. We're right there. We're literally 1% away from the 200. And this can sometimes be that the you know the actual level that price recovers from because there's a lot of buyers that typically start to come in close to the 200 day moving average. At a minimum we'll probably see um you know some support here. We'll see a stalling and then if if the you know news and earnings releases and everything else come out positive, we're going to see that bounce. Um, FEZ is the Euro stocks 50. This one looks pretty bearish here, I got to tell you. Um, it did stall yesterday. I talked about that. It stalled right at that 200, but then we get the gap down. It gaps down this morning and then continues to drop down 1.83%. So, the Euro stocks I would uh not be adding new positions in here right now on the weekly chart. We can see it's also breaking under that 26 period. So again, we don't have confluence. We don't have both time frames telling us that this is bearish yet. We're still above the cloud on the weekly. All right. This still has we still have um possibilities here for this to recover just like it did back here after multiple a few weeks, you know, like was it one, two, three, four, five weeks or whatever where it got stuck pulling back and now we've been doing the same thing. We might see a bounce when it comes close to the the Ichimoku cloud as well. ETH is in neutral territory. This is the Ethereum ETF. It's in neutral territory on the weekly chart. Just entered the cloud this week on the daily chart. It looks quite bullish. It was up 1.14% today. And so, yeah, we got a bullish cloud here on the daily. the oil K. Let's see. Let's see how far that's moved since the breakout. Since it broke above the cloud right there at the $185 level, it's moved up 36.7%. pretty big move since um the date was August 19th and it started becoming neutral here on the on the daily chart right around let's see July 20th where it started moving sideways for quite a while. Oil K is the ProShares K1 free crude oil strategy ETF. That one has pulled back. It was a big drop today down 3.35%. But notice what happened here. we developed a bullish candle. So, there's a higher probability that tomorrow we're going to see a will. Okay, this particular ETF move up. Actually, there's the gap down and then the buyers stepped in. They weren't ready to allow it to drop further. And you can see it if we switch it to a 3minut chart. So, there's the gap. There was the low of the day. It happened around 9:36 a.m. And from that point, it actually moved up about 1.8% throughout the day. Let's see as time progressed. So, oil came is um not something I'd be sh uh shorting. Here's a weekly chart. We're still above the cloud on the weekly. We're still above the cloud on the daily. We just don't have all of the elements of the of the indicator uh giving us a buy signal here yet. And the VIX is wow. Look, check this out, folks. This is so interesting. I love to see how uh respected this indicator is. I think there there's so many traders and there's a lot of financial institutions that also utilize this indicator. And it's so interesting to see the daily chart here with um the VIX, the market volatility index. Every time price came to that those levels, the cloud level, it it basically stalled and closed under it. Do you see this back here? And the same thing happened here, here, here, here, and here today. This is a daily chart. It it actually penetrated the cloud, came into it, and then the sellers pushed it all the way back down. This is what it looked like on the 3minut. So you can see here we are October 1st the opening price with the green line there that dotted green line moved up to $1761 right and it dropped. So that's interesting. All right let's get into the rest of the stocks and ETFs that they talked about. I've already previewed these. I can tell you the only one that's looking bullish right now is XLK. At least when I say it's looking bullish, um I'm talking about on both the daily and the weekly chart where it gets a blue flag if it meets the criteria of the indicator showing bullishness, meaning price is above the moving averages in the cloud on both the weekly and the daily chart. You can see that that's the case here. The only negative with XLK right now is this level, the 1987, which is a weekly resistance level. That's based on this candle right here. Oops. You can see that candle right there. So, if I hover my mouse there, you'll see the high there is 19873. Okay, that's from June 5th, folks. June 5th. So, we've been since June, early June in this range in technology, which is why it's been frustrating, you know, because we've been waiting and waiting and waiting. And I understand it's it can be very uh when when you're used to like we were in 2025, you know, 2026 it's been, you know, majority of the time the market's been moving up, right? Except for when we had a decline back in November of 2025 through, you know, April or 2026. So remember that little decline, but once we broke through that, it was very positive. Now XLK also broke through through this trend line. So, that's a very bullish um situation here on the weekly. And we just need to break through that 1987. And I think we're going to then see a lot of buy orders. You know, they're probably just waiting right above that resistance level, right around this level here. And then we're going to see it shoot up. But until that happens, and we're going we're going to have to wait for a weekly candle to actually close above it. Will it happen this week? It could happen tomorrow. we are super close to it and if that if we get above that 1987 by the end of tomorrow I think that we're going to see a nice um next week is going to be very bullish bullish okay uh daily chart you know again same thing here right so uh very bullish here on the daily if you look if we draw a trend line across we also broke and closed above these you know these daily highs here do you See this candle here is slightly above and closing above those levels. That's also bullish. And this is a ascending triangle pattern right there that you're looking at, which is a bullish pattern. So, will it break through? That's the question. The volume did in fact come in a little bit higher here today. So, that's good. Okay. The rest of these folks is something off technically, so we don't really need to spend too much time, but I'll explain why they didn't, you know, I wouldn't be uh adding positions here. Chub Corporation. We're under the cloud in the daily chart. Nothing to do. Okay. So, we've got a bearish cloud. That's the single span A. It's under the sync span B. The light color blue line is under the purple line. And uh the only positive I see is a bullish engulfing pattern here between these two candles. And if you're unfamiliar with that pattern, um you can go to my X page here atCloudTrader. So x.com/blcloud trader and we can go to candle pattern reference sheet at the top and you'll find that pattern. Where is it? Right here. It's the bullish engulfing. So when you have a bullish candle that engulfs the prior one. Okay, doesn't matter what size it is. uh then that's very bullish especially when you see this after a pullback when prices dropped. So that's what we're seeing. This has been the pullback we are seeing that there's a you know I'd say there is a good chance that Chub Corporation tomorrow might move up a little bit. Their earning next earnings are on October 20th though. Okay. And we just got back above that 200. So we closed under it yesterday into the 200. Today we closed back above it. Um, so there's a battle happening here. We'll see how who wins. The bears, the bulls. All right, let's take a look at U. MGS, Mags, the Magnificent 7 ETF. Very bullish on the daily chart except for the fact that we've been under the nine period for a couple of day, three days now. We're holding up above this 7116 level. That level goes back to this candle right here. Let me zoom in on it. Well, maybe I should switch it to a weekly because since it is a weekly level and you can see more clearly right there, that's the candle May 15th, folks, of 2026. So, we can see we reached that level. We pulled back. We came here, we found resistance, we broke above it, and we're still holding above it. We're getting a um I don't know what this candle is going to look like by tomorrow, though. Right. So, right now, it's starting to look like a bearish harami. That's not good. But we are above 7116. That's a really critical level to watch. Meta platforms on the weekly chart. Bearish harami pattern. That's this pattern right here. Hold on. Okay. Bullish large bullish candle followed by a small red candle. Baby candle. Harami in Japanese is pregnant. So imagine the adult and the baby right there. Okay. Easy to remember. So that's what we have right here. So there's a slight slightly higher probability Meta is going to pull back tomorrow based on that pattern. Okay, we are above the cloud still on the weekly on the daily chart. We just closed under the 9 period. Morgan Stanley, we got a bullish hammer here. It's a single candle pattern that tends to have a pretty good high uh probability ratio where if price can get above the high of it, this high right here. Okay, if it can get above that level, let me see what the level is. The high of that candle is 18810, there's a good chance it's going to move up. Problem is, we're still under these moving averages. We're still under the 200 day. We're still under the cloud. And so we might get a short, you know, 2, three, 4 day situation where it moves up. And if you want to try trading that based on the daily and maybe a 30 minute chart, okay, you could try doing that. But look, even the 30-inut chart is tell showing you how embedded price has been, okay, for for quite a while now under the cloud. So you're taking a pretty big chance in my opinion. If you look at the weekly chart, we've been pulling back. We're still above the cloud on the weekly, which is good. But, uh, yeah, the financial stocks haven't really done particularly well recently. Netflix is, you know, down 2.49%. And, uh, after hours, let's see what it's looking like. So, um, let me switch it to a daily chart. You can see we're So, we're under the cloud here on the weekly. That's the weekly chart. We're under the cloud on the daily. Not looking good, obviously. And we can also take a look now after hours after 4 p.m. There's a button I'll press up here and we'll see. So it closed down 2.49. Where is it now? Uh down 2.31. So it's pretty flat. It hasn't really done well. Um so yeah, we'll see what happens with Netflix. Not something I would be investing in obviously right now. Stay out of that one folks. Nike uh Nike came out with um I'm sorry, Netflix comes out with their earnings on October 20th. Uh it's I was thinking of Nike. Nike came out with uh pretty bad earnings, right? It was down 085% at the close. Let's take a look at it now after hours because look at that high volume, too. Let's take a look what's going on. Boom. Down 8.84%. So that's what earnings results can do. You can sometimes see them drop significantly if Wall Street doesn't like the earnings announcement and it's getting punished some more. I mean from the highs Nike let's go to the monthly chart here. Um you can see that nice move and even on the monthly chart now we've been under the 9 period since January 31st of 2022. So, since 2022, all right, if we look at the highs here back in uh 2021, that was the the high point right there, the high of 17910 for Nike. Since then, it's dropped down to $326. That's um that's a pretty big drop, guys. That's a that's an 81.9% drop since 2021. So, it hasn't really performed well, obviously. Now, let's keep going. We're going to look at uh Rocket Companies. This one on the on the monthly chart is under the cloud. On the weekly chart, it's under the cloud. And on the daily chart, it's under the cloud. We have a bullish I'm sorry, bullish engulfing, but we're under all these moving averages. It's just not something I would be playing. Obviously, snowflake looks more bullish here on the daily chart. You can see it's above the Ichimoku cloud, but the moving averages are not in the correct order. You don't have the faster green line above the red line. So, that's not good. Um, everything else looks good. Weekly chart also looks good. So, I like the weekly chart. Snowflake looks like it wants to if we have some more bullishness in the technology sector tomorrow, I wouldn't be shocked to see this thing take off. TLT, the 20-year Treasury Bond ETF. Look at this decline here. It's been interesting to witness here. Um going back to let's go to the monthly chart or actually yeah monthly chart. So the high of the 20-year Treasury bond goes all the way back to 2020. 26 years ago was $1812. Now it's $7710. Big drop. Uh W and this is not something I would be adding. WST is the West Pharmaceutical Services Healthc Care Sector Medical Instruments and Supplies. Here it is on the monthly chart above on the weekly chart. It's above the moving averages and on the daily chart it's above the cloud but needs to break back above that 9 period. It was down 1.61% today. XLE is the energy ETF. You can see energy today. We have a bullish engulfing. Okay, that large bullish candle followed by the little baby candle. So, this is very bullish. We have more higher volume, higher probability that this is going to move to the upside in my opinion, but I wouldn't be adding because we get the faster moving average and the slower one here. It's just not um ideal. If you look at the weekly chart, very bullish chart, okay, nothing negative about it. We're still holding up above the moving averages even though Chico span here is above the closing price of that week. So that's good. Financials uh down I'm sorry it was up.1%. Here's a weekly chart. We're under the 26th period. It's been declining for 4 weeks. The daily chart shows you even more what's happening. But we did end the day with this bullish candle long wick at the bottom. So there's a higher probability tomorrow that it could move up. But it's embedded in this decline still. It needs a lot of work before it I personally would be adding this ETF to my portfolio. Utilities, same thing. It's been declining. It seems to be stalling finally, which is good. This week, it's um you know, we can see this little box that's forming where price is just moving sideways now. But again, it's uh embedded in this decline and it's been declining for a while. So, all right. And that's going to do it for this video, folks. If you want to support this channel, don't forget to hit the like button, subscribe, and go to my channel here, BlueCloud Trading. You can find out more about my channel, click on more, scroll down, check out these links. Maybe you want to try out the software that I use, the charting software. There's a link for that, the Finn Viz Elite affiliate link. And with this one, by the way, you also get a $25 coupon for the charting platform if you choose to to uh use this link. Um, you can also become a member if you want to get access to the member onlyly videos that I that I uh post. All right, to do that you can hit the join button right here next to subscribe and uh make sure you select Blue Cloud Trader to get access to the member only videos or BlueCloud Legend if you want to get access to the videos and daily stock and ETF trade updates. And that, my friends, is going to do it for this video. Thanks for watching. Thanks for supporting my channel. I will catch you all in the next video. The ichimoku guiding light. Blue cloud traing through the night. Heat. Heat.

Comentários 0
Entre para participar da discussão.
EntrarAinda não há comentários. Seja o primeiro a compartilhar sua opinião!