…for chips and they are designing the chips. I'm always looking to see what we don't own in G uh JT that we could own. We don't own Synopsis. Synopsis port will be reporting in December. You like Synopsis, right? I think off Cadence report. You want to own Synopsis. Pterodine will report tomorrow. Watch Pterodine. That has been under the radar. That semi equipment name has struggled mightily off of that report. I like Pterodine. Again, we don't own it in the ETF. Therefore, personally, I'm interested …
You want to own Synopsis.
Contexto extraído por IA
I thought Cadence's quarter was phenomenal. The stock has pulled back. It's very obvious that we have significant demand for chips and they are designing the chips. I'm always looking to see what we don't own in G uh JT that we could own. We don't own Synopsis. Synopsis port will be reporting in December. You like Synopsis, right? I think off Cadence report. You want to own Synopsis. Pterodine will report tomorrow. Watch Pterodine. That has been under the radar. That semi equipment name has struggled mightily off of that report. I like Pterodine. Again, we don't own it in the ETF. Therefore, personally, I'm interested in it.
Transcrição Completa
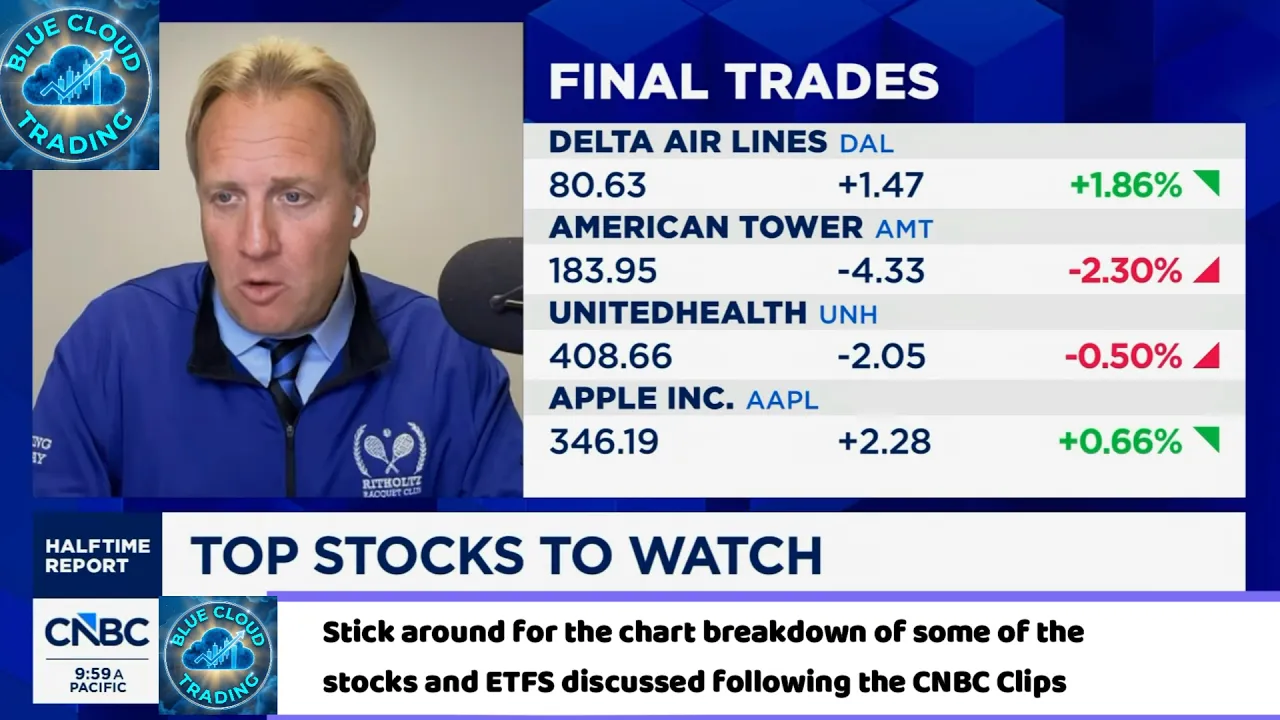
Blue cloud trading [singing] through the night. >> Welcome [music] back to the channel everyone. In just a second, I'm going to play a few CNBC clips. I'm going to pull up the charts and [music] dive into the technicals and see if the price action actually backs up what the talking heads are saying. Subscribe if you haven't already and let's roll the tape on the first clip. >> All right, guys. That was good. Welcome to the halftime report. I'm Scott Wner. Button center this hour, the latest in the AI trade. Ahead of some key earnings reports we'll discuss in debate with the committee. Joining me for the hour, Joe Tteranova, Stephanie Link, Jenny Harrington, and [music] Josh Brown. Speaking of the AI trades, it's looking pretty good today. In fact, the NASDAQ looks to be around the highs of the day. It's good one and one and a3% as we see. We're going to get to all of that, trying to game out the earnings and everything else, but we do have breaking news on this very topic. It's related to OpenAI [music] and Oracle and Sema Modi has that for us from Las Vegas. Sema, >> hey Scott, Oracle announcing that it is adding OpenAI's AI tools uh including chat GPT to its application stack to make its data uh more accessible, more actionable. We're expecting OpenAI CEO Sam Alman to join Oracle cocoalay murk on stage momentarily here in Vegas at AI World. Uh in addition to this news, you have Oracle cloud infrastructure expanding the number of accelerators or chips that can run on its cloud including Google TPUs. And what we're told that this is the first time that Google chips uh agel AI chips will run on a hyperscalers cloud that isn't Google. This announcement also including open aa jalapeno which is the frontier labs chip and cerebras. They're also part of the announcement. I spoke to Oracle's head of cloud about whether this marks a potential departure from Nvidia GPUs and he said that's not the case. Nvidia is still considered the strongest chip on the market. But at a time where chips are incredibly scarce, the market wants more options and that Oracle is hoping by offering more chips to its customer that that increases demand. Especially as the market Scott moves from training to inference as soon as Alman gets on stage. We'll get you his remarks. Yeah, you let us know please those headlines as he makes them. Sema, thanks for bringing us the news. We'll watch all of it. It's impacting some stocks, especially Oracle, which is getting a nice lift, up 4% in its own right. We'll watch Nvidia and sort of everything else in the orbit as we really do dive in to this trade, which has been acting much better this week. There's no doubt about it. Got the anthrop anthropic S1 out of the way. Broadcom got a big upgrade today. We can just cycle through, show the shares. We'll talk about them later, but nonetheless, a big winner. The semis are up. Most of the hyperscalers are doing quite well. How about coreweave too? It's notable because the CDS is the narrowest it's been in about a week. So that's taken a little bit of the edge off the market related to all those funding concerns. Rates have relaxed a little bit too. That has clearly helped heading into a Fed meeting this week where we really don't expect anything at all. So there's the tenure which has come down. It's still below 5% as you see. And by the way, positioning is a lot cleaner as well and that's significant. And that's where I want to begin with you, Joe. You've been talking a lot about that uh on our show. Wells Fargo today says, "Interestingly, correlations versus semis for hyperscalers and software have flipped positive over the past month, unlike in July. We read that as a sign that the market has treated AI tech indiscriminately and see opportunities in hyperscalers and infra software. Still, the market's going to want to see capital discipline, but nonetheless, the positioning environment looks and feels cleaner. >> It It does. And I think that's an excellent setup for this return of optimism that I'm anticipating us to close 2026 out with. Um I think you want to focus on the large cap names. I think that's where you exert the discipline that they cite there in their report. What I would like to see this week, and we're getting a glimpse of it today, and I feel good about that, is when we get good news surrounding AI, I want there to be a good reaction. I didn't like the reaction that we had last week from Western Digital. I didn't like the reaction we had from Lamb. I didn't like the reaction in September, subsequent trading in October from Micron. Today you hear the news about this collaboration with Oracle and Open AI and you see Intel is up 4%. You see Cerebus is up 8%. You see that Nvidia is rallying. That's what is important. I like that type of reaction. I want follow through for the remainder of the week as we hear from Microsoft and from Alphabet and from uh from Amazon and [snorts] really the industrial heavyweights. I mean Steph, I know you're going to be watching this as well. We're going to hear from Quant Services. We're going to hear from GE Vernova. We're going to hear from Verdive. I want to hear some good news, some good guidance, but I want good price reaction afterwards. >> Yeah. I mean, let's not kid ourselves. The the movement lower in rates has definitely taken um step the edge off of this market. It's helped that this story in general if you you know again the CDS which has been more focused on in some names including Oracle by the way over the last handful of months has certainly looked a little bit better and there's a good example of of what we're talking about here. There's the core story. So you're getting the benefit of that uh and maybe some optimism around it. Adam Parker says we doubt the AI trades over even if it ends up being a 7 to 8year investment cycle. We're only halfway through it now. We highly doubt selling the exposed [music] securities this far in advance is prudent. >> Yeah, I mean I think we're in the fourth inning in AI and I think we're in the third inning in cyber security and the first inning in robotics and those are my three favorite themes. They continue to be. They have been for years. But I totally agree with you on the rate story calming down. I think we needed rates to come down. They have about 42 basis points. That's a lot for the 10year. Um it's it's kind of like you know now it's not front and center at this very moment. That's right. It will be again at some point but it's not front and center. Now front and center is the earnings tech earnings now only I know only 20% of the earnings um companies in tech have reported tech has reported 200% earnings growth. Comm services 48% earnings growth. Those numbers are kind of move around a lot but it's good. That's my point. earnings. Stocks will follow the earnings and I expect this semiconductors to have very good results. I think the hyperscalers are continuing to spend and now the good news is they're getting financing whether it's debt, whether it's equity, whether it's private markets and they're telling us it's not going to end. And yet the stocks are hanging in there and monetization. Last week we saw SpaceX see monetization in their AI rental business up 700%. We even saw Meta see monetization up 26% in total revenues. And so overall, I feel better. I think the setup is really good. I think we're going to lights out tomorrow and this week on the industrials, no question. And they're down 20, 30, 40%, too. So, I like that and I agree with you. I want to see a good price reaction and I think we will because they sold off so hard into the prints. >> The key is Josh that the setup is just better. Um the the stocks, some of them have come down a fair amount. uh all all around the the AI universe and positioning is better set for maybe a more positive reaction to some of those earnings reports than we got like the ones Joe was talking about that really started with Micron had really good results not good price action lamb western digs you can even throw meta in that you know group if if you really want to what do you see >> I love the setup I was on the air two weeks ago when I think rates were peaking we know it was peaking at the time, but I asked the question rhetorically. I said, "No one's asking the most important question, so I will. What happens when rates back off?" Remember, when something is at a high, it looks like it's going to keep going up forever. And when something's at a low, it looks like there's no end in sight. But that's not how markets work. Things get taken too far. Um, and I think in that moment, we were looking at uh five and change percent rates on the 2-year and pondering six. And now we've got rates backing off and almost like somebody blew a a dog whistle. All the hounds are barking again and uh you you see you see action coming back to some of these areas and I agree with what you said about the setup. Um here are the three cheapest stocks in the market using PEG ratio. I know farmer Jim's not on today but he would appreciate this. SanDisk is currently selling at a PEG of 0.08. So people who have been investing for a while um when they hear a number like that it's it almost sounds unbelievable. How could that be? It's true. Micron10 PEG Western Digge.13. Earnings expectations for tech are not coming down. They're going up. We have an anti-bubble in valuation. Nvidia is selling at 15.3 times forward earnings. Nvidia is 15 times earnings. So I do think the setup looks better. any kind of relief on rates and oil and that whole Mishagas uh is greeted with a tripledigit rally for the NASDAQ every time you could you could set your watch by it. So um I think we're in a better place. Uh you've got momentum uh the momentum area of the market has taken a big step back. That's what sets up the next move higher. Um, and and right now when you think about the type of earnings that we're about to get, like what we're going to hear from Amazon on Thursday after the close could be absolutely explosive. And I know we'll we'll do more there. Last thing, Stephanie's right on cyber being in the second inning or the third inning, what whatever it is. Um, people don't even understand the degree to which these cyber securities are poised for the next 5 to 10 years. I was talking to George Curts from CrowdStrike yesterday. They have just laid out a credible plan where they get to 10 billion in ARR one year earlier than expected in 2030 and potentially $20 billion in ARR by the middle of the next decade. And it does not require a ton of mental gymnastics to understand how that happens. It's just the growth rate that's happening right now in AI, Agentic, etc. and all of the work on safety and security that will be required if any of that comes to pass. >> Jenny, I I'll give it to you as as Josh puts an overhead smash on the market bears. He just went full Boris Becker >> on on the group. >> So, I think um >> What time is your court time, by the way? You have time until the end of the show or or or what? >> 1:15. 1:15. I'll stick around for finals. >> All right. just making sure. >> So, I think I think we're doing a disservice to be um focusing so narrowly because I think this positivity could be a lot broader, you know, and as Steph said, she thinks that the industrials could be really good. Um I think the reason when Josh talks about the PEG ratios being so low, the reason is is that there's so much skepticism over the growth rates. So, we could have a blowout report from Amazon, but you could see a muted response, which is what we've seen happen to Nvidia over and over. >> Well, anything could happen. But why would you do why would that happen? finish what I'm saying. So, I was smacked in the face this morning when I read the earnings roundup that I read in Vital Knowledge. And here's what I read. Hilton solid upside. Coke strong upside. Polaris solid upside. Royal Caribbean upside. S&P Global, TransUnion, HCA, Freeport Kirk Hubble Johnson Controls, Pantair, Corning, everyone has strong upside. And so I think we need to like broaden the lens on realizing that maybe all of this economic activity from AI is bleeding out further. >> Well, it's about time you got bullish, Jenny Harrington. >> Well, you know what? You may have Do you have like a pint of ice cream this morning for breakfast? >> Yeah. And six coffees. No, just kidding. Um, but I just think it's an interesting thing and I think I think we need to be careful with expecting the big upside responses in the share price to come from just the tech trade. I think it could be broader because there's expectation in the Amazon, right? And there's skepticism about those growth rates. But that huge list that I just mentioned, no one's paying attention, right? And so there's not expectation for those growth rates. >> A lot of those are momentum names. It's interesting. Coca-Cola is a momentum. >> By the way, Momentum's coming off its best day since September 21st. >> It it should. And I think uh the setup for momentum as we move towards the end of the year is excellent. because you had that positioning and sentiment recalibration in Q3. That would caused most of the the volatility in the market as some have suggested over the past you know few two three weeks just a sort of changing of positioning which made people question the story when it wasn't really worth questioning but people started asking all these questions about uh crunch for cash how are we going to fund all this look at cororeweave every day and on and on and on building trying to build a more negative negative case by the hour when nothing fundamentally changed did it? >> Yeah. So the the the correlation to the delta for yields is what impacts where the momentum factor goes. If you think about 22, the momentum factor had a awful a very punishing year because of that rapid rate of change in where yields were. And in August and September, it was a very punitive environment because yields spiked so high for the momentum factors. >> And by the way, when yields came down the the way they did, that was unprecedented too in that one day. Yes. What did you have like a 20 plus basis point move in the 10-year yield? >> Yes. So there's a very strong correlation that I continue to watch between the rate of change in yields and what the momentum factor ultimately does. And it's one of the reasons why I've been over the last week as bullish as I have been for the setup for momentum into the end of the year because I'm seeing the relaxation in yields. >> What about Broadcom, Steph? Let's let's hit that because it's a I one of the reasons why the market looks as good as it does today. >> Uh it's certainly one of the stocks that's getting a nice move of near 4%. Couple of catalysts here. DA Davidson goes upgrade on this to buy from neutral. 400 is the new price target was 350. It's on the doorstep of that. They take it even higher. Then they have the the debt deal with Anthropic. Um why don't you just talk about you know what you see in that name? >> I mean they've been guiding their AI revenue for 2027 to be 115 billion to grow to 230 billion by 2028. Now that they've done the anthropic deal that has secured about 60 billion in revenues for 2027. So that was the thing. Could they actually do these numbers? And this is what the company guided to on their conference call. Nobody believed them. So I think that is the catalyst number one. Number two, they derisk [clears throat] gross margins and operating margins. They're not falling off a cliff. Gross margins at 73%. Operating margins at 66%. Very, very healthy. You add it all up and you have something like $22 in earnings power. By 2028, that make that puts this stock at 15 times. It is down 2% on the year. The socks is up 60. So to me, the reason I've also bought Nvidia, same thing. Like I don't understand these companies are putting up such great numbers. Estimates are going higher. They've definitely taken a pause year to date. I think there's opportunity here. >> I think there is, but I also think it comes with a lot of risk. And I think that's why it's down 2%. And this goes back to the AI trade being on and and me saying like I actually would like to pick on the word indiscriminate because I think it's been very discriminate, right? And there's different things being picked on. And I and Scott not with respect to momentum but you said has something fundamentally changed and I think something fundamentally in the bigger um in the bigger landscape has changed which is that for the neocloud players right like funding has dried up and I think there's a problem and I don't know what the problem is but I think there's a problem when the CEO of Broadcom needs to intervene in the funding of another company because what that says to us is several months ago right you could just get as much money as you wanted to but now you You see new cloud funding drying up. You see the need for an intervention that might be fine for Broadcom, but it says something about the bigger industry. >> You're talking apples and oranges. You're talking apples and oranges there is has a horrible balance sheet >> for sure. >> And guess how much cash Broadcom is generating every quarter $18 billion. And same thing with Nvidia. They're generating $48 billion a quarter. Their balance sheets are great. They can fund if they want to and they obviously want to. And there's real demand there. But a different animal. >> I don't think my point wasn't on on Broadcom. My point is just that the statement that Hawk Tan needed to intervene says to me that something has fundamentally changed out. >> He can and he can because he's got the balance sheet to do it. >> But the fact that Anthropic needed him to right that needed them to weird I think there's a weird to me like vibe from the word intervene that he needed to intervene to get that done. >> I knew your bullishness was too good to be true. What I didn't realize is that it would un it was it would unravel in merely 2 minutes and 30 seconds. >> Yeah, but I think I think that's unfair, too, because what I'm saying is that there's nuance, you know, and this is what I've been saying for a while. There's nuance that you need to be careful with. So, you can't go all in on AI. You need to flesh it out. I think you're right. Broadcom's cheap. You know, it's cheap on every measure. But there's something >> saying that you need to go all in on AI because I haven't heard that from Joe or Stephanie. >> Josh, you're derailing. I'm just saying there's something out there. I just think there's something out there that has fundamentally changed and I think we need to keep an eye on it and it has to do with cost of funding and liquidity and availability of funding and I think I think it's weird but like okay this is obviously where I am anyway you know I'd rather put my money in those in the companies that the kinds of companies that I listed earlier right which is frankly where your money is too in these like cash cows you know slow and steady like not even slow and steady but steadier growers I think I all I'm saying is like I think there's a pocket bit of toxicity lurking out there and that we've seen a couple of highlights um or maybe spotlights on where things are brewing this week. >> The market's doing a very disciplined job of doing exactly what you're talking about. the market Stephanie which is why and others others are are not going and suggesting okay coreweave is the opportunity >> in the case of Broadcom what they're doing I would say anthropic is a completely different relationship than a coreweave would be the need for capital for coreweave versus anthropic is totally different I don't think we're missing the point I think we're all saying basically the same thing the market is narrowing the AI opportunity and it's exploring where there are better balance sheets and capital is going in that direction. It's very clear none of us is saying none of us I haven't heard anyone say go buy a neocloud go buy core weave >> no I'm just saying something out there shifted like I wanted to latch on to something yeah something fundamentally changed this week >> you're right something has shifted the cost of capital has gone up and do you know where the benefit of that idea is is found in the traditional hyperscalers who are selling mops and brooms and have the cash flow from their other businesses to fund in a way that the Neoclouds don't and the market has sused that out and I think it's very obvious when you look at the performance of the Neoclouds and the volatility there and by the way they don't just go down every day some days they go up a lot but the volatility there versus the steadiness of Alphabet Microsoft and Amazon in the last four weeks the market has correctly surmised what you're suggesting we're not arguing so you don't have to add the last word trust me >> I added and to that end as you know a few weeks ago I added the Google the alphabet Google convertible preferred end because I want to play that traditional hyperscaler part. I think it's undervalued. I mean it's down 10% in the last week or so. I think it's silly. I think you know let me finish let me finish my thought. Let's all be aware the same field that we have been. >> Okay great. And in a market with pockets of te uh toxicity which sounds like a Drake album title. I like it. in a market with pockets of toxicity. Thank God we all are observing these things and pointing them out as they happen. Incessantly in the case of Core Weeave, incessantly in the case of the private credit uh uh names like this is not some sort of situation where like everyone just buys everything every day and valuations don't matter and blah blah blah. We have substantial deratings happening in the SMH. We're not seeing SMH names at 52- week highs despite the fact that semiconductors will be the biggest single contributor to earnings growth this quarter. We're not seeing wild moves in Oracle, which by the way, $1.92 versus $1.74. Solid beat. Western Digital $4.64 versus 411 expected. We're not seeing these stocks do cartwheels. >> So, I think the market is fairly >> sure. But I think this goes back to like you need to treat a PEG ratio, a PE to growth ratio differently in this moment maybe than you have historically because the growth is suspect, right? Like even for Western Digimon Sanders, there's a reason like why is Micron still trading under 10 times? Because like you know with the numbers that they're putting out, they're amazing. Why? Because everyone's skeptical about the growth. I'm just saying let's pay attention that we're in a market that's that's different than it has been. I mean, it always trades under 10 times, doesn't it? >> It's trading five times, actually. >> But that's the thing. You'd think with the growth being like what, 200% 300% earnings, you'd think like, oh, shouldn't that multiple expand? No, because they're so skeptical. Everyone's so skeptical about what the earnings growth up22. So, I mean, they have delivered. People have gotten rewarded. >> Like, oh, and it's down 25% or whatever. >> 5 billion of debt on their balance. They're generating a huge amount of cash flow. It's earnings. Historically, it trades at 10 times earnings. Yeah, maybe they are, you know, skeptical about the growth over the long period of time, but I mean, they got they've got dollar, they got over a hundred billion dollars secured between now and 2030. I think it's just a matter of time that the stock does rebound and and and general just the higher quality semiconductors. >> Can I give you two potential new AI trades? >> Go ahead. Wow. >> Yeah. Off of Cadence, I thought Cadence's quarter was phenomenal. The stock has pulled back. It's very obvious that we have significant demand for chips and they are designing the chips. I'm always looking to see what we don't own in G uh JT that we could own. We don't own Synopsis. Synopsis port will be reporting in December. You like Synopsis, right? I think off Cadence report. You want to own Synopsis. Pterodine will report tomorrow. Watch Pterodine. That has been under the radar. That semi equipment name has struggled mightily off of that report. I like Pterodine. Again, we don't own it in the ETF. Therefore, personally, I'm interested in it. >> You serving up here for best stocks in the market. Boris, >> we uh Thank you, Judge. We wanted to revisit two names that had been on the list and were caught up in the AI funding crisis of 2026, which took place approximately uh I don't know 7 to 10 days ago. Um the first one is Meta. This stock is now off the list. So, we came on at the end of September when it had just been added to the list. The stock was about 750 and it was rocketing higher on the launch of Muse. Unfortunately, they followed it up with massive equity issuance and more questions about their funding, etc., etc., and the stock just couldn't hang on after they reported earnings. What we're telling people now is if you followed where our risk management was, you were stopped out at 685 on October 22nd. We are not re-entering. The name is off the list. I think if you want to get constructive here for a trade, you need to see the stock take back its right uh its 50-day which is about 664 before you do anything. Um the investor stop was 626 which also took you out in the name. Uh and I just think there are too many stocks that are going up right now to worry about when is the meta bounce going to take place. So I'm not talking about it as like a long-term hold. I'm talking about the intermediate term. My best guess is this name's in the penalty box. The other one is still on the list and I like it. Cloudflare. Let's put up ne. So they run this global network that sits between the internet and the customers. Meaning the companies that put up websites and apps. They sell security and a developer platform allinone. So companies can not only build applications but they can run it on the same network. The growth is explosive here and a lot of it now is agentic. Management said nonhuman traffic on their network is now more than 50% of all traffic. AI agent requests are up 1,700% year-over-year. Cra uh Cloudflare is sitting right in the middle of that. So, this name has pulled back with the other AI stocks, but it caught itself. It's in the midst of a little bit of a V-shaped recovery. Um they're going to report earnings on November 5th after the close. So keep an eye on it. The stop for traders we're giving people is 299, which is the top of the dogee it printed on October 20th. A close below that means the bounce failed. If it stays above, I think you want to remain constructive in Cloudflare. >> Hard to find anybody who's negative on anything cyber related, >> especially with the last name Terteranov and Link. [laughter] >> Cyber years, right? So cyber has been remarkably powerful and I think it's broad-based. It is companies that are well known like your your crowd strike, your Palo Alto. It's lesser known companies with great balance sheets like forinet. And then there's the one that I believe is the takeover target which is octa. Um to me that's a tremendous opportunity as well. Yeah. I just recently bought Zcaler because it's only up only up 15% year to date, but PaloAlto and Crowdstrike are up over 100%. And I think the stock the valuation at a 50% discount to EV sales really doesn't make a lot of sense. And their RPOS are growing 27% and their ARRs are growing 25%. So I think it's going to play catch-up. I don't know if it plays catch-up to 100%, but I do think it plays catchup. >> Final trades. Josh Brown, what do you got? We see what happens to the market when rates come down. When if and when oil comes down, Delta is going to act like it's on a trampoline. They've just absorbed 6 billion in uh energy costs, fuel costs this year. It won't always be this way, >> Jenny. >> Okay. American Tower, great growth prospects even before SpaceX became a customer. >> United Healthcare, >> Apple. All right. Good stuff. I'll see you at 3. The exchange begins right now. They're pretty good. Trust me. Trust me. All right. Welcome to Closing Bell. I'm Scott Wner live from Post 9 here at the New York Stock Exchange. You like Charleston shoe? >> All right, Mike Wilson will be with us in just a moment. This make breakout begins with this rebound in AI stocks, whether positioning in that group is cleared enough to launch the next [music] phase of that run. We'll ask our experts over this final stretch, including Mike Wilson. In the meantime, the scorecard with 60 to go in regulation looks like this. Tech's leading. NASDAQ [music] is outperforming today. Very much representative of what I'm saying. Good day for semis, right? Look at that trade. Broadcom's [music] up 4%. AMD, Broadcom did get a big upgrade today. Most of the hyperscalers are higher. [music] Alphabet and Microsoft are getting set to report tomorrow going in slightly opposite directions today. We'll [music] have reports on both coming up. Open AI Sam Alman making some fresh comments today in Las Vegas and [music] we are there with the very latest as well. It takes us to our talk of the day and Morgan Stanley chief US equity strategist Mike Wilson. He says the correction in AI stocks just about over. He's with me here at Post 9. It's nice to see you again. Welcome back. >> Thanks, Scott. >> Is is that the what we should take away? It's a it's about over, but not necessarily yet. What can you tell us? >> Well, we've laid this out as a way to think about it, right? Which is we think there are several clearing events that we still need to get through. I mean, you know this well, Scott, you follow this stuff dayto day. We've been in a correction mode for probably four or five months, right? Really started in June. We we labeled that the midcycle transition, peak rate of change on earnings growth. There were some concerns around funding perhaps, you know, credit spreads widening out. the Fed started hiking rates. So, there's a lot going on. The market, I think, has digested this very efficiently. All right. And I would say 80 to 90% of the breath destruction that I that normally happens in these has already happened. So, all we're waiting for now, we don't know the answer because we don't have a crystal ball, but what I would say is a thing that's missing is kind of that S&P 500 catching down to where the breath has been. >> Okay. So, you're speaking to what we talked about on so many occasions under the surface. Yes. >> Below the the highest of the cap weighted part of the S&P 500, the market looked horrible. >> That's right. >> You had a whole bunch of stocks that traded terribly. >> Why do I Why do I need the top to come down? >> You don't need it. But typically, when these corrections happen the way they've happened, you usually get a meeting in the middle. So, as you know, last week and a half or so, the the average stock, the equal weighted, has started to outperform. To me, that's encouraging. That tells me this is going to cascade into something more severe >> even if it's dominated by defensive names which which it has been >> well in in the last week that was but recently we've seen more of the cyclicals do better for example >> well in the last day or two >> yeah but I'm seeing but it's evening out again you know we'll see we'll see how it goes so here's a way to think about it the way we think about it >> okay >> three clearing events that I think are somewhat obvious and one maybe not so much so the first one's midterms clearly that's a typically a headwind for for multiples and for stocks people get nervous we don't know what's going to happen post midterm terms, okay, but 100% of the time since 1950, the market goes up nicely over the next 6 or 12 months. So that should be a potential catalyst. Number number two would be around this AI funding concerns. There's been a ton of supply. Okay, it continues to be a ton of supply. The market is being very judicious about who it's going to fund, who it maybe is not going to fund, or the price of that funding goes up. We're in the midst of that right now. That probably should be cleared in the next month. And the last one is around the Fed. So we have a meeting that's going on now. Oh, we'll find out tomorrow if they're going to raise rates. Probably not. But it's not about raising rates. It's about liquidity, which is kind of harder to measure in the context of an economy that needs a lot of liquidity. So, we're just wrestling with all of these balls. My best guess is that we could have a finishing move 50/50 in the S&P. If we don't, then we can actually go forward without the S&P having that little little final correction. But either way, Scott, I'm very constructive on the next six months as we work through this because most of the correction is already over. >> Okay. So, you still think 8,000 is possible? >> Yeah. >> For the S&P? >> Oh, 100%. I think >> that's your base case. >> That's our base case for year end. But, you know, December 31st versus January 15th, right? Yeah. But you you the main message here is I think you could go blow through 8,000 into the first part of next year. We have a $8,300 price target for May as a base case. And if all of this happens in a way where you get the Fed to be maybe a bit more dovish, that would be fuel for you maybe even something higher than that. >> So you think that the broadening trade which is showing some signs of life in a more positive way, right? The the cyclical areas now coming along with the more defensive areas is what can ultimately propel you to the more lofty levels. If if that happens and then you combine that with the AI trade which you still think is durable, right? >> Absolutely. Well, that's the that's the ultimate bull story, isn't it? >> Yeah. It's it's it's not one or the other. It's both working together. Like earlier in the year, right? Remember our our call beginning coming into this year was there was going to be a broadening. There was up until basically May or June when you got that rate of change on both uh growth and earnings and the Fed. The rate of change on the Fed was probably even more important. And the real realistically, you know, the breath didn't really break down in the market until Jackson Hole. it was that's when the market really started pricing in a much more hawkish Fed. So that that's kind of the thing that needs to change. We need to the market needs to get more comfortable that that Worsh and the new Fed together is not going to go overboard on this hiking. >> I mean that's a wild card obviously. Not that we expect anything to happen tomorrow. But I think I think the majority opinion on from the investing community is the Fed's going to hike at least one more times. >> One time is not is less than what the market's expecting. So let's go back >> one more time. Two more times, you know. >> Yeah, exactly. But let's let's go back to Kevin Worsh and his, you know, his philosophy, which is doesn't really want to raise rates that much higher because that that hurts Main Street. Okay. He wants to let the market kind of tighten for him. Well, it kind of has, right? The back end went up above 5%, went to 535. Yeah. Financial conditions tightened tremendously from the energy price spike, which had he had nothing to do with. So he's I'm sure watching these financial condition metrics. He's probably pretty pleased that the market has done a lot of tightening for him. And I would I would be willing to wager that that now he probably has to hype less on rates. >> It's almost, you know, in many respects it's not even necessarily about him at this point. It's about the more hawkish, you know, presidents on the committee who are decidedly more hawkish. Not all of them, but there's a pretty good battle inside the room. That's something maybe most interesting to watch over the next meeting or two is is the the level of disscent, what that signals about where they may go from here. But on the point of rates, so what do you make of the way that the 10-year yield came down so quickly? What what was the message in that? >> Yeah. Well, I think there's a couple messages. A, it probably overshot to the upside that the market went to the neutral rate. And this is kind of what I think the chair has been wanting. He's like, "Let the market take us to where it needs to go to kind of slow things down." So, we went from what I would call a bare flattener, right, to a bull flattener. So, this is your defensive trade. So, the market is wrestling with this. We don't know exactly what the market is saying, but what the market might be saying is, hey, there's been enough tightening here between energy prices, backend rates, and maybe one Fed Fed hike that we're looking out now. Maybe growth is going to decelerate more than we think. So, maybe we should own a little bit more defenses. Maybe we should own a little bit more duration. And that's the market once again adjusting again to uncertainty, right? So I think it's quite I think it's quite healthy and actually quite brilliant by the markets. >> How do you see the idea that positioning feels like it's cleaner than it than it was before? You you've had a lot of deleveraging hedge funds de-risking and now the plate is set once again to to start eating. >> Right. So this is the one area where our work is not fully complete. So let me tell you where it is complete. We we have a large prime brokers business. We you we deal with hedge funds quite a bit. They're very derisked. I mean they're at the zero percentile for the last 12 months. I mean it can always get less risk less risk takingaking but they've deris quite a bit. >> Isn't that bullish? >> That's one retail systematic strategies passive flows not quite there. And then we have these other sentiment indicators that we look at. It hasn't quite gotten to a level we like to see to say okay all clear like there's like all the risk is priced. But once again, Scott, we're not talking about 10% downside in the S&P 500. Even if all these things kind of come together. We're talking about 5% probably worst case, it's not that big a deal. >> Well, people are going to take that as a pretty bullish indicator. And and what about the idea of of competition from bonds to stocks, which probably led to some of the upset, too, that you know, the yield just got too too good to ignore, particularly on a real basis. So real yields 2 to 3% that's as good as we've seen in 20 years. So I think you're right on all those counts. Some defensive posturing, you know, some s some worried worry about maybe growth slowing next year more than people are thinking. Let's buy some duration and then just pure value. It's just value with a 2 to 3% real yield. 100%. >> Good to see you again, Mike. Thanks for coming by. It's nice to see you in person. Mike Wilson. >> Hello everybody. Welcome to Blue Cloud Trading. I'm George and it's Tuesday, October 27th. In this video clip, we're going to go over the indices. We're going to look at the stocks that were discussed on the halftime report and on closing belt. uh not all of them but a good portion. We're we're talking about 11 ETFs uh that you see right here on the lefth hand side including gold, silver, Bitcoin, Ethereum, the SPY, oil. We'll look at Apple, Microsoft, Amazon, Crowd Strike. You can see a whole number of stocks there, Google, Intel, Nvidia, forget about it. It's going to be 34 stocks right there and ETFs all mixed up including the sector ETFs like XLI, XLK, XLY. and then we'll take a look at some of our members requests STRL and CIVR. Now, before we get started, I just want to show you guys uh also the heat map very quickly and let's see how the stocks did in the S&P 500. You can see that the majority of the semiconductors here were all in the green, right? They were all in the green. Um we had some in the software infrastructure, a couple of red there and software applications like CRM, now ADP, Adobe, they were down into it was down. Um, consumer defenses did not do so great today. Utilities were green. Industrials are mostly green. Um, meadow is down 1.65. Netflix was down 2.16. Energy stocks did not do particularly great today. Not all of them. There were certain segments like the uh oil and gas midstream. You can see a couple of stocks that did pretty well like Williams co Inc. If you look over here uh under the oil and gas equipment and services uh some stocks that did pretty well there as well. Now the key thing that keep in mind folks is that this coming week all right tomorrow specifically and on Thursday very big events taking place. Well impactful. All right high impact. See the three dotted red little boxes right there. That's for these specific okay releases that will be taking place on two at 2 p.m. tomorrow the Fed interest rate decision at 2 p.m. FOMC statement and the Fed press conferences at 2:30 p.m. on following that the next day. So that's going to that's going to have some impact on the markets. Okay, we will see the markets either um continue in this uh rise that we had from today or we might see a pullback. But 2 p.m. is the is the time we're going to see a lot of volatility for sure. Uh Thursday in the morning 8:30 a.m. prior to the market open, you'll see the core PCE price index month over month. That's going to be impactful and so is the GDP growth rate quarter over quarter. Okay, let me see if there's a few more here. Yeah, there's a couple more also taking place at 8:30. The personal income month over month, personal spending month over month. Friday shouldn't be um particularly impactful. You can see this little orange boxes here. So, it's nice to have a visual aid to help us assess what might transpire. Now, let's go ahead. I'm going to get into the technicals. We're going to look at, like I said, a whole bunch of things. And I'm not going to spend too much time on each one. Um, because we're using this indicator. It's called Ichimoku, and it's visually, it gives us a a visual picture of what's transpiring at the moment, in the moment here on this daily chart. Each one of these little candles represents a day. Okay. And you can see the price of oil K. This is the ETF, the ProShares K1 free crude oil strategy ETF. All right. And right now we're around 6110. Okay. Now, why is this indicator uh important? Because it shows us exactly where price is in relation to some moving averages. The green line that you see right here, that's called the Tenken. It's the midpoint of the last nine periods. Okay? Midpoint. takes the high of the candle, the low of the candle, the low of the price of the day, divides it by two and gives you that midpoint. The red line is the 26th period, the midpoint of the last 26 periods called keunen. Then you've got the cloud itself, the Ichimoku cloud, which is susp. And the green, this light blue colored line here, the single span A is derived by taking the midpoint of these two moving averages and projecting it out 26 periods into the future. That's correct. And then the purple line, okay, u basically is derived by taking the midpoint of the last 52 candles, in this case 52 days, projecting that not under the candle but 26 periods into the future. And then that develops and and plots the actual cloud itself depending on the thickness of the cloud. Uh that also shows you the the strength of the trend as well. And what we're looking for is for price to be above that green line, the red line, the cloud. And there's one final moving average and that's actually today's current price, okay, which is 6110 projected in a line form here and closing prices. All right, 26 periods into the past. Now, why is that important? Because we can see where that current price is in relation to the candle 26 periods ago. If that white line is above the candle 26 periods ago, that's very bullish. In this case, all of the elements of Ichimoku are very very bullish, okay, on this daily time frame. But that's not all. I would suggest that you also review the weekly chart to get a bigger picture of the longer term. Right? So now we're looking at weekly charts. Each one of these candles represents a week. And you can see that um we're we have all those elements applying in this case as well. All right. So price is above those moving averages. They're in the correct order with the green line above the red line. That's important as well. We also want that senko span A above the senus span B that's important and chico span here which is the lagging line is above price that's perfect okay now if we get those qualifications on both those time frames guess what I give it a blue flag okay the rest of these ETFs do not have that and I'm going to explain why and so right now oil K is still looking very strong even though it was down a half% today now the SPY which was up.56% % looks fine on the weekly chart. No problems here. In fact, if I show you guys um throw some trend lines here, you'll see that we've got some consolidation boxes that have developed here. What that means is price has been moving steadily sideways for a long extended period of time. When you're looking at a weekly chart and you and you're seeing this type of tight consolidation, that tells you that the market doesn't know where it wants to be right now. Okay? neither the buyers nor sellers are going to have enough conviction right now to like move one way or the other. Okay? So, it's more of a hold position. You know, if you're if you if you got a uh many stocks in your portfolio in this scenario when the S&P 500 is moving sideways, and this is, you know, um what you want to look for first to see how the the health of the market is, what we've got is just sideways action. So, this is more of a hold uh scenario. Uh there will be individual stocks that excel and individual stocks that are not doing well and we're going to see some of those too. But the SPY here it is in the weekly chart. We switch it to the daily chart. Let's take a look at that daily chart and you'll see that we're again we're still inside that box but you know price has been dropping from the high of the box. It's dropped one and a half% which is not a big deal honestly. Um it's still above the cloud. It's under the 26th period. It's not a perfect scenario. All right. Okay. So, now that you understand the rules, guys, I'm going to go through these very quickly, and I'm just going to give you a quick little overview of each one. Let's start off with the QQQ ETF. And as you can see, price is currently above that 26 period, but it's under the nine. Okay, it's still in an overall uptrend. It's just not as strong as the oil. You look at the daily chart, we are inside the cloud. What that represents is neutrality. Okay, so we're still inside the cloud. The chica span is currently right around the bottom of that candle. I don't know if you can see that white line right there. And the cloud itself, notice how the QQQ is turning bearish future cloud. All right, that's where the single span A crosses under the single span B. Add to that the fact that we also have this directional movement index, this secondary uh indicator with the red line above the green line. That's the negative DI9 is above the positive DI9. The ADX9 is this white line that represents momentum. If that's moving up, that means that momentum is increasing. But when the red line is above the green line, we don't want that momentum to be increasing. Right now, it's starting to turn down, which is a good thing. Do you see that how the ADX is is actually dropping a little the white line, what that means is the momentum has ceased from the pullback, found support at the bottom of the cloud, and for these last three days, the QQQ's are starting to rebound a little bit, but they're just not quite out of, you know, out of the woods yet. So, we'll see what happens there. The Dow Jones DIA E ATF has also, you know, re started rebounding since October 1st. It's moved up 3.6%. Not a whole lot, but it's re-entered the cloud right now, which is good. That's always a good sign. It's went from basically being in negative territory under the cloud to inside the cloud and it needs to get in there before it can get above it. Sometimes price will actually gap right through. I've seen that happen many times as well. Um, that's the daily chart and here's the weekly chart. Still very bullish here on the weekly, okay, with price above the moving averages. The cloud is still bullish. Everything looks pretty good. The Russell 2000 looks a little bit weaker. Okay, we can see if I remove uh these lines just for a moment, you can see with just looking at the indicator, the HMO indicator, how the faster moving average crossed under the red line here on the weekly chart. And uh these last couple of days, we've been moving up. Now, I mentioned um not so long ago about this bullish harami. We got a red candle and then we had this little small bullish candle. I said there's a higher probability that price might continue moving up now. But we also have this resistance right above. So, you know, at least uh I can see that the ADX is starting to slow down, which is good that and talk about that pullback starting to slow down. At least we'll see if this can continue. If you look at the daily chart, you can see that little bit of a rebound happening these last couple weeks, right? and price breaking above not just the 26 period but above that 200 that dotted yellow line you see right there. All right, let's keep going. Um so yeah, there's the daily, there's the weekly on the Russell. How about the VIX? The VIX which represents volatility and some people call it the fear index. All right, has pulled back a little down 4.19% came down to 17.5. It's under that 200 again. Maybe we'll it'll continue pulling back, but right now at least it's stalled, which is good a good sign that we want that to be dropping. The Euro stocks, the FEZ, uh, as I mentioned uh, recently, we're, you know, is currently in a downward channel. Okay, very easy to see on a chart and the cloud actually helps you to identify it much easier, doesn't it? Because all you got to do is look to see where price is in relation to these moving averages. when price is under. Okay, the red line under the cloud. Bearish under the 200 bearish right? So, Euro stocks on the daily uh looking, you know, relatively weak here because they're still under that 9 period. Here's the weekly chart. At least, you know, we're we're stalling at the top of the cloud on the weekly chart. And that's why folks, it's important to keep an eye on that weekly chart. I think in my opinion, you know, you got to pay attention to that because that's going to give you the overall longer term picture of the health of the ETF or the stock. Here's gold on the weekly chart. Has been pulling back, but at least it's finding some support at the 36012, this prior low right here. Uh, and today was up 1.2%. Here's the daily chart. Still in a downward channel, so I wouldn't be adding positions in gold right now, obviously right? Silver pretty much uh similar situation downward channel has been dropping a bit under some support key levels monthly level of 4961. I mean that's that's a pretty long you know this this purple line you see here it literally goes back to 2025. I don't know if you can see that right there. I'm going to zoom zoom in a little bit so you can see it. You see this candle? So 49 um 25 was the high on that which is very close to the 4961 but basically uh that's from October 16th uh 2025 guys and why is that important because you can see here we were finding resistance here we got above that 496 one level okay continue moving up and right now as you can see we we retested it or came really close to it back here on in June of this year, June 24th. Um the other thing that you'll notice is how price kept on stalling in this area, right? That 4961 level, bounced off of it over here, moved up, keep going, and you'll see that there's another area right over here where it was also stalling. Okay. So, it's very interesting how price always send uh tends to like stall in specific spots where price found support in the past, but when it breaks under, that's kind of dangerous territory. Um, so yeah, right now, silver is something I'd stay out of for the time being. Bitcoin, here's the daily chart. We can see, let me zoom in a little bit so you can see the future cloud better. And let me get rid of those lines. Um, it's uh goes back to these little levels here. It's been broken so many times. I'm not sure that it really matters at this point. I'm going to get rid of Well, I guess it does. You can see the support level right there. Found resistance right there. Right now, we're under that 4668. We'll leave that there for now. Okay. Price is under these two moving averages currently on the daily chart. It's been pulled back a little bit. Here's a weekly chart. Still multiple weeks now. six weeks in a row where from the highs here uh from Friday, September 25th, it's actually dropped 7%. So, Bitcoin is not really taking off. It's inside the cloud, but I would hold off on that one. Ethereum is under the cloud on the weekly. So, that's bearish territory. Like I said, it's actually dropped since that little move that we had from June July where we bounced down at that 1464 level. We moved up quite a bit as you can see, but then we're now pulling back again. All right, so that's the weekly and here's a daily chart with Ethereum inside the cloud. That's neutral. All right, let's keep going and we'll start off with the two strongest. This is only two uh stocks here that actually got the blue flag this today. 30 out of 34. Gives you a little bit of perspective of what's happening in the markets right now, right? Um with the pullback that we've been experiencing. Apple up 0.93% today. Notice where price is. It's above the moving averages, above the cloud, daily chart and weekly chart. There's the weekly. So, we've got all that happening. That's beautiful. Get rid of some of these lines. Microsoft is uh also above the the moving averages here on the weekly and on the daily. All right. It was down 22%, but I like Microsoft as well. Uh the rest of these guys there's something off technically. So let's get into that. AM uh we got AMT which is American Tower Corporation. It's a REIT. It's pulled back for 3 days now down 2.36%. Overall the trend is okay on the daily chart. On the weekly chart though it's neutral under that 200. Amazon on the weekly is under the moving averages but above the cloud. So that's also a weak uptrend right now. If you look at the daily chart, we're under the cloud. No. Broadcom is under the cloud on the daily chart and it's been under for a while. So stay out of that one for now. Uh crowd strike CRWD ticker symbol above the cloud. However, we had a um faster moving average crossing under the red on the daily. We're still we're back above them. That's good. But uh it's not as strong. Okay. And if you look at the weekly chart, we are in a very strong uptrend. So CrowdStrike has done quite well. Um and one of the ETFs that we're going to cover CIBR in a few moments which is rel in related to CRWD uh we're going to look at is also doing pretty well. CRWV coreweave um on the weekly chart you can see here had this big pullback right on the daily chart we're basically under that cloud. We moved up 7.9%. There's no buy signal here guys. We're still under these very important resistance levels. DAL Delta Airlines is also hitting its head right at the bottom of the cloud. I'd hold off on that one, too. Here's the weekly chart. Slightly more positive with price above the cloud, but we have a negative crossover. GLW is inside the cloud on the weekly and on the daily it's under. So, no, Google is under the cloud in the daily chart. This is not a buy point for me. Now, it's come close to a support level. You can see the lows right here from that candle. [clears throat] Let's go ahead and throw that in there so you can see it. So, the low is 31490. Let me go ahead and fix that so we can have the exact level. Boom. Just like that. Okay. Notice where we're coming right to that level. And at least it it kind of, you know, stalled here. It doesn't mean it's going to definitely going to go up from here. Does not mean that. Here's a weekly chart. We've entered the cloud. So you can see this even more clearly right here. So Google is not something I would be adding at this point. Their next earnings announcement is coming out tomorrow, guys. October 28th. And that's going to be huge. Any whenever a stock comes out with earnings, okay? It's it can jump. It can jump 10, 15, 20%. So just be careful um with it. It could be positive, it could be negative. So we'll see when the earnings announcement comes out. IGV uh which is iShares S&P GSTI software index fund ETF is fine on the weekly chart moving up positive cloud everything looks good here in the weekly but looking at the daily chart we have that faster moving average onto this lower one but overall it's pretty good okay uh INTC is under the cloud but found some support at that 200 um back here on Friday and Thursday last week which is good bounced off of it. That's a daily chart. Here's a weekly chart. Still under the moving averages. Coca-Cola is looking great on the weekly. No problems on the weekly. On the daily chart, it's pulled back a couple of days. Over overall, it's a still a very strong uh stock. LRCX is under the cloud. I'd stay out of LAM Research for now. The MAGS ETF has pulled back, but found basically bouncing kind of close to the cloud here. And uh but I would hold off on that one, too. There's the daily chart. There's the weekly. The weekly looks really strong still. Uh you got MTUM, which is the momentum factor ETF. Here it is on the weekly, you know, inside this kind of symmetrical trend type scenario situation. Let's see. Yeah, I mean it's under the moving averages right now and just slightly above the cloud. I'd hold off on this one. NE showing some strength. Um, basically with price above the 9 period for a couple of days on the on the weekly, I'm sorry, for a couple of weeks on the weekly chart. On the daily chart, no, we get the faster moving average under the slower and the cloud looks like it's about to turn bearish. So, just be really careful. This is also a reversal candle right here. Let's look at Nvidia. It's inside the cloud on the daily, which means it's neutral. On the weekly chart, it is a weak uptrend. It's just been moving sideways. Octa, um, Inc. Class A stocks. Now, this one here, I actually had a couple positions in this, but right now on the weekly chart, it's very bullish. You can see how price is continuing to move up. On the daily chart, it was, you know, today was up 2.75%. Um, it had pulled back. It moved back above the moving averages, but we still have the faster moving average under. So, I does not get a blue flag for that reason. Oracle's under the cloud on the weekly, but it had a little jump today, 3.55%. Nothing major in my opinion. It's still in a embedded decline. PW, which is Palo Alto Networks, um it's a weak uptrend because the cloud is turning bearish, but price at least is above both of the moving averages on the daily on the weekly chart is pretty bullish. So, the daily chart needs a little bit of work basically. Um PWR is under the cloud and uh just only three days here where it's moved up. I'd hold off on that one. RSP the best S&P 500 equal weight looks pretty good on the daily because it broke through the cloud today which is a nice it's always a good signal when we see price breaking above. The problem is the cloud hasn't uh exactly c caught up yet. And the reason it hasn't is because we can see that we're still in a we have a lower low from the prior low. And the cloud is very good at basically showing us also the potential weakness right still that we might experience. Um and it has been stalling here for four days in a row. That's the daily chart. Here's a weekly chart. Weekly chart looks much better obviously right? Uh let's look at SMH, which is a semiconductor ETF today up 3.02%. 02%. This is the weekly chart. Just stalling and moving sideways here on the weekly. Here's a daily chart under the cloud, but it's been moving up three days. So, I had to hold off on that one, too. Let's see. Um, SMDK Sandis Corporation is stalling here at the 200 day, which is good. It's pausing and maybe bouncing potentially, but it's still under that 9 period. I'd stay out of that one, folks. Stay out of that one. We got a lower low here. We got a lower high here from the prior one. Here's a weekly chart. It's not looking um particularly great, but the you know price is above the cloud on the weekly. That's important. The trend is not you know over yet necessarily because we although we do have a lower high from the prior one. We do not have a lower low yet. Okay. We still have a little room to move and we've got this cloud here just waiting for support. SNPS is inside the cloud. So no on the weekly on the daily chart looks a little better but uh faster moving averages are slow. No. SPCX Space Exploration Technologies is under these moving averages right now but finding support at the top of the cloud. There's not enough data for the weekly chart yet because uh you know they went public back here in the week ending June 12th. Teer [clears throat] Pterodine Inc. moving sideways in a box basically. Okay. So again, this is a consolidation stage and it's just trying to figure out where it's going to go from here. Here's a daily chart under the cloud. UNH inside the cloud on the daily future cloud turning bullish. That's good. Um but we're inside the cloud. And if you look at the um sorry, if you look at the weekly chart, it's also looking better in that we are still above the cloud for three weeks now, but we're see that 200. waiting right there. I'd hold off on United Health. WDC has been pulling back for multiple weeks. These are weekly candles that you're looking at here with Western Digital Corporation. Cloud is still holding on for a little bit. Suspend B, but the green line is under the red line and it's been pulling back. Here's the daily. You see that decline even more clearly. So whenever you see on the weekly chart multiple weeks where price has been declining right you can see it even more clearly of course when you switch it to a daily chart and it's in a downward channel right now. Um let's look at XLI which is also declining. So if we look at the weekly chart we know it's been dropping but at least it's finding some support at the top of the cloud. XLK, which is the technology sector um ETF. Here you can see prices inside in between the two moving averages and the weekly. So there's it's kind of nothing much happening there. And then daily chart, we've got a a future bearish cloud, but price above the cloud. So it's it's very mixed. Basically, a lot of um indecision. Okay, let's look at XLY, which is consumer discretionary. Has been showing some strength since the lows back here in October, October 1st. It's moved up 6.72%, but and it got above the cloud, but that 200 is right there. It's been hitting its head. It might break through it tomorrow potentially if we have one bullish, one more bullish day. It's going to break right through that 200. Here's a weekly chart. Bearish cloud still. So, we don't have confirmation on the on the weekly chart. ZS on the weekly chart finding resistance right at that close to that 25961. I mean it closed above it slightly at 2615. But you can see the type of candle that formed when it got to that level. That level is based on this low here from September 5th of 2025, guys. It's a long time ago. So we're hitting that level again. And here's a daily chart. see the type of candle that formed that long longer wick at the top. That's a reversal candle. Um it was bullish nonetheless, but it was, you know, kind of hold off on ZS. Now, let's take a look at our members requests. STRL, we'll start off with the weekly chart here on this one. This one is currently inside the cloud on the weekly. We are building a bullish harami pattern. A bullish harami pattern is when you see a large red candle followed by a small bullish one which remains within the body of the prior candle. Okay? So, and I can show you guys that on our cheat sheet real quick on my X page. So, x.com/bluecloud trader if you want to check out that X page. Got a thousand over a thousand followers right now. Kindle pattern reference sheet. Let's click on that. It's at the very top. You can download this too. Um for your reference. Okay. So, let's look at that bullish harami. So, what we do is we go to the bullish column. It's a double candle pattern. This is what it looks like. It's important to try to memorize these. Large red candle followed by a small bullish candle. You see this after a pullback very very bullish. Okay, so let's go back. It's been pulling back as you can see and it's starting to develop. Now, the weekly chart, this candle has not formed completely yet, but it's in the process of forming. The fact that it was up 1.88% is a good sign. Here's a daily chart. You can see the little bounce that's happening here. But the problem is I would not be adding uh I would obviously not be adding this to my portfolio because it's currently under the cloud, under the 200. And right now it's it would if I had a position in this I would say oh just uh maybe give it a wait and see approach here you know um because it is at least bouncing from Friday's price the low there of 34574 it's moving up slightly. You can even switch it to a two-hour time frame. You can see that happening right there. Switch it to a 30 minute and you can see that it's been moving up slightly since the 23rd. We had a um this is an interesting pattern right here too. They call these tweezer bottoms because they look like see that little wick right there and that little wick right there and they're about the same length and it's also a bullish harami right there as well on this 30 minute chart. That's what led to the the move that you're seeing right there. Um so yeah that's that's um interesting that that's happened. Okay, let's look at CIBR and let's start off with a weekly chart on this one. This is the first trust NASDAQ CA cyber security ETF. So if I switch it to the click on the component watch list here, we can see some of the stocks in here and there's CrowdStrike, one of the stocks within CIBR and there's a bunch of other ones, 38 to be exact. Um, even Google's in there, which is interesting. Okay, Data Dog is in there. So CIBR on the weekly chart has been moving up nicely. It's moved since it broke the cloud back here on May 15th. Was it May 15th? May 8th, sorry. It's moved up 44.94%. It's a nice move on the weekly chart. You can see very clearly. And uh for the most part, it's held nicely also pretty close to that 9 period. See, we didn't have any major breakdowns. We did have a a large candle that closed here, but we never saw any follow through the next week because price basically stalled, right? So, we can see if I if I create a little line right there, you can see how price did not break that low. And that was critical. And now price is starting to move up. Here's a daily chart. So, we can see from these lows here, it's moved up 11 12%. It's still moving. And well, it it might find some resistance at the high here of 11068. We're at 10965. So, just giving a heads up about that. But it could also just slice right through there. There's a lot of demand right now for cyber security products and because of the issues that have been u occurring you know with um websites and all kinds of you know shenanigans and uh so CIBR is definitely an ETF that is I would consider. Uh guys that's going to do it for this video. Thanks for watching. If you guys want to support the channel further, one of the things that you can do is like and subscribe, of course, and also make sure to hit that notification bell. So, subscribe, hit that notification bell. There's also the join button if you want to get access to the member only videos that I produce. You can see them right here. Uh I do one each weekend and I go over the entire portfolio and I also share stock ideas. Uh this week I had over 30 stock ideas and over 10 ETFs. uh and they've been placed in a watch list and I share those and I go over the charts. So, click that join button. If you do click that join button, what happens is you'll get three options. BlueCloud supporter under this level, you'll be able to request a stock or ETF to be analyzed on an upcoming video like the ones I just did. UCloud trader, okay, BlueCloud trader level. That's where you get access to the exclusive member only videos. Okay? And if you want to go one step further, BlueCloud Legend level membership, you'll get access to those exclusive member only videos. You can request stocks or ETFs be analyzed, three of them per month. Um, there's some daily day trading videos there. And you'll also get access to the daily stock and ETF trade update that I do every day. I basically post my trades uh that I've placed before the market closes and you'll find them under posts. So consider doing that and check out the links, too. I've got some links here. Lots of links. So many links. There's so many links, folks. There's a lot of links. Oh my god, I'm getting crazy over here with the links. But you should check them out. You might like some of those links. Okay, and that's all, guys. Have a good night. I'll catch you all in the next video. [music] The ichimoku [music and singing] guiding light. Blue cloud [music and singing] traing through the night. >> [music] >> would

Comentários 0
Entre para participar da discussão.
EntrarAinda não há comentários. Seja o primeiro a compartilhar sua opinião!