…Apple and Micros The other two aregoing t% over that time fme. But aping some major support right around that k two 12.5, 215 area. So I kind of like it going forward here.rninf November. So I'm not going to get kind of in the way of that. I'm going to structure a trade just short of that. Take advantage of the fact that Ivy has popped here. Nvidia o downdraft. So kind of like where the s's at really like where the Ivy is at and stay away from earnings. So just going to November selling the 205 200 put spread g about a buck here. So still plenty of downside cushion about 5% and get out of the way. Earnings.ake advantage of an Nvidia that has come back down and should I think find so support somewhere around here. Certainly I think their business willtinue to, you k…
I'm going to structure a trade just short of that. Take advantage of the fact that Ivy has popped here. Nvidia o downdraft. So kind of like where the s's at really like where the Ivy is at and stay away from earnings. So just going to November selling the 205 200 put spread g about a buck here.
Contexto extraído por IA
Yeah Nvidia since bas last earnings Marley has been the wst performer of these big three names Apple and Micros The other two aregoing t% over that time fme. But aping some major support right around that k two 12.5, 215 area. So I kind of like it going forward here.rninf November. So I'm not going to get kind of in the way of that. I'm going to structure a trade just short of that. Take advantage of the fact that Ivy has popped here. Nvidia o downdraft. So kind of like where the s's at really like where the Ivy is at and stay away from earnings. So just going to November selling the 205 200 put spread g about a buck here. So still plenty of downside cushion about 5% and get out of the way. Earnings.ake advantage of an Nvidia that has come back down and should I think find so support somewhere around here.
…has been by far the star performer over the past several months. Up over 12% in that time frame, but running intoome major overhead resistance right at that 350 level has tried to br through there with conviction more than a few ti Failed. Each time I'm just hanging my hat at that level a little more aggressive on this trade, selling a bearish call spread. I like the fact that the stock's having trouble. Their earnings are the first week inovember. So same short of earnings. Selling October 30th 35355. Call sprea Getting over a buck for that. So like that return on risk have some upside cushion on the trade as well. And I think Apple w probably unless we see the market run into something s beneficial for Apple. Right. I don't see Apple benefiting from ki the flight to safety if…
Each time I'm just hanging my hat at that level a little more aggressive on this trade, selling a bearish call spread. I like the fact that the stock's having trouble. Their earnings are the first week inovember. So same short of earnings. Selling October 30th 35355. Call sprea Getting over a buck for that.
Contexto extraído por IA
Yeah looking at Apple. Which the big three if you will has been by far the star performer over the past several months. Up over 12% in that time frame, but running intoome major overhead resistance right at that 350 level has tried to br through there with conviction more than a few ti Failed. Each time I'm just hanging my hat at that level a little more aggressive on this trade, selling a bearish call spread. I like the fact that the stock's having trouble. Their earnings are the first week inovember. So same short of earnings. Selling October 30th 35355. Call sprea Getting over a buck for that. So like that return on risk have some upside cushion on the trade as well.
Transcrição Completa
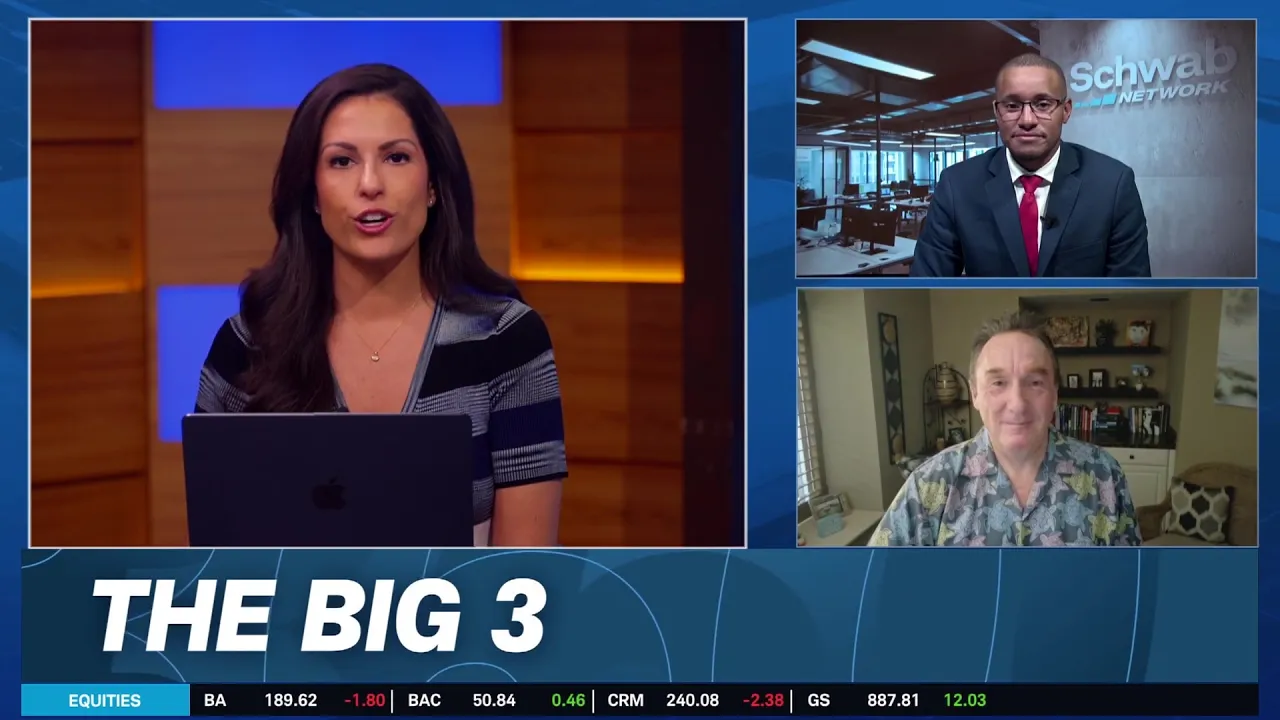
difference when you have someone that actually cares. Welcome back to trading 360. I'm Marley Kayden. It's time fo the big three. We've got three stocks three charts and three trade for you. Kevin Green will take us through the charts today here to take us through the trades. Tim Bigham options strategist. Great to have you both with us Tim. We got quite a few earnings this morning. We're seeing a nice move to the upside although the Nasdaq did just turno the red here. But the Dow posting some really nice gains along with small caps todow are you looking at the action we're getting right now. Yeah I thinke this. Marley. Me of a sideways slog with the kind of haves and have nots. I think you'll see individual stocks maybe with still decent, but certainly the indices probably mired in a sideways sort of consolidation here near all time highs, albeit now fairly far off it. So unless we have a absolute strin of earnings beats, especially from the top market cap names, I think it'll be tough going for the indices at least until we get some clarity on oil. As you talked about in the last segment, leading everything here and the long end of the cu think needs to come down some more. The ten year below 5% woulda big benefit stoe done something today that I don't know that anyone er done on the big three. You brought us the literal big three today. You have thee biggest companies by market cap. e Behemoth and Nvidia as your first trade today. What are you seeing in Nvidia right now. Yeah Nvidia since bas last earnings Marley has been the wst performer of these big three names Apple and Micros The other two aregoing t% over that time fme. But aping some major support right around that k two 12.5, 215 area. So I kind of like it going forward here.rninf November. So I'm not going to get kind of in the way of that. I'm going to structure a trade just short of that. Take advantage of the fact that Ivy has popped here. Nvidia o downdraft. So kind of like where the s's at really like where the Ivy is at and stay away from earnings. So just going to November selling the 205 200 put spread g about a buck here. So still plenty of downside cushion about 5% and get out of the way. Earnings.ake advantage of an Nvidia that has come back down and should I think find so support somewhere around here. Certainly I think their business willtinue to, you know, be the best of the best. But the stock price well off the highs. But I think we'll find some s here over the coming weeks. Yeah. I mean we're certainly well off the highs andome of the more parabolic moves we saw from this name last yt's been a bit more sideways for Nvidia KG. As we look at the chart here. And Tim highlighting that this is the worst performer of the three that we have today. What are you seeing in the technical setup. Andoting again that we're also a ways away from the earning Nvidia reports at the end of the season. Well, Marley, you kind of just did my job. I mean, the stock has been trading sideways or in a range and it tries to break out. But we are kind of back within that range that we've seen for the most part for the better part of this year. You look at this time last year, we did see the stock kind of pull back below the 20 day, 50 day moving average, and itlidated with the area of support sitting at around 170 in an 195 before we did see aroun breakout and we started making those highs of around $236, rtun, leveraged the 200 day moving average is a ka of support. And then we started making higher lows. And then we did have a fai breakout. Technically, we got to that 243 level, and now we have pulled back below the 2 below the 50 day moving average. Now, there is a reason to say that maybe we are closer to an area of support. That 210 level has been an areathe last two , three months, where buyers have actually stepped into this name. Maybe that's going to be the case today. And over the last four days, we've kind of been trading between 211 and say 220 or so. And we are trying to consolidate now. The did break the higher low succession. mindful of. MacD is in ae bearish formation still above the zer. But the 12 E below the 26 EMA here you got to pretty much hold this level. If not you're looking at the 200 day moving average. If we go to the weekly chart, you could also then make the case that the 20 week moving average is acting as an area of support. But the problem that you kind of have with this pattern, with higher highs, higher lows, is that you are starting to see a little bit of a rollover in RSI, as well as the MacD, which did actually cross in little bit of a beaormation. So moving average has to hold on the 20 week moving average. But if we do kind of get an acceleration once again go back to200 day, which is approximately close to where we average at around $200. All right. now we've got Nvidia just trading marginally higher, about a 10t a percent on the session at two 1730. Let's move to A here. Apple has been very interesting one. We're we're pretty near to all time highs. It's sort of emerged as this anti AI trade in some ways. I keep hearing that when it comes to Apple. So Tim howou looking at Apple right now. Yeah looking at Apple. Which the big three if you will has been by far the star performer over the past several months. Up over 12% in that time frame, but running intoome major overhead resistance right at that 350 level has tried to br through there with conviction more than a few ti Failed. Each time I'm just hanging my hat at that level a little more aggressive on this trade, selling a bearish call spread. I like the fact that the stock's having trouble. Their earnings are the first week inovember. So same short of earnings. Selling October 30th 35355. Call sprea Getting over a buck for that. So like that return on risk have some upside cushion on the trade as well. And I think Apple w probably unless we see the market run into something s beneficial for Apple. Right. I don't see Apple benefiting from ki the flight to safety if you will the anti A trade simply because I think all stocks will come down. And I think the outperformance of Apple is a reason to maybe be brish on it. I'm a mean reversion sort of guy. So I think Apple will come to the names like Microsoft and Nvidia going forward. All right. You've got an October 30th expiration on that trade which excludes its earn event which doesn't come our way until November 2nd. Bu KG when you look atpple and some of the moves that we've seen recently, specifical some of its new product launches, what are you seeing in the chart? Well, this y well on the daily. I mean, the stock been able to pull back to key areas of support before moving higher. And right now, over the last 6 or 7 months, we've been actually making higher highs, higher lows. We saw this pullback at the end of December last year and going into the beginning of this year, thaed back to the 200 day moving average. And then we started sg buyers really step in. And that's when the kind of that AI trade started to hit this company. And we have been able to leverage over the last month day moving average is a key 20 area of support, as well as that 50 day moving average. And you can call this, let's say, a rising wedge pattern, but we are basically at the apr the next two weeks or so, where you axpecting it to break out or break down. If we do break down, that means that e lod leng the 50 day moving average as an area of support, $325. And if we break below that, you're looking at the 200 day moving average. But onceagad to break out. And if we do get a breakout, you'reoking f around $40 from these current levels. So 380 could be your next major area of resistance. Price momentum is actually waning here. RSI is making lower highs. And MacD is kind of crossing in a bearish formation on the daily. So this is a stock that has actually had a pretty d run. But it's kin at a make or break level at least for now. On the weekly chart you get a little bit more optimistic higher highs, higher lows on the RSI we RSI, lower highs on the RSI as well. So we are losing price momentum. And we're kind of ab this key breakoutoint. So if we do get a pullback to the downside once ag looking at around $330 here. But this is actually a pretty constructive chart over the long term. Even though in the near term on the daily we are once kind of at that make or break over the next two weeks. We'll see how this all pans out. All right. And if we get Apple up near that 380 mark that you highlighted, that would be a certainly an all time high, new all time high for the company. Right now it's holding at 34815, which we just hit last week. Looking atle your last one here is Microsoft not the worst performer in the mag seven but cer not the best. Tim how would you like to trade Microsoft for example purposes. Yeah absolutely. And kind of, you know, taking that approach to Microsoft earnings here are the end of October. So I'm going out to tditional November kind of getting away from earnings that way. The other two trade absolutely expire before earnings. Avoid the event risk here be to short term I think to really get too far out of the way. So I think Micros which as you said, Marley has been kind of the you know, middle of the pack here is up slightly over the past couple oonths, but not nearly tle's degree and certainly not down like Nvidia. So I'm doing a iron condor selling a call spread and put spread both plenty of cushion to the upside anddownsit implied volatility is rather high comparatively on all these names over the past several weeks. So selling the November 5th, 8585 call spread and at the same time t 48475 put and a half on that trad buck like that return on risk, like the fact we hlenty of cushion, like the fact that Microsoft has really absolutely just traded sideways here. I think even post earnings, as we've seen on a lot of these AI names, unless they knock it out park or miss badly, you'll probably see a fairly nonet least short term on the trade. So I'm taking advantage of what I think will continue to be a go nowhere stock on Microsoft, avo earnings by getting far past them instead of staying short of them. We've got a nice a nice wide range of profitability there too, and we will be close to a month removed from that earnings event. So KG when you look at the technicals here, did any of those levels highlighted in the trade stand out for you. They do. know it's kind of a bold call to say this is kind of a maybe a nonevhis stock is actually kind of basing out over the lt year or so. And we are the neckline of that breakout. So I would saywe probably will see some fireworks when it comes to Microsoft's earnings. Now we could see the obviously made lowhs and lower lows. And we had this double bottom formation. The first bottom that we had was back in early April. We came back retested that 350 level back in June. And then we have been making higher highs ever since. A very strong move to thpside up over 57%. But you Tim's right. We are kind of consolidating. We did have this channel line that actually did kind of last for about a month and a half, two months or so before breaking out testing around that 550 level. We are consolidating right now, but we're still trading above the 20 day 50 day, as well as the 200 day moving average. And we are once again leading up to a major event where we could see a break the upside. If we do get some decent news. Now, if we get a break down, you really talking about losing the 20 and even the 50 day moving average, and you're kind of looking at that first area, major support around that $495vy consolidate and potly move a little bit higher here, but MacD and a little bit more of a bearish formation. 12 EMA below the 26 EMA. But Marley here's where you get reallyexcio Microsoft. So maybe not over the next couple of weeks. But if youoking at the weekly chart, once again we had this pullback. We had the double bottom. That double bottom also coincided with the 200 week moving average, a major moving aver on a longer term time frame chart. The stock still making higher highs higher lows on the RSI, which means momentum is still good over the long term. MacD is also a bullish formation meaning momentum is really goo the long term. And w are coming in testing that neckline. This is the third time that we are this since July of last year. seems like this wants to try to break out and move to the ups rather than break down. If we do see a breakdown. Once again, you're looking at the 495 even to the 463 level, which that 20 week moving average is a keyares is a nice base as well as a technical structure of that double bottom pattern. You don't get many of these on a weekly chart. All right. So as we look at Microsoft it is actually trading lower today bucking the trend of the broader market. Righte're down a half a percent at 53107. Of course, that earnings event is on 28th of October, but it gives us close to a month before this trade expires.ally h being with us. Tim Bigham joining us today

Comentários 0
Entre para participar da discussão.
EntrarAinda não há comentários. Seja o primeiro a compartilhar sua opinião!