
- Retorno do vídeo
- —
- Chamadas
- 1
- Compra / Venda
- 1 0
- Publicado
Recomendações
Entrada é o preço de fechamento do ativo na data de publicação. Atual é o último fechamento registrado.
-
Entrada $333,69 02 out 2026Atual $333,69 02 out 2026Resultado +$0,00vs. índice +0,0% SPY +0,0% no mesmo período
Citar esta recomendação Ver trecho original (659s) *
Contexto da transcrição original
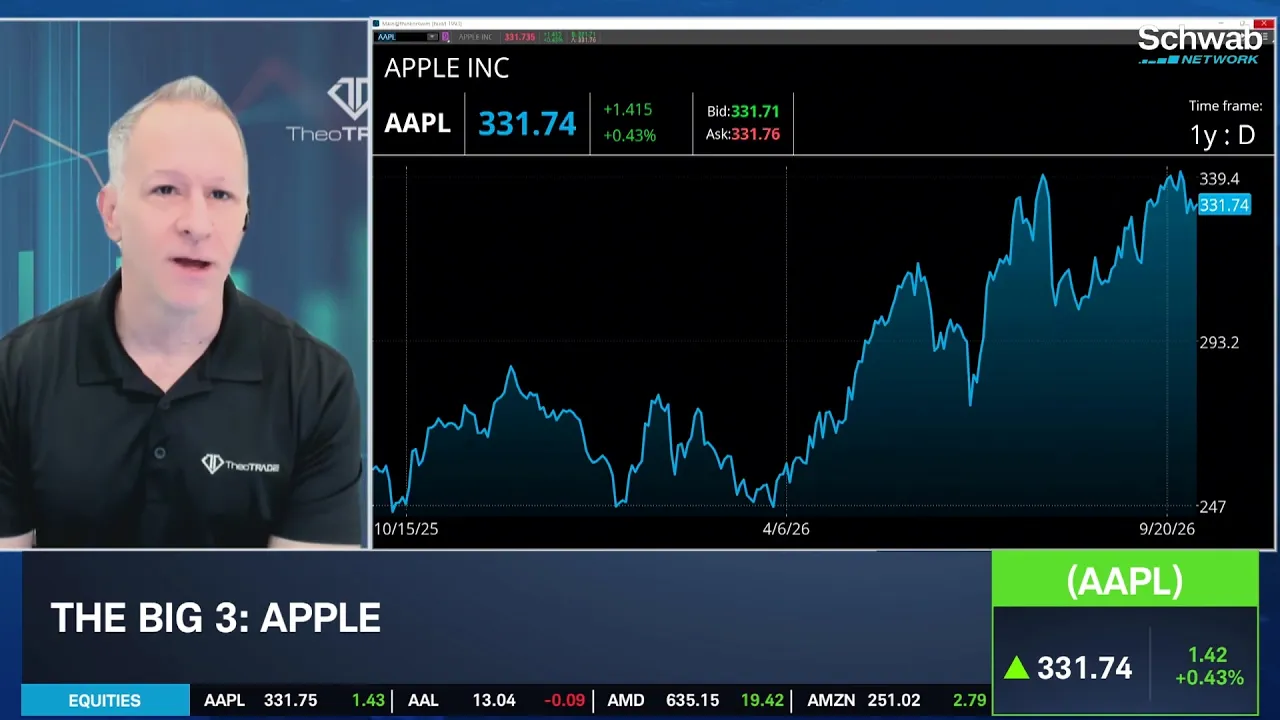
…all a gamma squeeze. Nowhat trade to occur. Yeah. We got to creep up actually going to take a fairly short term horizon because as I said just a few minutes ago, I'm a little bit bearish on tech, not so much in Apple in the very near term. I think Apple actually pops, if you will, to the all time high, which is exactly what this trade is set up for. This is the Oct 23 expiration. It's going fairly shortion before the next earnings cycle. Right. Oct 23. Ing to buy the 345 calls. Buy the 345 calls, sell th 350 calls against them. This trade is done for a dollar debit outf the money spread. Looking the pop to the upside. Apple into new highs based on a gamma squeeze. All right Rick so as we look at Apple here are you also seein possibility that we could add some more fuel to this rally. Yes. But t oi do not even belong in the same sentence. I feel like I just have to kind of say that. But we can see45 …
I think Apple actually pops, if you will, to the all time high, which is exactly what this trade is set up for. This is the Oct 23 expiration. It's going fairly shortion before the next earnings cycle. Right. Oct 23. Ing to buy the 345 calls. Buy the 345 calls, sell th 350 calls against them. This trade is done for a dollar debit outf the money spread. Looking the pop to the upside. Apple into new highs based on a gamma squeeze.
Transcrição Completa
difference when you have someone that actually cares. Welcome back to trading 360. Marley Kayden, it's time the bt three stocks, three charts and three trade for you. Rick Duquette will take us through those charts here to take us through the trades today. Don Kaufman the co-founder of Theo Trade. Don great to have you with us. And on a nice up day so far to kick off this Friday. How are you looking at the action we're seeing this morning? Well, first of all, you're up. Day ispping quite rapidly as I'm watching the S&P out of the corner of my eye over hnd it's predominantlause of the bond market. Once again the bonds they need to take stage like every just you know, look hey it's all going to be just until the bonds ac start to break. And those bonds right now, they are the marketplace. You know the biggest thing though I would say overall about the S&P 500, there is an incredible asymmetry risk reward. That is there'sutely some upside potential. But I think it's very med very small upside potential versus what could actually be some some mass downside risk. And largely in part because of that bond market. All right. So let's dive here to the big three. You've got target as your first pick here. I am a regular at what I call the black hole as it's just up the street here from Schwab Network. But how are you looking at target dot? Yeah. You know what very well. So this one'set ver actually going to be a bearish trade. And look we could discuss thert which Rick will do in in just a moment. Extensively. The chart rolled rm down to the 155. But I'm going to tell you look my bearish target trade i more. Take a look at Costco. Take a look at Walmart. T look at just ret in general. They're getting hit everywhere. Ihink at this point it's only my they come. That is the s start coming for for target. And that's enough for me to want to purchase an out of the money spread. Now these out of the money spreads. These are lower probability shots. But if the marketplace starts totate o has in Walmart, like it has in most of the big box retailers, like it has in most retail in general, then this could be a profitable trade. So in target I'm going to go all the way out to the 18 option expiration. I'm using that to give myself what 77 days. A little bit of time. I'm going to buy the 145 puts. I'm going to sell t 135 puts again It's a full $10 widespread done for a $2.60 debit. All right Rick. So as we look atechnicals here fortargetr to date. But loo for a small pullback here. What are you seeing in the technicals. And what levels stand out to you. Well 145 caught my eye. The reason why is that was a gap level and a subsequent low. So that's this green line right here be the upper strike for that trade that Don was discussing here. In the meantime though we've been in a very rather tight range recently. So we had an old low point here at around 160. And then that became the ceiling. Then the floor of the rangeas around 155 or so. The broader picture is we've had an upwar sloping white trend line here, a shorter term downward sloping trend line as well in the recent days. So a sideways is what traders have been seeing in target shares recentl here. So we also have a confluence of our two moving averages ourive day and our 21 day exponential movingrage is between 156 and 157 or so. So I do notice, though, that the trend does seem to be slipping a little bit here. Our fasve day is below its slower 21 day counterpart. Here e our and gold representing one quarter. 15149 is where that one comes in. If we do start to break below our trend line, that could be another point to watch RSI also exhibiting some more bearish behavior. We are below the 50 mid-line. We have a downward sloping trendine in play. We are on pace to make new relative low so perhaps the signs are pointing more toward a breakdown based on these indicators. So far, our volume profile study s that we have a node here 153 t Once we do start to get below that, if w I should say there's a couple very small pockets of activity here around 140 and 148 or so, but nothing really to scant until down here near 130. All right. And today we are looking target down about 7/10 of a percent here. But I wan move to y next one, Don. You've got the utility sector ETF from State Streetere as your second pick. So how are you looking at ues. Yeah this is actually going to be a bullish trade. But it's bullish fo the right bearish reasons if you will. And that happens to be in large part okay. I am looking for some tech sell side activity coming to a theater near you in the a month. Look tech starts tol sell off at all and it has had an amazing. I believe that we're going to see a rotation if products actually may see rotations back in including, you know, things like Xlp, which is some of the consumeraps we're about to s the chart, in a moment when Rick digs into this, it is ugly. It is it is ugly.ut this is the kind of thing I want to gut okay, re it y make that move. So I can do that though using a defined risk option spread. And that's exactly what I intend to do. So yes, this is going to be a bullish trade, but it's b in Excel you because I'm looking at a bearish tech move you know possibly in th next few weeks. So in Xlu I'm going to go out to the D 18 op Expiration again D 18 options expiration. Giv myself once again the g of time. Why. Because I'm purchasing an out of the money spre In this case I'm going to buy the 41 calls. Buying the 41 c selling the 45 calls against it. It's a nice $4 wide call spread done for about an 80 cent debit. So if you have a spread like this, tan out of the money spread, you're paying $0.80 for it. Ait is a lower proty trade. But case in point over here I'm ta shot and taking a shot that the rotation happens. And we we start to rip agaide of the utilities have just been pummeled in the in the year toate, especially from some of the recent highs. Yeah. I mean, even just looking over the last six months, I mean, we're down aboutere. I should have knon, when I saw two bullish trades come through to you. had to be a b angle to at least one bullishties here for theh tec State Street Select Utilities ETF. And as you can see whatn jI mean utilities have been under a great de of pressure. Sure. yy depends on your time horizon too as well. I mean you couldstn the long term and a bullish view in the short term. You know, all kinds of different setups you can do. But is a level that I was interested in as well. Here we had kind of a repeated low here. A then this is where things really started to break down. Meanwhile, 45, we had a couple of lows here and then a subsequent high roughlyd that area. So t that's kind of the the general area. This would be targeting some other horizontal levels to watch. 39 is where we had our recent lows. We also had our significant lownt here. We ed out there again and then continued our bre. We also had a double top type of high here at 4371. To give a bit more of a granular level there, five day EMA and dark blue representing one week comes in at 3974. Price has crossed above that one. The next one to watch out for are 21 day EMA in teal, representing one month at 4081 RSI improving somewhat. Here we were in the oversold area. You can see that threshold of 30.Wer making new highs. Downward trend is still in play though and we are still below the 50 mid line, so the Bulls would want to see continued highs matching up with price. And for. Still quite a bit of work to do toack above the 50 mid as well. Our volume profile here shows that we've ha notable pocket of trading volume down here at 39 to 40. So this is kind of an interesting thing to consider here. Notice as well. We've seen a lot of very heavy volume spikes here recently. This is suggesting that p an important low point has been reached. It certain doesn't mean it's going to hold or that it won't go lower. But heavy volume at a at a notable low where we've kind of consistently held this supportive level near 39. It's ing many traders might take note of. We can also see if we were to keep climbing little bit higher, 40 to 50 or so to 43. 50 is where our next volume node comes into the upside. All right. As we look at it today, is moving slightly higher. Today we are up about a half a percent here for Xlu at 39.88. But Don, I'm curious about your last one here. We've got Apple. We've had a lot of optimism about their moves they're mak in, terms of AI. They're higher on the sessi here. Year to date. They're up 21%. How would you approach Apple for trading right now. know Apple happens to be just we can get into the fundas a little bit. It's a cash cow. I don't think I'm too impressed with some of the new products out. I mean nothing that comes close to like a ChatGPT or a cloud. Right. So at that point I think Apple is much more, if you will, its safety in tech. It's the Walmart now of technology. I'm sure Apple would be disgusted to hear that. But it's become the Wal you know of technology. That's really what it is. And to that effect I'm looking at kind of an unusual trade. This one's it's it'sch mg if you will, of all time highs. think that if Apple creeps up just a little bit her,s y squeeze higher retai trade right now. Loves, loves to trade into highs. Okay. We've seen it again and again in many of the tech s especially recently. And what I'm talking about is a gamma squeeze. And that is ultimately if Apple star creeping up it gets to the the 338. If it gets to 340,g in and they're going to buy calls. Now as retail starts to buy calls, it's actually ca market making firms to sell them the calls and turn are then buying stock, which actually forces us into a feedback loop. Before you k it, the stock could be $510 high Okay. And that's again, it's what we call a gamma squeeze. Nowhat trade to occur. Yeah. We got to creep up actually going to take a fairly short term horizon because as I said just a few minutes ago, I'm a little bit bearish on tech, not so much in Apple in the very near term. I think Apple actually pops, if you will, to the all time high, which is exactly what this trade is set up for. This is the Oct 23 expiration. It's going fairly shortion before the next earnings cycle. Right. Oct 23. Ing to buy the 345 calls. Buy the 345 calls, sell th 350 calls against them. This trade is done for a dollar debit outf the money spread. Looking the pop to the upside. Apple into new highs based on a gamma squeeze. All right Rick so as we look at Apple here are you also seein possibility that we could add some more fuel to this rally. Yes. But t oi do not even belong in the same sentence. I feel like I just have to kind of say that. But we can see45 old highs. Here is where Don seems to be discussing this this area in question. We can see though that our upward channel type shape is still in play. We have a downward trend that has been established recently, but it to be holding on to this supportive area. That is our trend line. So a notable horizontal level, an old low here near 330 would then became a high point and then became su We did make intraday lows beyond that point, but our clothes happened right around that level. Tsing prices are typically more important than the intraday fluctuations. Same deal up here around the low three 40s is wher we had our bestloses. Despite the intraday pushes up to above So those are some of the relevant areas in the near term th traders could have their eye on for that that gamma squeeze breakout type of activity. So RSI we did have compression into this triangular shape here kind of just bouncing around slightly above the 50 mid-line here. Not really a clear short term directionight at this time here. We do see as well that the moving averages that are closest to our current activity, our five da and our 21 day prices roughly between them right between 330 to 333 or so. So look for that to, to resolve itself. If price does make a significant push above either of those boundaries. finally, our volume profile study shows that here 328 to 336 ishe closest concentration of trading volume. And then 308 to 314 is a more significant level as well. So if we do start to pull back, we can see that ould be a supportive area. It lines up with these old highs. You can ofee that these volume profile nodes will line up with , or also long periods of rangebound activity. All right, as we look at Apple again having a move to thee again today, a nice positive day. We're up a third o percent. And I'm just ng over at our big board. We are still holding on gains and the ve moves across all four of our major averages for now, so far this morning. Don,s great to have you on. I hope you have a great we That's
Comentários 0
Entre para participar da discussão.
EntrarAinda não há comentários. Seja o primeiro a compartilhar sua opinião!