… Um, so the idea here is that this is a right triangle pattern which is going to roll over. And what this implies is that we're going to go from kind of a negative 1 correlation to a positive one correlation broadly speaking. So that's it. Short the spider, short the MQ if you want, and even the IEF. Can this um dichotomy that we've been witnessing uh merge into both instruments fall in at once? So by the end of next week, a week from when I'm recording this, a lot of smoke is going to clear…
Short the spider
Contexto extraído por IA
So that's it. Short the spider, short the MQ if you want, and even the IEF. Can this um dichotomy that we've been witnessing uh merge into both instruments fall in at once? So by the end of next week, a week from when I'm recording this, a lot of smoke is going to clear and it's going to be really interesting to see all this panned out. So that is uh my point of view.
…t triangle pattern which is going to roll over. And what this implies is that we're going to go from kind of a negative 1 correlation to a positive one correlation broadly speaking. So that's it. Short the spider, short the MQ if you want, and even the IEF. Can this um dichotomy that we've been witnessing uh merge into both instruments fall in at once? So by the end of next week, a week from when I'm recording this, a lot of smoke is going to clear and it's going to be really interesting to …
and even the IEF
Contexto extraído por IA
So that's it. Short the spider, short the MQ if you want, and even the IEF. Can this um dichotomy that we've been witnessing uh merge into both instruments fall in at once? So by the end of next week, a week from when I'm recording this, a lot of smoke is going to clear and it's going to be really interesting to see all this panned out. So that is uh my point of view.
Transcrição Completa
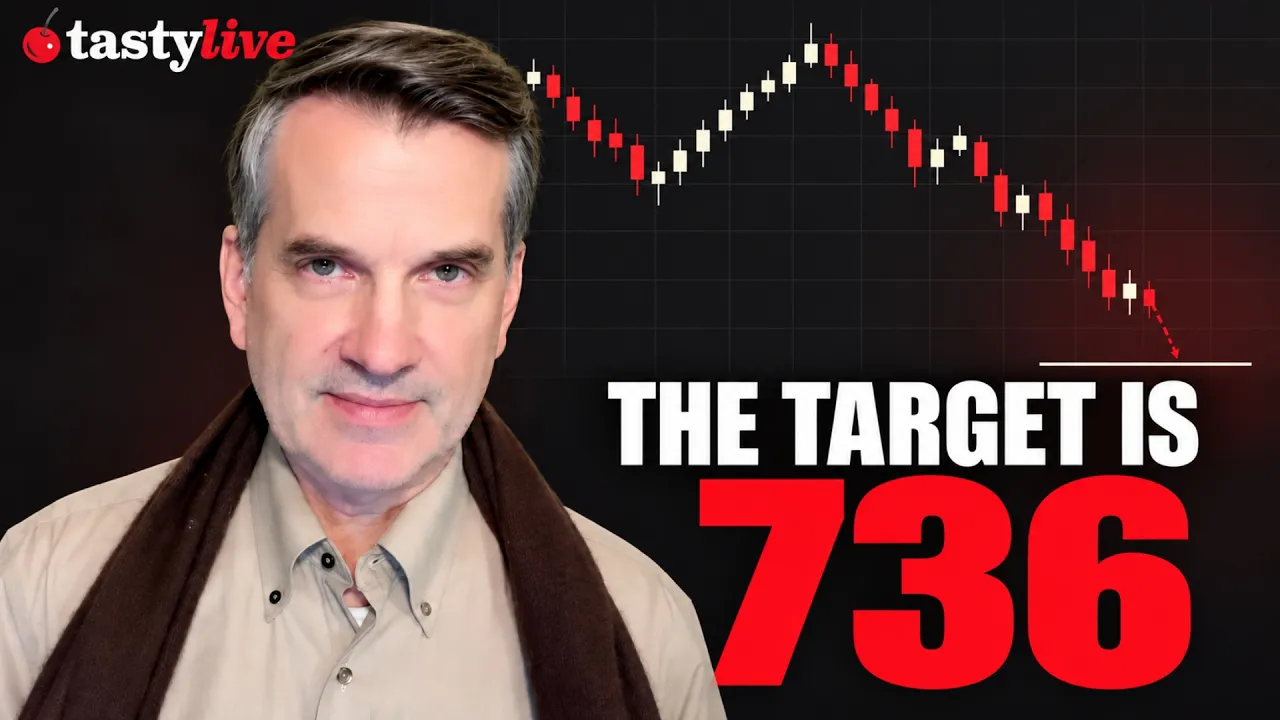
Well, hello. This will be the uh where we've gone from measuring the time to the election for months to weeks to days. At this point, might as well be hours. Um I'm recording this um in the middle of the trading day on Friday. We have Monday trading day. We've got Tuesday, election day, which I imagine people will be sitting on their hands. And then Wednesday, who knows? Um, but I've noticed some very interesting breaks going on that I wanted to bring to your attention. And um, as a preface, I would say that there seems to be a inverted correlation between bonds and stocks lately. Um, October has been generally bearish for stocks and generally very bullish for bonds. However, I think that being short stocks and bonds could work. Um, kind of a two for one. We will see. But let me show you some graphs to uh help illustrate that. The first one, I just made a discovery like a few moments before I turned the camera on. And this has to do with the ENQ chart. Now, this goes all the way back to 2018, but the channel right here uh was from around 2023 until the failure of that channel in 2025. And just because the channel failed doesn't mean that the market was entered a bare market. It just mean that the prices weren't strong enough to sustain the ascent within that channel. So, this line here, what used to be support became resistance. As you can see, all along here, resistance, resistance, resistance. And the last time it kissed the underbelly of that was early this summer. Now, here's what I just stumbled upon. I was curious about these two anchor points right here. And so, I put down a new fresh trend line, and it's kind of spooky because it almost exactly matches um I think this is sort of an Andrew's pitchfork situation. it almost exactly matches the um angle of that channel. So in a way we have formed this new lower channel that is key to watch in terms of whether support will hold. And so zooming in and and I didn't intend to show the ENQ in this video by the way, but I just can't help myself because this was I was so taken by this. As I'm recording this, we are trading at the same price level we were back on August 3rd and we are cutting below that blue dash line that you see. So the real question is will it break the trend line? Will it break this green line right like so which is let's make it simple 28,000 let's call it. Um, and that is crucial because if it does that, that would I think constitute an important new price failure. So, putting this another way, next major support is um not far from here, only about 3% away or so. So, um this isn't to the penny, but psychologically round numbers are important. So, let's call it 28,000. So, let's watch that line. So anyway, had no intent of showing you the ENQ, but I couldn't resist because that's really a cool new uh line that we've got. What I wanted to show you was this instead of the ES. Now, this goes back a lot farther back to 97. And it's a really interesting chart because in this instance, the um phases of the bull market have gotten smaller and smaller and smaller and smaller. So, we've got this one here. Tremendous rise in 2020, 2021. Then we've got this one here. A rise, yes, but not nearly so long. Then we've got another even shorter and another even shorter. And the last one was when Bessant tried to convince everybody that the war was over. It's amazing. Nobody talks about that, but the entire this huge three-day rally was based on Bessant saying, "The war is going to end. We've got it. Got it done." That was the last burst. And so instead of the that rally lasting years or months or weeks, it was measured in days. And they get shrinking and shrinking and shrinking. And so I think they're just about out of gas at this point. But this was that mega rally that Bessant conned everybody into moving into. But here's the interesting thing that's going on. This pattern right here. It's not big. It only goes back four or five weeks, but it is a cute little head and shoulders stop which is starting to break down as I'm recording this. And the measured move on this, not surprisingly, is almost perfectly at that trend line. And I would say that trend line is the same in import. So, a interesting trade on this would be to be short the S&P with an eye toward that level um as a target. Looking at this by way of the spider, same idea. Here's the pattern. And the measured move would be, I think, 736 if I calculated that properly, which aligns beautifully with that dashed line, which wouldn't you know it is the midline of a enormous price channel. So there's kind of two ways this could go. I mean, there's infinite ways, but two ways I'm thinking it could go. One way would be a fall to the measured move. Find support at the ENQ line I showed you. Find support at the ES line I showed you. That's the move, which is it's not um it's not nothing. It's about 20 points. Um but it's not anything catastrophic either. And that may be all we get. The other alternate, of course, would be to fail those lines. But as I think here, there's a hybrid of those, which is you get them both. I'm going to go with that one. So, we get a fall to 736 target. We rally for whatever reason. Um, so, and the election has got to play a huge part in this. We rally back to the neckline and then the real plunge begins. Maybe there's some post-election chaos. Maybe the president pulls something insane that nobody expected. Whatever. Um, I'm thinking that's what we're going to do. So, that's kind of my equity take on things. The other thing which is really speculative is the notion that bonds could actually fall, too. Um, here's the IEF, which is kind of my go-to instrument right now. And we zoom in on this. And on the one hand, we've had this uh really strong rally from October 7 to right now as I'm recording this. Um it's been a big lift, but my perception is that we have a huge blob of overhead supply here that we're not going to either get past or penetrate. Um, and it's also a really nice little, as I noticed here, nice little right triangle pattern. Um, and it seems to me, let's see if we can draw this. I'm doing this doing this live for your viewing pleasure. Let's see if we can work this out. We're getting an autotrend line from the top to the right cursor. No, that's not at all the way I wanted. Okay, never mind. I'll draw it I'll draw it manually. [snorts] So, the line I'm thinking of goes from here down to here. And let's make sure we've got that right because I want to give you really good charts here. Um, so the idea here is that this is a right triangle pattern which is going to roll over. And what this implies is that we're going to go from kind of a negative 1 correlation to a positive one correlation broadly speaking. So that's it. Short the spider, short the MQ if you want, and even the IEF. Can this um dichotomy that we've been witnessing uh merge into both instruments fall in at once? So by the end of next week, a week from when I'm recording this, a lot of smoke is going to clear and it's going to be really interesting to see all this panned out. So that is uh my point of view. We'll see what happens next. Thanks.

Comentários 0
Entre para participar da discussão.
EntrarAinda não há comentários. Seja o primeiro a compartilhar sua opinião!