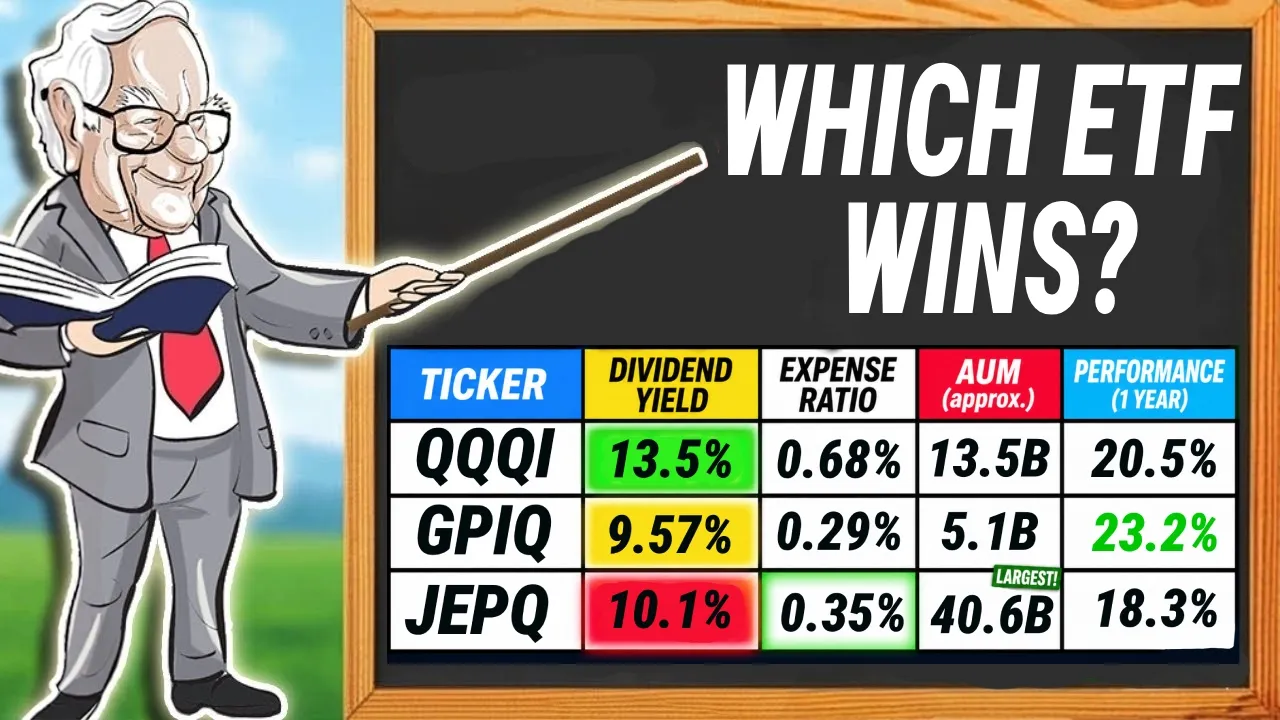
If you're looking for the best fit for maximum current income, QQQI is probably your best bet.
Context
Near the end, when discussing which fund is best for maximum current income: If you're looking for the best fit for maximum current income, QQQI is probably your best bet.
If you're looking for the best balance of growth and upside along with current income, it's going to be GPIQ.
Context
Near the end, when discussing the best balance of growth, upside, and current income: If you're looking for the best balance of growth and upside along with current income, it's going to be GPIQ.
And then if you're looking for the best fit for lower volatility along with active management, probably JEPQ,
Context
Near the end, when discussing lower volatility and active management: And then if you're looking for the best fit for lower volatility along with active management, probably JEPQ,
probably what's best is GPIQ if you're looking for the most sustainable income with some upside potential.
Context
Later in the conclusion, when the speaker states the long-term preference: probably what's best is GPIQ if you're looking for the most sustainable income with some upside potential.
And if you're looking to maximize income right now, it would be QQQI.
Context
In the closing summary, when comparing immediate income: And if you're looking to maximize income right now, it would be QQQI.
Full Transcript
The dividendology covered call ETF database continues to expand where we provide in-depth data and key insights into a multitude of these option income ETFs. And with the QQQ being up nearly 100% in the last 5 years, one of the most common questions that I see is which of the NASDAQ 100 income ETFs is best, QQQI, GPIQ, or JPQ? And the reality is that each of these funds has their strengths and weaknesses. And depending on your needs today, we're going to be figuring out which one could potentially be best for you. Is it QQQI from NEOS, GPIQ from Goldman Sachs, or JPQ from JP Morgan? We'll also be taking an in-depth look at the tax consequences for each of these ETFs. I spent plenty of time building out this tool, and I even linked the sources that I pulled this from. You can mess with the variables to see what your actual output would look like. And if you'd like to download this sheet absolutely for free, then you can do so at the link in the description. So, let's go ahead and dive in. Now, when we talk about these covered call ETFs, there's a few different things we need to take into consideration. Obviously, we have questions about the income, the actual performance of the fund, what the option strategy looks like, taxes, management, the fund attributes, and who the fund is for. So, naturally, let's just go ahead and start with performance. Now, as I pointed out earlier, QQQ is up in the last 5 years around 99% in the last year alone up nearly 28%. So, naturally, we should expect each of these funds to have performed quite well. But which is performing best? Well, let's start by looking at the performance year to date for each of these funds. Now, what we're looking at here on Seeking Alpha is the price return, not the total return. And there's an important reason why we're looking at this, and I'll point this out in just a moment. When we look at QQQI, it's up by about 2.88% from NEOS. Jeep Q up about 2.53% and then GPIQ is up by 8.1%. So from a purely price return perspective, GPIQ from Goldman Sachs has quite the lead so far year to date. Look at them in the last year. The same is essentially true. GPIQ is leading the pack with Jet Q in second and QQQI trailing behind. But how do things change when we look at them from a total return perspective? I mean, if you're someone interested in covered call ETFs, then it's obvious income is an important goal. Well, if we look at them now on a total return basis, we can see GPIQ does win, but QQQI is actually coming in second year to date with JetQ in third place, but still posting 8.5% total return. In the last year, we can see GPIQ still in the lead, up nearly 27.6%. Which again for reference is absolutely incredible because in the last year, QQQ was up 27.96%. So that fund has managed essentially in the last year to capture all of the upside. That's extremely impressive. Meanwhile, Jeep Q and QQQI have definitely posted strong total returns, but as expected, have lagged behind the market. Now, it's important to note these funds aren't designed to maximize total returns. To some people, that might sound counterintuitive, but to someone looking to live off dividends. A lot of the times it can actually make sense. So, yes, we see in the last year GPIQ from a total return perspective is the winner. But that certainly doesn't paint the whole picture. However, it does raise a very, very important question. How is this fund structured that's allowed it to outperform QQQI and Jeep Q? This is where we need to turn to the dividendology covered call ETF database and point out a couple of things. To start off, let's take a close look at QQQI, the NASDAQ 100 fund from NEOS. And there's two important metrics that we need to point out. Number one, the fund is using out of the money calls. Now, this is very common for these covered call ETFs. And one of the things that you'll notice is this is pretty frequently used. It has lower premiums, but allows them to take some part in the upside. And it's typically better in bullish markets. And we can see QQQI has taken some part in the upside up about 5.6% with the share price in the last year. However, perhaps even more importantly, one of the things we can see is their options coverage. Portfolio options coverage is close to 100%. Now, if we look at our guide, essentially what this is telling us, if we come over here, this is the percentage of the ETF's underlying portfolio that is overwritten, otherwise covered with call options. For example, 50% coverage means only half the portfolio has calls written against it. With QQQI, again, it's close to 100%. So, what does this mean? Well, it means they're going to generate a lot of income because they're writing a lot of options on the portfolio. They're typically writing it on the entirety of the portfolio. However, the flip side of this is it's going to cap more of the upside, but we can see the trailing 12-month yield for QQQI is sitting at 13.53%. Let's check the exact same thing for Jeep Q, who in the last year is up about 11.3%. If we look at Jeep Q and scroll all the way over, we can see the exact same out of the money calls close to 100% portfolio options covered. So, again, they're focused on maximizing the distributions from the fund. And we can see the trailing 12-month yield is above 10% at 10.35%. Now, if they're using pretty much the exact same strategy, why do we see this difference in performance between QQQI and Jeep Q? Well, the difference is revealed when you start to dive into the fact sheets of these funds. As you already know, QQQI's underlying exposure is the NASDAQ 100 index. However, Jeep Q is slightly different. If we look at the Jet Q fact sheet, what you'll notice to their approach is they generate income through a combination of selling options and investing in US large cap stocks seeking to deliver monthly income from associated option premiums and stock dividends. They seek to deliver less volatility than the NASDAQ 100 index in addition to monthly income. So essentially, Jeep Q is a bit more of an active strategy. While it's listed as a NASDAQ equity premium income ETF, the overall strategy is a bit more active in the actual holdings that they choose for the fund. So naturally, you're going to see a difference in performance. Now, that being said, why does GPIQ beat all of them from a total return perspective, from a price return perspective? And this is perhaps the most important to note. What you'll see is the trail and 12-month yield for GPIQ is the lowest. It's about 9.66%. which obviously is still extraordinary. But again, look at the Dividendology covered call ETF database. When you look at GPIQ and scroll all the way over again, you'll see out of the money calls. We've already touched on this, but the portfolio options coverage strategy is radically different. It's about 25 to 75% portfolio coverage, different than the 100% for the other funds. The natural consequence of this is it's going to generate less premium. that starting dividend yield is going to be a little bit lower than the other funds. But at the exact same time, because they're writing less call options on the entirety of the portfolio, they leave the portfolio upside less capped. It can take more part in the actual upside. And that is exactly what's happened. So, we've analyzed the performance of these funds and we understand a little bit more what the actual strategy with management with the fund attributes look like that lead to that performance. However, we need to take a closer look at the income because the way these funds are structured actually impacts the income they provide. What we've already seen is that yes, QQQI has the highest distribution rate. But that's not the only thing we need to be paying close attention to. If we jump over to our dividend breakdown sheet from ticker data, let's go ahead and look at the actual distributions since inception from each of these funds. And let's start with QQQI. I'll just plug in the ticker and hit enter. And again, thanks to the help of the ticker data add-on, the data will automatically load into my spreadsheet. Now, when we look at QQQI, one of the things you'll notice with the distributions is overall they've been incredibly stable, particularly for a covered call ETF. A lot of the times the distributions will be quite choppy for a lot of these funds, but mostly that hasn't been the case for QQQI. However, you can see there was a dip here in 2025 where the distribution in January was about 62.41 41. In the following 3 to 4 months, it dropped all the way down to about 53.09. It's not a massive decline, but it's worth noting. Why did this happen? Well, it happened because the net asset value dropped dramatically in a short period of time. If we zoom out, we can see exactly when this happened. The tariff scare of 2025. We have to remember that if the net asset value is dropping, then the premiums that the fund generates that are turned into distributions drop as well. This is most detrimental to funds that are using 100% portfolio options coverage, which QQQI is doing. But overall, they've managed this extremely well. The distribution rate that's been maintained overall, I think is extremely impressive. Let's look at the other funds. Next, let's look at Jeep Q. And this is where things look radically different. Look at the distributions from Jeep Q. It's been pretty choppy. Now, to be fair, this fund has been around the longest. It made its first distribution in June of 2022. And at the time it was about 37.64 cents per share. Since then it's been as high as around 68.13 cents per share and as low as around 34.17 cents per share. Now one of the things we can see is overall at least since around early 2024 is generally speaking the distributions have been growing. One of the things we need to ask is why has this been the case? Well, it's really not that complicated. With as well as QQQ has done, most of the underlying holdings for Jet Q have climbed higher as well. And with a higher net asset value, the fund can make larger distributions. But this is a good example. When that net asset value drops, naturally the distributions they make drop dramatically as well. Again, that's the risk of 100% portfolio options coverage. But let's take a look at GPIQ because this is interesting. With GPIQ, we can see they made their first distribution in December of 2023 at about 37.55 cents. And again, there's been a little bit of fluctuation, but overall, those distributions have continued to grow higher and higher with the recent one at 51.91. So, while typically people just look at the headline trailing 12-month yield for these funds, what you have to understand is with GPIQ because we saw that their portfolio options coverage is sitting at 25 to 75%. They're not writing options on the entirety of the portfolio, their net asset value can continue to grow, which raises distributions. And so if distributions are raising, we don't only need to pay attention to the starting dividend yield of this fund, it means that the yield on cost is actually growing as well. So yes, if you bought right now, your yield would be around 9.6%. But if you would have added this fund back in October of 2023, your yield on cost would now be above 14.54%. That's quite the difference versus the other funds. So now we have a much better understanding of the income layout, the performance layout, what the management teams look like. But there's still a few more things that we need to account for. And one of the biggest ones is going to be taxes. And again, I had to build out an in-depth spreadsheet model to really visualize what this actually looks like. So let's talk about this for a moment. In this scenario, we're assuming that we're looking at a single person, someone filing single with annual income of $80,000 in the tax year 2026, standard deduction of $16,100 with a 0% long-term capital gains threshold of around $49,450. And keep in mind, in this example, we're not also including state and payroll tax because there's too many variables there and there's people watching from all across the world. Now, here's where things get really interesting for these funds. If we zoom in and take a closer look, one of the things we have to remember is portions of the capital distributed will be return of capital, portions will be qualified dividend income, potentially portions will be long-term gains, and then portions will be ordinary income. And each of these income classifications gets taxed in a different manner. And with this data, we can project out what the tax consequences will be for each of these funds. Now, if we take a close look at the assumptions, there's a couple of things you'll notice for each of these funds. What we can see is the vast majority of QQQI's capital that's distributed is known as return of capital. The same is true for GPIQ as well. Now, keep in mind these numbers can vary every single month, so it'll undoubtedly look different, but there are some serious tax advantages to return of capital. You generally don't owe federal income tax on that portion in the year you receive it. Instead, the distribution reduces your cost basis on the investment. So, take a close look at this. You can see what the overall breakdown for each of these funds looks like right here along with what it would look like with W2 wages. If we jump over to our summary tab, let's go ahead and zoom out and just take a glance at this. We can see each of these funds is being taxed in a very different manner. For example, W2 wages you would pay the most. In federal taxes, you'd pay around $8,770. With Jet Q, because typically none of it is return of capital, you'd pay around $8,490 in year 1 on taxes. With GPIQ, it is radically less around $654 again because your return of capital is sitting at about 71.7%. And then finally, QQQI, who generally almost distributes all of its capital as return of capital, you would have nearly no taxes. Even if it was a little bit lower, the tax basis is still typically going to be lower than GPIQ. Now, again, this is going to vary every single month, but generally speaking, the layout will look something similar like this. Now, what you absolutely have to remember is return of capital doesn't just magically solve all of your tax consequences. Future gains may receive capital gains treatment. Because return of capital lowers your basis, you may recognize a larger capital gain when you eventually sell. So, when the holding period and circumstances qualify, that gain may be taxed at long-term capital gains rates rather than ordinary income rates. That's just something to keep in mind. But still, for someone looking to potentially live off dividends, these two see a huge advantage. A couple of other things to quickly note. QQQI with the highest expense ratio at 0.68%. We can see Jeff Q sitting at 0.35%. And then we have GPIQ at just 0.29%. So for the most part, we've gone through the key points for each of these funds. Really, the last question we need to ask oursel is who is the best fit for each of these funds? The reality is if you're looking for the best fit for maximum current income, QQQI is probably your best bet. If you're looking for the best balance of growth and upside along with current income, it's going to be GPIQ. And then if you're looking for the best fit for lower volatility along with active management, probably JEPQ, but I'm going to be completely transparent and tell you what my preferences are. I think QQQI and GPIQ are probably the two best. GPIQ is going to provide more sustainable income in the long term simply because the portfolio options coverage is significantly lower. it allows them to take more part in the upside and like we saw as a result earlier, it allows the distributions to actually even see growth over time when QQQ is growing. Now, that being said, QQQI is yielding quite a bit more, closer to around 13.5% versus GPIQ of around 9.5%. So, it absolutely still wins from an immediate income perspective. So, there's no doubt each of these funds does truly have its own advantages. Each one is different and unique in its own way. And probably what's best is GPIQ if you're looking for the most sustainable income with some upside potential. And if you're looking to maximize income right now, it would be QQQI. Again, if you'd like to get access to the Covered Call ETF database absolutely for free and also get access to the pretty in-depth tax model that I built out for this video, then you can do so for free at the link in the description as well. So, go ahead and let me know what you think of each of these funds in the comments down below. And like always, please don't forget to like and subscribe to the

Comments 0
Sign in to join the discussion.
Sign inNo comments yet. Be the first to share your thoughts!