Context
"What about Tesla? Tesla has pulled back..."
Full Transcript
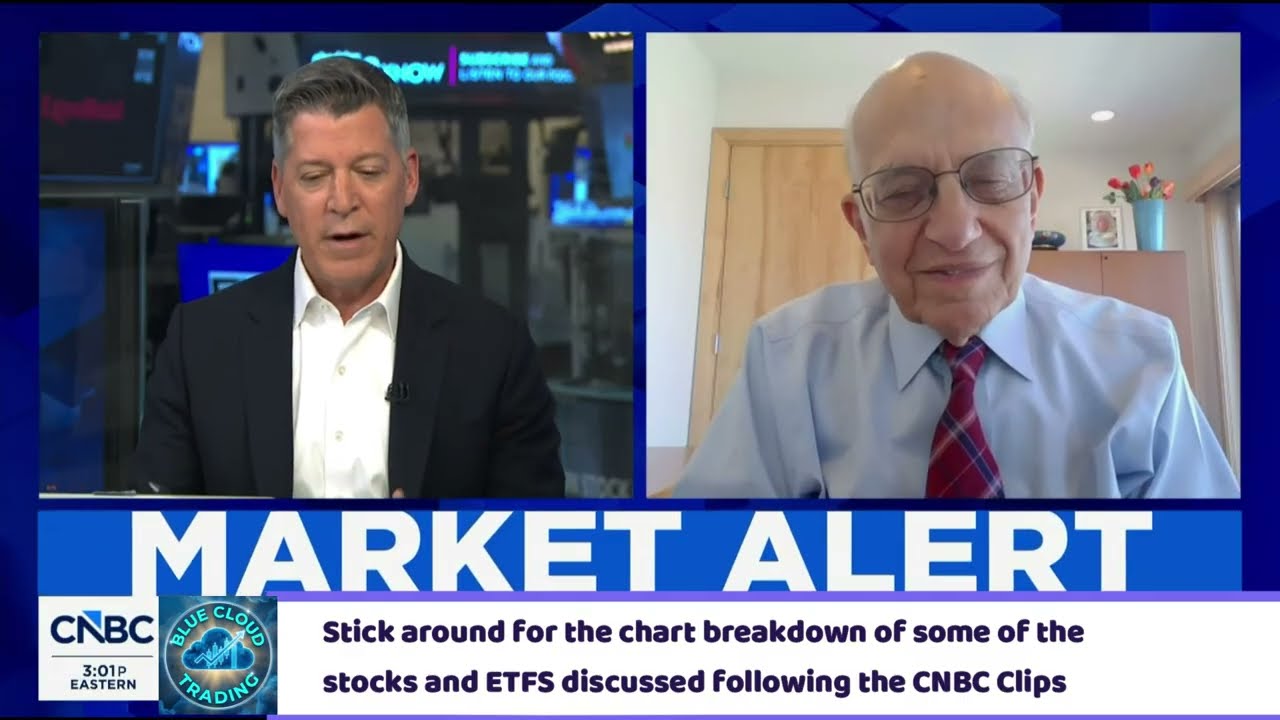
Blue cloud trading [singing] through the night. >> Welcome back to the channel everyone. [music] In just a second, I'm going to play a few CNBC clips from today's episode of the halftime report. I'm going to pull up the charts and dive into the technicals of some of the mentioned stocks. We're going to look at the key support, resistance levels, momentum, and see if the price action actually backs up what the talking heads are saying. Hit that like button. Subscribe if you haven't already and let's roll the tape on the first clip. >> Thanks guys. Welcome to Closing Bell. I'm Scott Wner live [music] from Post 9 here at the New York Stock Exchange. This make or breakout begins with Tech's very good week. It's best [music] in fact since early May. How about that? Here's the scorecard with 60 to go in re uh regulation uh reflected certainly in how the [music] board looks. NASDAQ's up almost 1%. Tech has led the week. It's been the strongest uh since April for [music] the NASDAQ. uh Nvidia, Microsoft Meta, all with strong showings. And how about Palunteer today? A huge winner after its earnings. We'll have more on that in a minute along with some of the other big software stories. There are many financials going for 10 straight weeks of gains. It is the longest streak there since at least 1989. We'll follow that as well. Takes us to our talk [music] of the tape, the tech resurgence and whether it will carry the market to much higher levels from here. Let's ask the Wharton School professor of finance. He is Wisdom Tre's chief economist as well and he is Jeremy Seagull. It's a Friday tradition. I'm happy it is. Welcome back. >> Thank you very much, Scott. Happy to be with you. >> So, this this market's endured so much and here we are marching higher. How do you see where we are? We got a disappointing jobs report. Obviously, we've had some deleveraging in the market that made people a little nervous and here we are. As I said, we're in the green text leading. What do you see? >> Well, let me give you a positive spin on on on those two events. First of all, I think what happened with sit situational awareness was really very good for the market. Uh I mean, a wash out like that, it didn't cause any other crisis. Uh we didn't see any of you know, you know, the the dominoes falling. Uh you know, I mean, certainly it was a loss to them, but yeah. Hey, 3 days later he's making another investment. I mean, um, uh, I, you know, I thought that that could spark a lot more selling. The fact that it didn't, I think points to the fundamental strength of the market cuz everyone was worried, oh, there's too much leverage, too much leverage. If there was a lot more leverage, you would see a lot worse outcome there. >> Secondly, >> that's that's that's an interesting point. Yeah. Go ahead, make your other point. >> Yeah. I mean, just on to I wasn't that disappointed. Let me tell you why I wasn't disappointed in employment report. You know, I was wondering [clears throat] why why did we only have 1 and a.5% GDP in the second quarter with all those people that were working. Well, well, now we found out that there wasn't all those people working. So, that means productivity was actually higher. And although that we got some uh you know surprises on the upside with productivity, productivity last two and three quarters have not been good. what we would expect AI to give us. But now when we use less people with less hours, I think we're going to get a revision upward in productivity. I mean, we can produce 2 to 3% with no extra workers. That means productivity is going up. So I think that that is actually when I looked at it, I say, "Oh, hey, maybe that explains why we only had one and a half% GDP." we really did not have, you know, hundreds of thousands of new workers. >> Um, >> so, so when you, professor, get a target of 8,50 from CFRA, which you did today, or you get a we could hit 8,000 in August alone, from Tom Lee, or Edard Denny saying 8250 for the year might actually be conservative. >> Does that match up with your thinking? >> Yeah, I mean, it it definitely absolutely can definitely happen. I mean, I have never seen a surge of in of profits of earnings like this outside of coming out of uh a recession. And so this is a this is an economy that is able to produce earnings without having you know four 5% GDP growth. Uh that that is absolutely truly remarkable. Um uh let me tell you something else that you know we're all worried about what happened in Iran whe whether that deal is going to work. Is oil going to go back up? Um uh when you talk about energy the most important energy source is actually for the United States natural gas. Natural gas I just checked it February gas which is the most important because that's the heating season is 15% lower than the day before the Iran war. the most important source of energy. So, yeah, we're going to have, you know, we may have a little bit more here on on whatever happens. I hope there's a deal. We all hope there's a deal on the on the oil side. But I'll tell you what what I see happening on natural gas again more important to energy production than than oil electricity production uh than oil heating almost completely in the United States. Uh shows you that that is a very very positive factor. I mean, many bulls will say that you nailed it with the the earnings story. That is the whole story that it's the reason why we've been able to look past so many of the the things that have gotten in our way for a minute because the earnings momentum and the earnings growth remains so strong and it's expected to continue to be just that. And then if you want to say, well, there's icing on the cake, too. I think John Waldrin, the president of Goldman Sachs, said it earlier this week to Andrew Ross Sorcin that it's broadening. We have to start talking about tremendous earnings growth outside of tech. Even with those numbers as large as they are, there's impressive stories to be told elsewhere too. >> Yeah. And absolutely. And again, what's interesting this profit the margins of tech and related tech have been going up. the mar the margins have been relatively stationary of all non- tech because they haven't implemented AI that is the future I mean I've been talking to some people saying about AI consultants are coming in to telling firms hey you know let me show you how you can reduce cost dramatically because a lot of firms really don't quite know how to use it optimally that's the next frontier that's the profit surge in the nontext sector and what could drive the S&P beyond uh 8,000. Um and again I think listen the we you know I spoke about I thought that the chip sector was too frothy you know with SK highix and you know what was going on there that froth has come off. So a lot of what we were worried about over speculation, overleveraging, I think the market proved that uh that was not going to be a problem. And that's why I, you know, I'm not no one can guarantee we're going over 8,000 or 8,200. But uh you know, I don't see any real obstacles in the path towards towards that rise. that that's been a really interesting and remarkable, I think, characteristic of this bull market the entire way and probably why you've had V-shaped recoveries all along the the road map. The self-correcting mechanism of this bull market is is something to behold. Um, and and I I think you you speak to it when you think of the froth that the market was able to get rid of, if you will, some excess without having the whole story fall apart and then rebuild itself. Now, another interesting story of late is that depressed areas of the market have been able to show signs of life again, too. I'm talking about the software trade. Palanteer with a tremendous week and there are many other names in that basket too. I'll ask you to hold on for just a moment, professor, and get a closer look at that from Dom Chu who's going to give us an idea of the moves that we've seen within this group. Hey Dom, it's Scott. It it's been pretty amazing the sentiment shift so far just this week alone for software. We'll use ETFs to kind of tell that story in that lens. The isshares uh software ETF, the ticker IGV over the last week is up roughly 8% and again if you put it in context though longer term it's still a pretty decently down story right you look over the last year down 7%. It has taken a backseat to many parts of the tech trade namely when it comes to semiconductor stocks. Now there have been fundamental drivers of the reason why that software trade this week has been a standout. three names in particular at the top of the list with regard to holdings within that ETF that have done really well over the course of this past week. Look at Atlassian, look at Palunteer, and look at Unity Software. All up between 34 and 50% in one week alone, driven in large part by that earnings story and the outlooks that they have. So, it's not just a momentum thing. It's earnings that are kind of backing that up and the outlooks that they have. Now, if you look at that software trade versus the semiconductor trade that we've highlighted throughout the course of the past six to 12 months, you take a look at this over the past kind of month or so here, it's been a decent amount of outperformance on that software ETF versus the semiconductor ETF. But again, this is just one month long over the longer term on a year-to- date basis, there is still a massive gap in performance between that software trade versus the semiconductor. So whether or not we see any kind of movement there to close that gap even further, that's something to be watched. And by the way, Scott, Wells Fargo's chief equity strategist, Osan Kuan, noted in a note to clients today that the ETF flows for semiconductors were some of the worst of course of industry groups this week compared to the best, which has been software and services. Things are moderating a bit, but still that software services trade versus semiconductor is a big one. Scott, I'll send things back over to you. And I'm glad you point that out, Dom. Thank you. That's Dom Chu, professor, you're still with me. Let's welcome in Warren Pies 314 research co-founder, Malcolm Ethridge, Capital Area Planning Group Managing Partner. Um, Malcolm, I I'll come to you. I mean, tech's back in a big way. I I gave the stats about the sector having its, you know, best week in a long time. The NASDAQ having its best week since April. This now the leadership again. >> Yes, Scott. I I I think yes. I heard you frame the conversation talking with the professor a second ago about the rotation uh underway and I you know how I feel about this. I'm a firm believer that the market is really skating to one song and one song only. And really that's just AI capex. And so because the la the the previous quarter we just got the four main hyperscalers that matter that are doing all of the building spending the money to build out the data centers and buy the infrastructure required to to build the compute to run these models and everything else. because those four companies either reaffirmed their guidance or increased their capex guidance that bought the market potentially another 2 to 3 months of this euphoric feeling that we've been uh undergoing and that's why the week has looked so strong. So, it's not surprising to me that tech is back in in whole back at the helm of this bull market because it's really all about one thing, the AI capex story. >> But I mean, if that AI capex story is such a big thing, then a why is that so bad? B, it doesn't mean that tech is the only group that's going up cuz if I look at, let's just say year to date, for example, industrials are up almost 20%. I mean that plays into the AI story that plays into the data center buildout. Uh maybe part of the materials trade does too in terms of the industrial metals like copper, uh aluminum and and and some of the other things there and energy by the way up 28%. I mean there's a lot going on in this market, Malcolm, outside of tech. Are you giving enough credit to that? Yeah, I don't mean for it to sound as if as if I'm saying it's bad that these companies have increased or reaffirmed their capex story. I'm just saying that that is the thing that has breathed new life into this bull market cycle. And so I think that it's going to continue for another two to three months solely because those companies had positive things to say at this earnings period. But to your point, I think that it is the trickle down effect of all of that spending. We've had about $2 trillion on its way to $3 trillion in just three short years that is being spent by the hyperscalers to do this buildout. And so all of the companies, whether it's in industrials or real estate or something else in between, are the recipients of all of that spending. And that's why those sectors look like, you know, they're healthier and they're on their way. But I don't consider that to be a rotation in the sense that the earnings power or the earnings conversation should include anything other than the hyperscalers doing the spending and the chip companies that are receiving the bulk of that spending on the front end. >> How do you see this market right now, Warren? >> Yeah, I think Malcolm has it pinned basically like our view was that we've been overweight equities since midappril. We're still riding that call for now and we really wanted to be overweight through this earning season. We like the setup. I know you're saying there are a lot of like targets getting raised today, but you know, probably should have been doing that, you know, a few weeks ago in preparation of this earning season. It kind of worries me to see the targets raising now. But nevertheless, I think that the the the chip stocks are so there was so much hedging and volatility was so high with that group. We were pretty confident we put in a low with the semiconductors and then we thought that the the recipe for a higher index was for hypers scaler earnings to come through. This is what's happened. I think it's largely played out. I think we have a couple more few more weeks left in this grind higher and then the market's going to have to start thinking about macro concerns and things like that. I wouldn't be surprised to see us take our equity overweight back down and neutralize that. I think it's getting closer to the end of this big rally move and and you can see it and you can feel it in the sentiment too is I I think that everyone's getting wrapped up and looking in the rear view a little bit. >> I'm glad you mentioned that cuz it's exactly where I wanted to go back to the professor on this idea that you know sentiment now feels like it's overwhelmingly bullish in most camps not all. Professor Michael Hartnett of BFA, their bull and bear sentiment indicator rises to the highest level since 2021. It's very emblematic of what Warren was just describing. >> Yeah. And uh you know those sentiment indicators have been around for over a half century. You know, it's interesting. They don't usually predict near-term tops. They have to be there for a while to produce the top. And uh you know when I look ahead 3 to 5 years I ask which type of stocks have the greatest opportunity for margin expansion non- tech which have been relatively stable and still yet to use the full implementation of AI or all the tech and compute that is of course booming to supply it but has had margins that we just haven't seen before in history and deservedly so. but with competition always around the corner. So I think that it's not just all tech and I think the opportunities are still you know undiscovered in in the uh you know other what 480 stocks that we have in the S&P but it doesn't mean that tech and and non- tech can't continue together to hit those 8,000 targets that you mentioned at the beginning of our our show. that that goes back Warren doesn't it to the fact that earnings growth and earnings momentum is broadening and in in that scenario as long as that remains the case and by the way estimates for the next two quarters at minimum uh look really strong then why wouldn't the market be on strong footing for that duration >> yeah I mean this is something we we've been talking about going back to last year is that we've been we foresaw this earnings breakout and I do think you know it's It's real and it's it's impressive and but I think that's the reason why the market's up again after two straight 20% years. And so I I'm not saying that we're at some kind of secular top or even bearish. I mean, we're overweight equities at this point in time and really because of the fundamentals and the the earning story that we that everyone is now familiar with. But I worry about some of the macro things coming up and the seasonality that we're hitting here between September and October. Right. I do think that it's a coin flip if the Fed hikes rates in September, even after today's jobs report. And I think the jobs report today shows us again that it would be a mistake if they did that. And I then think beyond that, the midterms are also a source of volatility. So when I see excess excessive sentiment and then some macro uh clouds forming on the horizon, I start considering, you know, when are we going to reduce our equity overweight? It can't just always be a bull, you know, and so that's that's the that's the recipe I'm looking at right now. Okay, Malcolm, I'll give you the last word to react to that statement right there. >> Yeah, I I would say even to the point that the professor was making, I think it's a really important one. If all of the productivity that we are promised via AI does actually come to fruition, I would think that it probably means that we start to see more of that convergence that Dom was showing between the IGV and the SMH. It would start to get a lot closer and those dollars would flow into software companies. software companies will be able to show a lot more productivity faster than most other industries. And so if AI is being weaponized in the way that we want it to in the sake of productivity, that's where it'll show. And the trend should carry more than just one or two weeks at a time. It should be sustained growth in the IGV and those software companies that underpin it. And that's how we will know whether it's a rotation and a rollover happening where the AI technology is being absorbed and being made productive or if we're going to have to eb and then flow our way into it. >> All right, gentlemen. We'll leave it there everybody. Have a good weekend. The professor Warren and Malcolm, we'll see everybody soon. I'm sure of that. Let's get to some of today's top movers. There are many. Starting with shares of SpaceX. Monster week for the stock. Best since going public. Options traders having a field day with that move as well. Good to check in with Oliver Renick who plays options action for us from the SIBO in Chicago. What do you see? >> Hey Scott, SpaceX options are so back. 2.4 million contracts traded today, four times the one-mon average, third most in the market after Nvidia and Tesla for about $1 billion in premium and 60% of it tied to calls. The bottom line is those big put sellers we saw on SpaceX yesterday are feeling very good right now as the stock finds support. But some of the call buyers still have work cut out for them, including in these next 40 minutes into the bell. Right now, four of the top five call contracts expire today. There's about $20 million in the 120 strikes, which look very safe. But the most popular by volume, and with almost $8 million on the line, are the 130 strikes, which are heading for a photo finish right now. So, how this stock closes today might just make or break some people's weekend, Scott. All right, good stuff, Oliver. Thanks and good weekend to you. Mackenzie Seagal has more on a Airbnb, excuse me, surging today. A beat and raise, right? >> That's right, Scott. Airbnb up nearly 16% today off the back of that print as Wall Street rerates its growth outlook following a stretch where bookings had cooled and investors were questioning whether the company's hyperrowth phase was fading. But Wells Fargo now raising its target to $186. city to 193 after Airbnb beat and boosted its fullear guide. CEO Brian Chesy telling me that AI is the number one explanation for the results. Airbnb poached Meta's former generative AI chief as CTO this year, now uses more than a dozen models, including open- source LLMs, and says that AI is driving bookings, cutting service costs, and boosting productivity. Firsttime bookers are growing at the fastest pace in four years. In the US, its biggest market accelerated from Q1. Headcount is flat year to date. While Chesy expects revenue to keep growing much faster than staffing, he also says that Airbnb will spend far more on AI tokens than originally planned because the returns, including higher revenue, more than justify the inference costs. Scott >> Mac, thank you. Mackenzie Sagalis, let's check in on Sweet Green shares selling off today. Brandon Gomez has more on that. Hi there. >> Hey there, Scott. Yeah, small cap Sweet Green cutting its fullear outlook. The company said food safety concerns weighed on demand, but the pressure Scott wasn't entirely cycllospora related. To recap, Sweet Green missed expectations on the top and bottom line, a 22cent adjusted loss per share on revenue of 193. Same store sales fell 6.2% worse than the street had expected. Now, the company expects an adjusted IBIDA loss of up to 27 million. That's down from a profit. Management said business was improving with transactions going from down 11% in Q1 to roughly flat in June before tanking mid July. Now, analysts I've spoken with are leaning toward this being temporary. A positive update yesterday from Michigan health officials at the center of the outbreak, telling residents that salad greens and lettuce consumption can return to routine guidance as cases decline in the state. So, some good news there Scott. >> All right, good stuff, Brandon. Thank you. That's Brandon Gomez. We're just getting started. Welcome back. President Trump moving forward today with his attempt to fire Fed Governor Lisa Cook. Our senior economics reporter Steve Leeman joins us now with more. Steve. >> Scott. Thanks. The White House taking steps to potentially oust Fed Governor Lisa Cook from her job. Continuing an effort begun last year that reached the Supreme Court. A White House letter, [clears throat] pardon me, sent Wednesday to Cook to Cook details the previous allegation of mortgage fraud, which Cook has denied. The letter says that the president has determined, quote, "There is reason to believe the allegations constitute cause to remove Cook from office." The letter also reads, quote, "This conduct was grossly negligent and [clears throat] demonstrates that you are unfit for the office in which you serve as a controlling member of the Federal Reserve." Cook's attorney, Abby Lol, provided the following statement. quote, "These allegations are as baseless now as they were a year ago when President Trump tried to remove Governor Cook and interfere with the independence of the Federal Reserve. There's no valid cause for removing Governor Cook, as we did before. We will challenge this latest pretext and preserve her position and the historic role of the Fed." The Supreme Court in June, as you remember, found the president was not within his rights to fire Cook in part because he had not provided notice. So this letter suggests the president attempting to follow something of a blueprint the court provided for firing a Fed official that might be acceptable. At the same time, the court also held that Fed officials hold a special status that makes them different from other officials that were fired from agencies once thought to be independent under President Trump that have been sanctioned by the court. The move by the president puts new Fed chairman Kevin Worsh, I guess, in an awkward position here. Former Fed Chair Powell showed up at Cook Supreme Court hearing to show his support. Scott. >> Okay. It's been the best week for stocks since April as earnings continue to be better than expected. And that along with the return of the AI trade has many market participants raising their own optimism. Chris Tumi is founding partner of Morgan Stanley Team Global. It's one of the firm's top rated private wealth firms. Welcome back. It's been a minute. Are you one of those raising your optimism? Cuz I got a lot of targets that are at minimum 8,000 now. >> Yeah. >> What do you think? >> I think they're going to be raising those targets. I think um we're in a situation here where we had a very good uh pullback in the market given how far valuations had run. Um I think this was a good opportunity to understand the difference between the dynamics with regards to valuation and what's happening with regards to markets. You saw a situation where the S&P came back about 3%. But if you look at momentum indices, they were down as much as 40 or 50%. So the move down was significant with regards to some of those names that had run really hard. This was a move similar to like the GFC, right? And so it's important to understand what's driving that. Some of that's that levered ETFs that the retail investors are focusing in on, but there's a lot of desks on Wall Street that run these momentum indexes. And hedge funds are specifically looking at controlling that risk by shorting it or using options on it. And what happens is is that starts to build momentum and then we had a complete wash out with regards to hedge fund which I think really creates the bottom in the market. And so I think we're ready for that next leg of the bull market. >> Wow. >> So we we we that's a clearing event. We we cleared out a lot of froth and now we're ready for a reset. >> Correct. And I think what's important is you you hit on one important thing I think before. What's driving this market so far? You know, it's interesting because it's tech of course, but energy and industrials, you know, those are early cyclicals that have done really well. And a big reason for that is the top three earnings uh uh surprises to the upside, energy, tech, industrials, and so we've seen that kind of play out with regards to price performance. Now, going forward, we think the market's going to be a little bit more discerning. Are you surprised in any way that the situational awareness unwind and the momentum collapse, albeit a short one, didn't have a greater impact on the overall market? I mean, the professor Seagull was was saying he was Yeah. I mean, look, we've seen this before. We saw uh an operator a couple years ago have a similar effect affecting multiple desks on Wall Street, which created a crescendo with regards to the market. It was pretty um impressive with regards to seeing how well the market took the news and then move forward. I think the real positive thing that gave them that ability to look forward was just how strong earnings were. If you look at it, we had two consecutive quarters of north of 20% type uh earnings growth over 40% year-over-year. And importantly, you talked about this before, we're seeing real breath. The median S&P is up over 14%. And so there's plenty of opportunity in other areas, not just in tech. >> Okay. So unless that changes, you don't change your view. And dare I say, you sound more bullish about this market than you have in a long time. We've had a lot of conversations. >> No, look, I think I think we've been cautiously bullish. You know, look, if you look at it, I think that the big thing for us has been valuations on the public market side have been astronomical. and we've been very careful with regards to how we've been playing the public markets. We've been a lot more aggressive on the private markets where he's making significant returns and we're continuing to see those returns. >> I'm not saying you've been bearish, but you sound like you're kind of ready to take the cautiously >> off the table at this point. >> Yeah, look, I think we are now moving to midcycle, which is typically the area that we perform the best. higher quality type of names, more sustainability, more discerning markets as opposed to kind of chasing those early cycle names really looking in and saying buying higher quality types of names where you can see that sustainability >> midcycle. >> Yes. >> So the early cycle kind of industrials, energy, financials, an area that we do like which hasn't really done well up about 6%. >> Did you know that financials are about to get their 10th straight week of gains? >> Yes. >> Longest since like ' 89. >> Yeah. >> It's kind of been stealthy. Yeah, because it's only up about 6% year-to date. And importantly, you mentioned software before looking at IGV. IGV basically did nothing last year was up about 5% down 6% this year. What are the top five names? Two of them are cyber security names. The other more discerning hyperscalers performing during the equity situation. Nice thing about the hyperscalers, they are the enablers, but they are also the adopters with regards to AI. What's going to happen now and what we saw in earnings and in the market performance is the market being discerning who are the guys that are actually using that capital and seeing results from it. >> So, so you think the sentiment indicators like the one I read from from BFA uh are are justified in revealing how bullish people actually are? >> I believe I believe look I think I think it's it's you've got deregulation big beautiful bill stock market continuing to do well. I think the big concerns is obviously the issues around inflation, right? So you're in a situation the number one thing that consumers are focused in on. You mentioned we've talked a little bit about the Fed. One thing that we haven't talked about is this inflation problem. It's a supply side issue and the Fed is really focused in on demand side issues. I don't know how much wars can do with regards to controlling oil prices and that feeding back into the rest of the economy. So there's part of a reason why I think he's not talking as much about doing something is because I think he's worried about signaling to the market and the fact that it's not necessarily going to have the impact the market wants. >> When you're that bullish, you send like 30 pages of notes. My goodness. >> That's right, >> man. Save a tree. >> You get paid by the word. [laughter] >> It's good to see you. Have a good day. It's Chris Tum. >> All right, we're now in the closing bell market zone. MJP Wells Brian Bendy here to break down these crucial moments of the trading day. Plus Oliver Renick is at the SIBO Global Markets in Chicago with some options action again. And Pippa Stevens is on the breakout in the medals. Oliver, what do you see? >> Affirmations. Scott, market bulls getting a big breakout this week, not just in the S&P 500, but record options volume and call buying and zero DTE trading on Tuesday here at SIBO. When one trader said the intensity of the buying sounded like what it used to be, he's referring to when this floor was packed with thousands, but that was the conviction here this week as options volumes exploded in earnings winners like Palunteer and Microchip and the VIX broke 15 to the lowest since the first week of January. Traders love to see consolidation after big gains. That's what we got yesterday. It's what we're getting today. And now bulls are rolling S&P strikes up to 775 in SPY in the near term, 785 in the long term. That's where we see the most open interest. Scott, >> all right, good stuff as always. Good weekend to you, Oliver Renick. Thanks, Pippa. How about these medals? >> That's right, Scott. So, the medals are shining this week, including gold, up 7% for its best week since January. Now pushing into the green for the year after the weaker than expected jobs report is curbing expectations for a rate hike. The move pushing up the GDX with Net Davis Research noting 90% of the fund now above the 50-day up from just 21% at the start of the month. Though sentiment does remain pessimistic and the IAU has seen outflows pointing to central bank or hedge fund buying supporting gold's recent leg higher. Copper just shy of yesterday's record high with the recent run underpinned by expectations of additional US copper tariffs which pulled forward demand as traders look to benefit from COX Lme arbitrage. Silver adding nearly 10% on the week, closing above its 50-day for the first time in more than two months with platinum and palladium also sharply higher on the week. Scott. >> All right, Pippa Stevens, thank you so much for that. Brian, we're going to get another record close on the S&P 500. 7736 is the old. You see what we're doing here? So, it looks like it's going to happen yet again. What does that tell you about where this market's going? I think the market likes the fact that earnings is there to stabilize us. Uh and we got a relief rally, Scott, as you know, the start of the week. But at the end of the day, this jobs report told us that one report I don't think really changes much for the Fed. And with tech stocks rallying today on lower interest rates, uh it's really a a move saying we got a little bit more time uh to assess what the Fed's going to do with with uh rates at the end of September. So next week CPI is going to be a big number. I think that's going to move the market and a lot of investors going to be paying attention to that inflation story Scott. >> But as long as earnings remain robust and they're expected to do just that, this market's on firm footing. >> I think so. I mean, the fundamental backdrop is sound. But look, I I don't like the setup from a macro as we go into the balance of the summer into the fall. We still have to get a process plan in the Middle East. We know midterms are less than 90 days away. But the nice news, Scott, is that over 70% of S&P 500 companies are trading above their 200 day moving average, and we see quality earnings across all sectors. So, we have some durability to kind of move through this this tough period of time that I think is going to be in front of us. >> Tech's back in a big way. You think that continues to lead? >> Quality earnings are there for tech, but I like the fact that healthcare, industrial financials are also playing a part. Um, I think tech today is up because interest rates are down. know capex spending is now being financed and and uh and it's not just based on free cash flow. So I think that's why we get a little bit bounce back of a of tech. Uh and also just say even at these levels we've seen that the market over the next 65 days on average going back to 1950 can still even be up another 5%. So I think uh bulls are definitely outweighing the bears but I would be cautious as we go into Jackson Hole and some tough uh seasonal uh compares uh in September. [applause] Good stuff, Brian. Appreciate it as always. Brian Bendy, they're going to clap in [applause] a new record close for the S&P 500 yet again. We'll go out. >> Hello everybody. Welcome to BlueCloud Trading. I'm George. It's Friday. It's August 7th, almost 5:20 p.m. Eastern time as I'm recording this video. And we just saw some clips from today's episode of Closing Bell, not Halftime Report. And uh we're going to take a look at the stocks and ETFs. a good number of them, about 24 to be exact, that were discussed on the show, including palladium Palunteer um, oil K, which is the oil crude, free crude oil. Okay, that's the, uh, I'm sorry, K1 free crude oil strategy ETF. We're going to look at Tesla, Google, you name it. Uh, I've already organized these and we'll also take a look at the indices, the SPY, the Dow, the Russell, and we also have a stock here, AIRJ is the ticker symbol. I think you're going to want to stick around for that. That's going to be an interesting one. It's doing really well right now. So, let's get started first with the first stock here. Airbnb. And before I do that, actually, let me do one more thing. Let me show you guys what happened today. Right, the S&P 500, it rises to record close and post strongest week since April. This is some good news, right? The Dow jumps more than 250 points for record close and fifth winning. Wh Josh Brown doesn't want to leave the the channel here. Uh what else? Uh let's see. The NASDAQ was up. So, let's take a look at the indices real quick. Dow was up. 28 by the end of the day. The Nasdaq was up 1.30% 30% gapped up and continued to move up. S&P 500 gapped up, moved up 62% today and the Russell 2000 was up 1.11%. It was a really bullish day. We look at the heat map here and what we'll see is um a lot of the stocks especially in technology like Nvidia, Broadcom, a lot of the semiconductors did well. The only two stocks that did not do so well Micron which was only down44% and AMD down 1.21. A lot of the uh software infrastructure stocks did well except for the ones that you see right here. And then uh let's see what else. It looks like Tesla was up 2.83%. A lot of the healthcare stocks did well, but energy stocks were down today mostly. And basic materials did really well today as well. Let's look at the groups. That's going to show us the uh sectors, right? How the one day performance was for today. Basic materials was actually the leader today. Up 2.71% followed by industrials. Then consumer cyclical technology and healthcare and energy was down 1.09. We looking looking at the oneweek performance. You can see basic materials and technology. Whoops, I just uh punched that by accident. Basic materials and technology were the top uh performers. Utilities, energy were not were the bottom for the one-mon performance. Basic materials up 9%. Energy, financials, consumer cyclical, technology all bullish. utilities, communication services, not so much. So, uh, let's go ahead and get started here. We're going to start off with Airbnb because it was up 17.43%. It jumped, it gapped up, it moved, got above this 16393 level. Here's an interesting fact. This level was already here. Uh, if I highlight it, you'll see that I created that back on July 28th, okay 2026. What's that based on? Why? Why is it even there that 16393? Well, let's switch it to a weekly chart and let's go back in time a little bit. There we go. Okay, it's based on this candle. This is where technical analysis is very um unique and interesting because there are other people watching these exact same levels. And you know, this is going back to February 14th of 2025 to be exact. You can see how price for those two this is again a weekly chart for those two weeks it stalled there and then dropped. So that was the highest level that it reached 16393. We've been following that. If we go back further okay back to this level that's actually 17010. That's the next level where we may see some resistance now. So let's go back to where we currently are. Guess what? We broke through both of those levels. All right. Airbnb is now doing [clears throat] really really well. Uh it I'm in my opinion it's probably gonna try to test the all-time highs at this point because of where we're at. And so let me go ahead and throw that level up there for you. Um it's around 21954. Let's color it purple because it is more of a monthly type level. All right, let me switch it to a monthly chart so you can see. All right, so that's what I'd be watching very closely. How far are we from that level? We're about almost 20% away. So, Airbnb is looking really good here. I like the pattern that's also formed here. Uh what's happened essentially is we've got ourselves a higher low from the prior one on the monthly chart. We also broke through this prior high here. Okay, so that's really important. And uh so let's see what happens with Airbnb. I like it. And and and by the way, it also meets all the criteria that we're looking for with the Ichimoku indicator. All right, that's what we're using here. If you're not familiar with this indicator, it's really simple. We're just looking for price here to be above moving averages. The cloud itself, if it's above, that's bullish. If price is above the green line and the red line, that's bullish. The green line is the 9 period. The red line is the 26 period. Okay? The chica span is the white line that you see right there. That's the lagging line. If that white line is above the candle 26 periods ago, that's also bullish. So, you have everything in order here. Airbnb looks good on the weekly and it looks good on the daily. Same thing. So, it gets a blue flag. All right. There's basically just these um how many are there? Five. Five out of 24 that meet the criteria that I'm looking for in stocks and ETFs because I'm looking for both weekly the weekly and the daily time frame to tell me the same story. I want that long-term uh trend line, I'm sorry, long-term trend to be strong as well as the new as the daily charts. Okay, really important. The weekly and daily confirm each other. All right, so let's take a look at XLB which has become bullish recently. That's the materials ETF. We just talked about that. Here's a weekly chart. This week, we broke above the 9 period. It's looking very bullish here. I like what I'm seeing now. it is going to find some resistance this particular ETF right around the high there 5414. So that's a level that I'd be watching. It's a weekly level. And how far are we from that level? We're about 2.83%. So once it also breaks that level, I think that's going to be really significant. Um here's the daily chart for XLB. I like it. XLF, the financials ETF here looks good. Looks good in the daily. It's been pulling back a little down.36% but it's holding up above that tenkinson the 9 period. What about the weekly chart? Same thing. It's holding up above these levels of 5694. It's at 5760 right now. So I like XLF. I like industrials. The XLI ETF looks good. Here it is on the weekly chart holding above the 17930 level based on this prior high from March 6th. on the daily chart it's pulled back slightly. Okay, but it was actually up 23%. You see the little gap up right there. So, there's a higher probability it's right next week it will go up. We'll just keep an eye on that. XLV is another ETF I like here. Um the it's for the healthcare select sector spider. And you can see here on the daily chart it got above the 9 period on the weekly chart. It's also looking pretty strong. Still has not gotten um let's see here. This is an old level here, folks. I got to get rid of that. It seem in a way it's kind of building a base is what what I call it. Uh so you see the box that's that's forming right here. And so in my opinion, it needs to get above the high there of that specific candle of 16853. But this is very bullish at this point. I like healthcare. I think this is a good one. Here's a daily chart. Okay, let's take a look at copper. COPX. Now, this is the copper miners ETF and uh on the daily chart. As you can see, it's uh looking more and more bullish because the last 3 days we broke above the Ichimoku cloud. When that happens, that's very bullish. All right, we we're probably going to see a continuation. There are a few things that aren't in place, though. The cloud itself is still bearish. Single span A is still under single span B. And if we if we look at the weekly chart, uh the faster moving average is under the slow one. But overall, I'm liking what I'm seeing. We are also coming close to some resistance here. That trend line right there. GDX is the gold miners ETF up 7.05% today. This is the weekly chart. So, last week you can see here closed under the cloud, but it was holding. All right. It was holding for the most part uh holding up. Here's a daily chart. And today was a big day. It gapped up. I not I mentioned how there's more and more volume coming in here. I mentioned yesterday the ADX is moving up. The green line is moving up. The red line is moving down. This is conducive to a uh possible um you know breakout here. Let me see what the level here is. The high of this candle on the daily is 89.99. We're just under it by 10 cents. Okay. So, if it gets above that level, too. I think that's going to be really interesting to see. Uh, I like GDX, Google. I mean, again, it's not uh it's turned bullish on the daily, but the weekly chart is not quite there yet. Just keep that in mind. So, I personally wouldn't be adding new positions here. If you have positions though already established in your portfolio in gold, you know, you got to let this thing run its course now. It's it's looking strong. Let's look at Google. Here it is on the weekly chart. It's above the moving averages. It's above the cloud. Okay, so this is looking good on the weekly. But what about the daily? On the daily, not so much. It's pulled back three days. It's under the cloud right now. It's just not as bullish. It was down 0.96. IGV, the software index fund on the daily chart is above the cloud. Uh the the cloud is still bearish though. Sync spin A, which is that light colored blue line, is still under the purple line. We want it to be above like it was here. Uh let's look at the weekly chart for IGV. See how it's still bearish here, too. Even though price broke through, it's going to take a little while for this trend to really prove itself. And we're not there yet. Meta bearish cloud future cloud here in the weekly. I'd stay out of that one. Microsoft, same thing. Now, it broke through the cloud. If you switch it to a daily chart, it's going to look a lot more bullish. You can certainly trade this on a daily chart. Um, but just keep that in keep in mind that you're, you know, it's not going to be a really high probability trade, especially since price has gotten so far away from the moving averages. Okay, that's a big distance right there. It's more than likely to pull back. Uh, MTUM is the momentum factor ETF. And here it is in the daily chart. It's currently inside the cloud. On the weekly chart, it is looking like it wants to break above here next week possibly, but we're not there yet. And then Nvidia on the weekly chart broke this trend line. So that's huge. Here's a daily chart. Okay, I'm liking Nvidia a lot more. Uh the only problem is the cloud the daily cloud is still bearish, but you know again um I like I like the direction of Nvidia right now. This is not a bad one to start thinking about. Oil K has pulled back down 40%. It's still onto the cloud. Let's look at the the weekly chart. Okay. Under the moving averages, palladium. So, of course, it's the news. It's the geopolitical situation in Iran that's going to fluctuate. You know, it's really hard to determine at this point uh where we're where oil prices are heading to be honest. I mean, I I it can really jump significantly to the upside or even drop significantly. It's it's a very uh I don't know. It's just up in the air still in my opinion. Now, palladium did have a nice move here. Um you can see this week. It did quite well. It actually moved up as a as a metal up 10 over 10%. For the week on the daily chart here, we broke above the cloud. The cloud turned bullish. Um but the weekly on the weekly chart, we're still under the cloud. So on a positive note, it did break through a trend line on the weekly. So if we take this high here, we take that high right there, we extend that out, you can see the breakout here. Okay, PLTM, that's platinum. That's the ticker symbol for platinum shares. This [clears throat] also, it appears, let me just double check. If I take this high here and draw that trend line all the way across, oh, it's still under it. It's also still under the cloud on the weekly. On the daily chart, though, it's re-entered the cloud. So, I wouldn't be shorting this. Let's put it that way. That's that's why you want to look at both time frames so that you have a a better idea because we broke that consolidation box here for palladium from for platinum, sorry. And it's more likely to continue to the upside. Um PLTR is um Palanteer and you can see here on the daily chart, it's looking very bullish. It pulled back right to the 200 day yesterday. We had a reversal candle and then popped again. Here's the weekly chart. Breaking above the cloud, but the future cloud is still bearish. So, not perfect. Sweet green, you know, that restaurant serves a lot of salads. Okay, it's been pulling back. It's under the cloud right now on the weekly and on the daily chart still looking pretty bearish. We did get a bullish reversal candle, a hammer, but um [clears throat] it's uh it's in a depressed decline here. I would not be adding positions here on this one. SpaceX. Uh I've been following this more on a 30-inut chart since it's a relatively new stock and there's not enough data to review the weekly charts yet. So SpaceX uh has had a nice move up. It broke through the cloud here on um Friday at 10:00 a.m. and it's moved up 10.59%. So it's up 15.83 for the whole day. Uh but if you look at the daily chart, it's still under that 200 I'm sorry, it's still under the 26 period. That's the red line and it's still under the cloud. Team TE AM is [clears throat] the ticker symbol for Atlassian Corporation. They brought that up briefly on the show. Um it had a big jump 35.31% today. Look at that big gap up on the daily chart. Uh you can see how it was above the 200 day right there for about 3 days or so and then boom, it gapped up. And then let's look at the weekly. Here's the weekly chart. It's re-entered the cloud. It does have resistance though, the 200 and the cloud itself. So, keep that in mind. But it is obviously starting to uh become more and more bullish. It broke this level. We've got a higher low right there. That's really important to to keep in mind. What about Tesla? Tesla has pulled back, but it was up 2.83% on the weekly. You can see that reversal taking place right there. Let's look at the daily. [clears throat] Okay, so it's kind of building like almost like a cup and handle type pattern, but the problem is we are still under 33724 that prior low. We're also onto the cloud. I I wouldn't be adding positions here yet. This could certainly, you know, be a very short-lived situation. You know, you don't know for sure. Uh Unity Software was up 5.39%. Broke through this above the 4093 level and so it's still moving up. Let's look at the weekly chart. The cloud is still bearish though, but it's in uh it's the trajectory is positive for Unity Software. UNNG, they talked about natural gas briefly, right? And uh it's still in a decline. So even though it was up 1.14%, you're looking at this weekly chart, it's still it's still not looking positive here. You look at the daily, it a small move up. I would stay out of this ETF for the time being. XLE, the energy ETF, um, has pulled back but found support right at the cloud on the daily. And here's the weekly chart. Still under that trend line. Let's look at the indices very quickly here. SPY broke this box this week after multiple weeks and months now because this months here, right? This is going back to April. Uh, we're finally through the 76040 level. What this means is, you know, it's um hopefully more upside. Okay, this is a a very important event that took place this week. The directional movement index became bullish. The green line crossed above the red line. What about the daily chart? Here's a daily. There it is. So, it was a little couple of days where we had a couple of red candles, but today, boom, up 61%. So, I like the spy. And guess what? Got a blue flag again. DIA ETF is for the Dow Jones. That's also looking bullish here on the daily and on the weekly. Okay. Also broke through a uh trend line right there. Do you see that high? Boom. So the last four days it was under that level. Friday's uh I'm sorry, four weeks. It's been a little while now. It's been consolidating here. But this week it broke above those highs. So that's important. There's a daily chart. Uh Russell 2000 also looks kind of interesting here because the uh chu span the white line crossed above the closing price of that candle. The tenants and keyun the 9 period and 26 are at the same exact level. So I'm still giving this the benefit benefit of the doubt. It's more than likely to break through this 302 um 72 level these highs. So next week I'd be watching that closely. FE the Euro stocks is still looking pretty bullish on the daily chart. Even though we did get a reversal type candle here, it gapped up and can and so it was at 0.9%. It's overall I like what I'm seeing on the W daily and on the weekly we also remained above that 70 52. So the Euro stocks 50 look very bullish. All right to our for our European friends. QQQ look at that trend line broken um daily chart above the cloud. So the Q's are looking more and more bullish. The problem is the cloud itself still bearish for the cues because so much damage was created from the decline that it's going to take a little while for this to basically clear you know and uh prove itself still. The ADX is still dropping, meaning there's no not enough momentum here yet for the cues to take off. And we're still under that trend line. The VIX dropped another 1.85% down to 14.9. That's very conducive to a strong market. When the volatility is dropping, okay, when this VIX is dropping, that's very bullish for the markets. And so, we want to see that dropping uh as it did. GLD up 2.26%. 26%. Now, uh I mentioned yesterday that I was becoming more and more optimistic about gold because it broke through this box and see this is what happens. Momentum starts to take place, right? Look at the ADX. It's starting to move up. Look at the green line moving up. The red line moving down. Let me zoom in so you can see that better. Okay, it entered the cloud. That's a bullish sign. Stayed inside. It gapped up some more. Where did it find resistance though? at this prior. We got to go back to this level all the way back to March 24th, 2026. So, that trend line was already there. I created that back on May 27th. Isn't it interesting once again that we stalled at that level, I think. So, so make sure that you guys learn how to draw these trend lines properly. It's really important. watch my videos and uh hopefully this will be more uh it'll be very beneficial to your trading. Silver SLV under the cloud still. And by the way guys, one more thing that you can do before I continue here is you can become a member by hitting the join button and you get access to these member only videos that are exclusive to members. And to to get access to those, you click the join button. You select BlueCloud Trader. You can still support me by hitting BlueCloud supporter. All right? But you won't get access to those videos there. You do need to select this first and then hit join. If you want to get daily trade updates, though, so this these videos come out once a week. If you want to get and you'll get access to all of them, all prior videos as well by by doing that. Um, that's a small amount of money for the the amount of videos that you'll have access to. BlueCloud Legend. Become a Blue Cloud Legend level member. You'll get even more videos, including some of my day trading videos. You'll also get daily stock and ETF trade updates. So, choose your level. And if you want to support the channel, don't forget to hit the subscribe button, the like button, the notification bell. You can even hype this video. There's so many things you can do. You can share it with people. So many things you can do. Okay. Um and uh let's see where let's go back to the silver because silver did gap up above above the box today. A bullish sign for silver, but it did stay right under that cloud. So it was up 2.95%. As I've mentioned, I'm more bullish with gold because that one's already, you know, taking off. Uh silver is now starting to basically follow gold. All right. What else? Oh yeah, AirJ. Let's take a look at this stock from one of our members. They requested this one. I had to do a little research about Airy Technologies because it's a small company. All right, their capitalization is just $382.6 million, but the technicals are great on this one right now. Um, the cloud itself, you'll notice, just turn bullish. The central span A just crossed above the cent span B. And this is a lowpriced stock. So there's a lot of volatility that comes with a beta of 2.01. It moves about twice the amount of the S&P 500 generally and maybe even more because it's a lowpriced stock. It was up 5.9% today. But I like what I'm seeing here. Uh the cloud itself has turned bullish. The future cloud. Um price broke and closed above the cloud on the weekly chart. The only uh resistance I'm seeing here right now is this 675 level. I'm seeing the 200 day moving average. All right. And so let's look at the daily chart for more for more information. By the way, check out all the volume here. There's a lot more uh interest in this stock as of May of this year. And notice how the green line crossed above the red line on that specific date. And we started seeing this higher low here from the prior one. And so if we can break above this level right here and the 675. I think that's going to be really important. So again, let's look at the daily chart. So there you have it. A future cloud that's turning bullish. We are getting a couple of reversal candles, but this almost looks a little bit more like a bull flag type pattern. So there's the the flag right there. Okay. So we'll see or penant type pattern. We'll see what happens there. Uh let's take a look a little bit deeper though into this company Andrew Technologies. And we can do that by going to Finn Viz. All right. What was the ticker symbol again? Let's go back. That was error J. Okay. So we're going to type that in here. And let's zoom out. That's like really Oops. There we go. Okay. So, here's a chart on Finn Viz Elite. By the way, this software and this software here whoops the TC2000, you can get access to these through my site. Go to 10 more links right here. Scroll down. There's the $25 coupon for TC2000. Click on this link here to get access to the software. Uh Finn Viz Elite, click this link as well. If you want to check out my Twitter page, click this one here. There's a bunch of links that you can check out. But let's go back folks to AirJ. All right. Now, what we're looking at down below here are some of the earnings announcements. Okay. um the last couple. All right, you can see here negative, but the price is still moving up. What's causing that? Interest, right? The performance year to date, it's up 50.25%. It's actually up 105.2% for in the last 6 months. Up 40% for the week. Um let's see what else we get. We got a lot of um analysts rating a buy on this one. They're they're looking at price targets from $7 all the way to $12. What else? If I scroll down a little further, I didn't know anything about this company, so I I thought, hey, let me check it out. Let's see what they do. They operate as a thermal energy and water investing technology company. It provides efficient and sustainable air conditioning and pure water from air through its transformational Asly technology. The company was founded March 14th, 2024 and is headquartered in Ronin Montana. So, let's check out the website because I was looking at that as well. I found it kind of interesting. They've partnered with some big names. Um so what this company does essentially look at this water security harvest atmospheric moisture to produce clean safe water recovery produce and recover water for industrial processes data centers. Now this was the the the interesting part. You can leverage waste heat to produce on-site water and improve sustainability. I clicked on that. You can see here like there's a white paper there as well. Um, data centers produce large amounts of heat that require cooling solutions to maintain temperatures to optimize performance and profitability. Air can convert waste heat from data center operations, convert it into distilled water that can be used to further improve the data center cooling. Very interesting stuff. Now, um, and uh, they also got an innovation, what was this? Um, innovation hub for data centers. NetZero cooling next generation data centers. Google, Microsoft, you can see the big names there. Read more. Uh they were selected as a winner of net zero innovation hub competition and invited to collaborate with Google, Microsoft and other industry leaders on water sustainable data centers. This is going to be huge with AI and everything. They're all looking for efficient ways to cool those systems down and this could be an interesting one. So, you know, it's looking kind of in my it's it's the type of company that I'm interested in as far as companies that are innovative like um I also like a company called Boxable. I talked about that recently. Um that builds tiny homes uh out of Las Vegas and they they just went public as well and I'm an investor in that company, but um I'll have to take a look a closer look at this one. So anyway guys, uh that's going to do it for this video. I hope you enjoyed this video. Hit that like button, subscribe. Hope you all have a great weekend. I'll be putting out another membersonly video tomorrow, a nice fresh one. I'm going to be creating a new list of new stocks. All right, usually over 20 new stock ideas for the coming week, okay, the upcoming week. Uh we're going to look at the strongest sectors and industries right now. uh so that we have a better more basically you know higher probability um trades for next week. Okay, I'll I'll catch you guys all in the next one. [music] The ichimoku guiding light. Blue cloud trading [music and singing] through the night. >> [music] [music]

Comments 0
Sign in to join the discussion.
Sign inNo comments yet. Be the first to share your thoughts!