I would look at any opportunity, okay, to the upside to enter into the bearish position. ... I'm going to buy the 800 puts and sell the 790 puts against it.
Context
Don Kaufman on Caterpillar: "I would look at any opportunity, okay, to the upside to enter into the bearish position. ... I'm going to buy the 800 puts and sell the 790 puts against it."
I'm going to go SE 18. Sep 18 options expiration giving us basically about a month. I'm going to buy the 110 calls. Again, buying the 110 calls, selling the 115 calls against it.
Context
Don Kaufman on Starbucks: "I'm going to go SE 18. Sep 18 options expiration giving us basically about a month. I'm going to buy the 110 calls. Again, buying the 110 calls, selling the 115 calls against it."
I'm going to go after an O16 trade again. October 16. Going to buy the 90 puts. Again, buying the 90 puts, selling the 80 puts against it.
Context
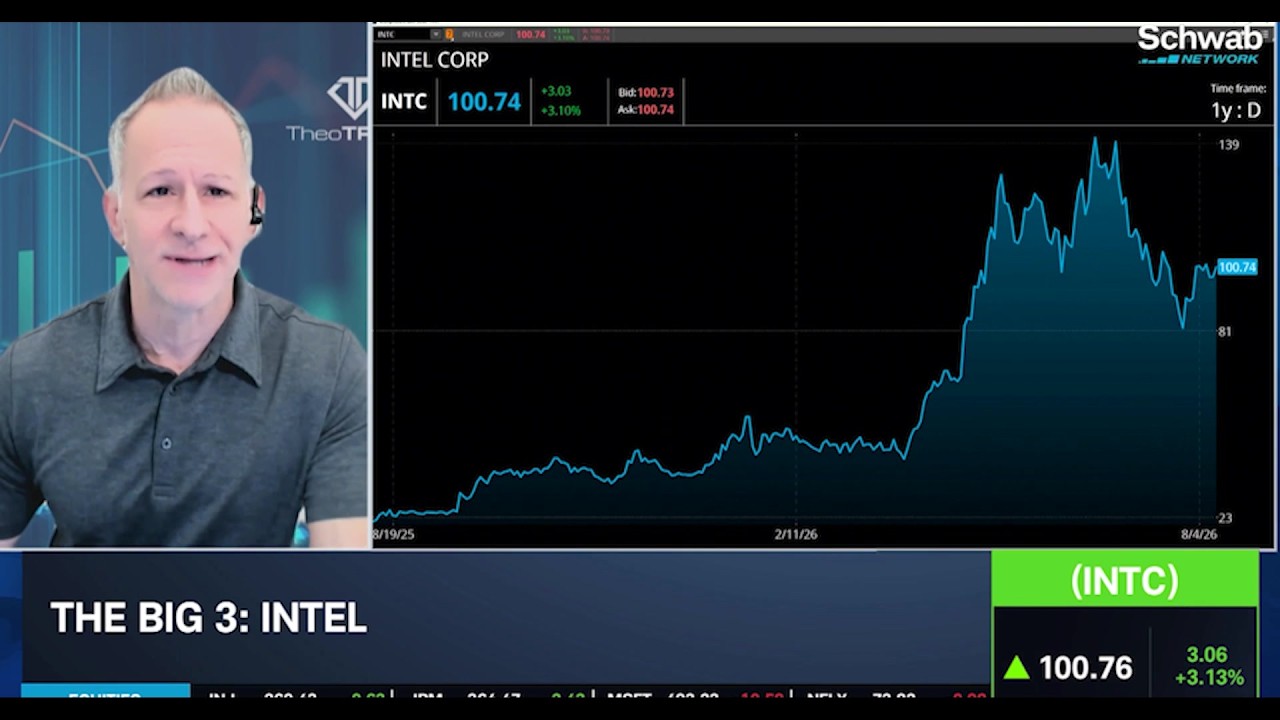
Don Kaufman on Intel: "I'm going to go after an O16 trade again. October 16. Going to buy the 90 puts. Again, buying the 90 puts, selling the 80 puts against it."
Full Transcript
Welcome back to Trading 360. I'm Marley Kaden. It's time for the big three. We've got three stocks, three charts, and three trades for you. Rick Dat will be taking us through the charts. Here to take us through the trades today, Don Kaufman, the co-founder of Theo Trade. Great to have you both on. Don would love to kick it off with your thoughts on this inline inflation data we got this morning and the reaction that we're seeing to it. >> Yeah, you know, uh CPI really did not have the impact uh to the marketplace I think that most expected. Look, uh, right now what really matters, look at the amount of capital coming into this marketplace, whether it's Nvidia taking in, you know, a cool what, half a trillion dollars, Intel going out there and grabbing another 20 billion. It just does not stop. Talk obviously of anthropic going IPO. Who needs CPI right now, right? So inflation relatively in line. S&Ps right now to me aren't the big concern. I'm looking more at the bond market. the bond market is kind of saying, "Look, we're going to take care of inflation if the Fed doesn't." >> And so then we have Intel in your big three, but we're not going to start with them. I want to start with Caterpillar as your first pick here. A very interesting one in Caterpillar in that it's sort of thought now as a part of the AI trade, not necessarily a primarily construction company anymore. So, how are you looking at Caterpillar? >> Yeah. No, I actually agree with that. In fact, uh the Caterpillar and Intel trade are very very similar. And uh that is respect to the fact that uh we're going to take a look in just a moment here at the Caterpillar trend. That trend in the most uh recent few weeks is most definitively to the downside. And who am I to stand in the way of a of a nice downtrend here peaking at about 1073 pulling back into the 800 level. It's got a nice what we term bid underneath it right now. So Caterpillar goes through earnings, the stock rallies, but it's fading again. And I would look at any opportunity, okay, to the upside to enter into the bearish position. My bearish position though, it's not in the here and now. I'm going to give it some time. I'm going to go all the way out to the October 16th options expiration, and I'm going to buy the 800 puts and sell the 790 puts against it. So, it's a full $10 wide put spread done for a $3 debit. And I have really strategically selected the strikes here, not just based on delta, which is what I would typically look at, but I think we're actually going to crest under 800. You got to give yourself some time for this, but uh that near-term trend right now is is down, and I I just don't want to uh I don't want to fight it. >> All right, so carefully selected 8790 strikes here, Rick, as you look at the chart, do those numbers stand out to you to the downside? >> So 800 indeed stands out right here. That was about where we had our low point before earnings roughly speaking here. But really quite an interesting chart for many reasons. First is that we had a sideways rangebound period here after our earnings event in April giving us a floor near 850, a ceiling near 933. We trended upward. We hit those highs Don mentioned. Then a downward sloping channel type shape here between our two blue lines gave us this uh kind of collapse here in share prices that took us all the way down to 776 here. That's a notable relevant low point here. So then we had a gap up on earnings. We topped out right around that same ceiling I mentioned earlier. Now we also find ourselves at a supportive area in our old previous floor near 850. So the question now is if you did have more of a bearish outlook, you could say, well, we're kind of trending lower here still. We've we've just had a sea of red candles recently. We have not really managed to recover after our earnings event. Uh we did also fill this gap level here. So kind of an interesting situation has developed there. So if you did have a bearish outlook, you'd be looking for a breakdown below those recent lows. If you had more of a bullish outlook, you'd be looking for a push back above that ceiling near 933. That has thus far remained pretty uh resilient here. So when we uh next advance our chart, our moving average picture in this case shows our faster moving averages are below our slower ones in terms of our three shorter term moving averages. 5day, 21day, 63-day. They're all relatively close together. Our blue 5-day is uh near about 851 or so. It lines up with our short-term trend line. Meanwhile, our 251 day down here 72284 representing one year. RSI trending higher, but not really making uh new relative highs or anything recently. Here we also remain below that 50 midline despite making our way out of that brief foray into the oversold region. Finally, our volume profile study shows that we have a significant node here that we are starting to enter between about 860 to 9:15 roughly. That stands out as a heavy trading concentration area. We also have one down here 750 to 775. One to the upside as well, 975 to 10,000. >> All right, as we look at Caterpillar right now, we are up more than 2% on the session at 86177. Don, I want to move to your second one here at Starbucks who's showing quite a bit more progress in the turnaround plan or its return to its original strategy. Is anyone expected in its most recent earnings report? So, how are you looking at Starbucks and the momentum it has going right now? >> Yeah, the irony is that's exactly what I was going to uh discuss over here is uh Brian the Burrito Nickel has uh possibly done it again. For those of you that have no uh no idea what I'm referencing over here, it's Brian Nickel, the current CEO of Starbucks. uh having a long history of uh kind of rebounds. Taco Bell, whether it was Chipotle or should we call him guacamole, Brian, he survived the guacamole crisis several years ago only to turn around now Starbucks. And I got to tell you, it looks poised to break into some new territory. Now, look, the uh the all-time high in Starbucks about the 117 level. I get it. I got it. I'm looking at that right now. But this this kind of 104 108 region that it's currently channeling in, it looks like it's actually building up coiled and ready to actually break to the upside. And uh that's exactly the way I'm actually going to trade it is, you know, for if you will the uh that break to the uh to the upside. Nevertheless, I'm going to go and do this a little shorter duration because I think that we're right kind of on the cusp of that break. And the real signal of the break to the upside's hitting the 109 110 kind of region in here, right? So, I'm going to go SE 18. Sep 18 options expiration giving us basically about a month. I'm going to buy the 110 calls. Again, buying the 110 calls, selling the 115 calls against it. So, it's a $5 wide bullish call spread. Again, we're on the buy side of the call spread. This one's done for a$120 debit. So, it's a nice risk-to-reward like ratio as well. So, you're risking a buck 20. The upside is about 380. But you're going to need the stock to appreciate very close to or at all-time highs, which is right in and around, as we're going to see here momentarily, that 117 level. >> Yeah. And we're we're very close to those high levels right now, Rick, as we look at the setup for Starbucks. Got a very nice pop off of its recent earnings report and the prog the unexpected progress under Brian Nichols. So, what are you seeing in the technical setup? Yeah. So 109 1110 that's the level I highlighted here with our red line representing these double top type highs. In the shorter term we have seen a downward sloping trend line that you could draw going across these recent highs. We are on the verge of verge of pushing out to the upside from that area. You could also draw a corresponding high going across these lows. Put them together that gives us more of a triangular shape here. a period of time where we are seeing price activity compressing in an increasingly narrowing range. So low volatility can often be a precursor to higher volatility when you do eventually get one of those breakout situations happening beyond these two trend lines. So because we are so close to these highs, that could be a pretty interesting recipe for an upside breakout. Certainly not saying that's going to happen. Just pointing out what I see as a a prominent resistance area that's not too far above a a pattern that we uh have seen developing here. In terms of low areas to watch, 102 was kind of a triple bottom type here that we established in the shorter term. Another notable relative low near 100 on an intraday basis. Another one here near about 99. So now to consider our moving averages, we have a different situation from our last chart. Our faster ones are above the slower ones. They are diverging apart from each other in the shorter term. Our closest one is our 5day near 106. That's about where we had our lows today so far. So, uh, keep that in mind. Also, if we do start to move lower, our 21day comes in at 105. That could be a supportive area. So, RSI is also giving us an interesting signal here because we are above the 50 midline and RSI is breaking above its own trend line here before price. So price is always the one that's more important here. But this is an interesting piece of information because the momentum is starting to show signs of a breakout uh ahead of the price activity here. So look for price to break above its relative highs and for RSI to follow suit going forward. 103 to 106 stands out as the volume node that's closest to our current activity. Another one here 95 to 98 lining up with some of these recent lows that we saw. >> All right. And right now as we look at Starbucks, up a half a percent on the session, but year to date up about 27%. Our next name, Intel here, uh had its best revenue growth in 15 years, I think, in its most recent report. Don, you just mentioned they're looking to raise another $20 billion. I the the the raise has never seemed to end in terms of how much money people need right now to fulfill all of these AI needs. But how are you looking at Intel? it. You know what? The amount of capital being raised right now, it's endless. It's it's incredible. I mean, you know, you think Nvidia is large at half a trillion dollars, which is really a lending facility, but in this particular case, instead of buying back your stock, no, well, Intel's out there selling it, which I I actually kind of appreciate. And I think that more people should pay attention to when firms are doing secondary offerings like this. Google did a secondary offering, you know, a few weeks back uh to the amount of over 80 almost $85 billion and then and then did more bond offerings on top of it. I think you're going to see the same of Intel. Intel was offering 15 billion uh for sale. They ended up doing 20 billion for sale. It had like really a marginal impact though on the uh on the shares. And at this point in time, like again, you're, you know, diluting shareholder value and so forth. I'd push all of that aside. It's a mad dash for cash. The question you have to ask yourself is, is this mad dash for cash? Is this the end of it? Are they looking at this and saying like this is our lifeline? Like, we better bring in some cash right now. That's why we're actually selling stock. Everybody needs to ask themselves that in the semiconductors and everybody needs to ask themselves that in the entire AI kind of sector. Now, my trade less about that. My trade is much more about very simply trend is your friend in this particular case. And the semiconductors to me they're on the dance floor for more downside activity whether you're looking at like AMD which really hasn't had that much of an impact or you know you're looking at Micron more memory but there is a downtrend still in the SMH which is the uh the semiconductor ETF as well. I'm just going to trade into it. So Intel okay again semis are on the dance floor for more downside activity. I'm going to go after an O16 trade again. October 16. Going to buy the 90 puts. Again, buying the 90 puts, selling the 80 puts against it. This one is done for a $330 debit. Not that dramatic of a move for uh for Intel to see, you know, the uh you know the 8085 level again and that would see degrees of profitability for us. >> All right, Rick. So, as we look at Intel, it is trading 3% higher right now. But are you seeing in the technical setup the potential for us to make another move down towards those $80 levels? >> If we were to make a move down there, $80 really stands out. The reason why it was a low point that we saw after a gap to the upside, that's our green line here. So, uh 80 to uh uh 90 or so roughly kind of like this area or so. So, we can see that our gap also began near the 69 level here. Uh more recently, what we've seen has been a upward sloping channel in our white lines that was quite short-term and does seem to have been breached for now. We broke down to the downside within the past few sessions here. We have not really managed to recover above it. Furthermore, we have also not taken out those old highs near 104 that we established about a week ago. So, a a counterpoint perhaps, you know, I'm I'm neutral. I I look just for everything I see in the chart. If you did have more of a bullish type of outlook, you might say, well, this kind of looks like a inverted head and shoulders type shape here developing where we would have our neckline here perhaps around that 104 level based on our closing prices. This could be more of a bullish type of setup here. So, if you were to get some kind of upside move here, 108, 110, and 117 stand out as high areas that we saw in terms of potential resistance. So next we can see that our moving averages in this case are clustered together quite closely here between 99 to 101 or so. This gives us another confluence point to watch out for. We are kind of in the middle of them right now. We're not really making a clear push one way or the other at this point. We remain below our 63-day quarterly EMA. So look for a strong close above that level if you have more of a bullish outlook or for this to remain uh uh supportive or a breakdown if you see uh a bearish trade setup in in your own mind here below that 99 level. RSI not really giving us much help in this case either. We are right on the money uh near that 50 midline just a hair below it here without having a strong directional trend at this time. So uh finally we can also see uh our volume profile shows that we did have our recovery near a small node around 81 to 88 or so. Things are a little bit more muddled here. Not really a clear standout node in the area which we find ourselves now. But I would say things start to thin out pretty significantly above the the 1201 130 levels there. >> All right. Right now we are sitting at about $100 and some change up again 3% on this session but with that trade looking for a move to the downside about $20. Don really appreciate you being with us for big three today. Don Kaufman and of course Victor Ducat our lead market technician for always breaking down the technical

Comments 0
Sign in to join the discussion.
Sign inNo comments yet. Be the first to share your thoughts!