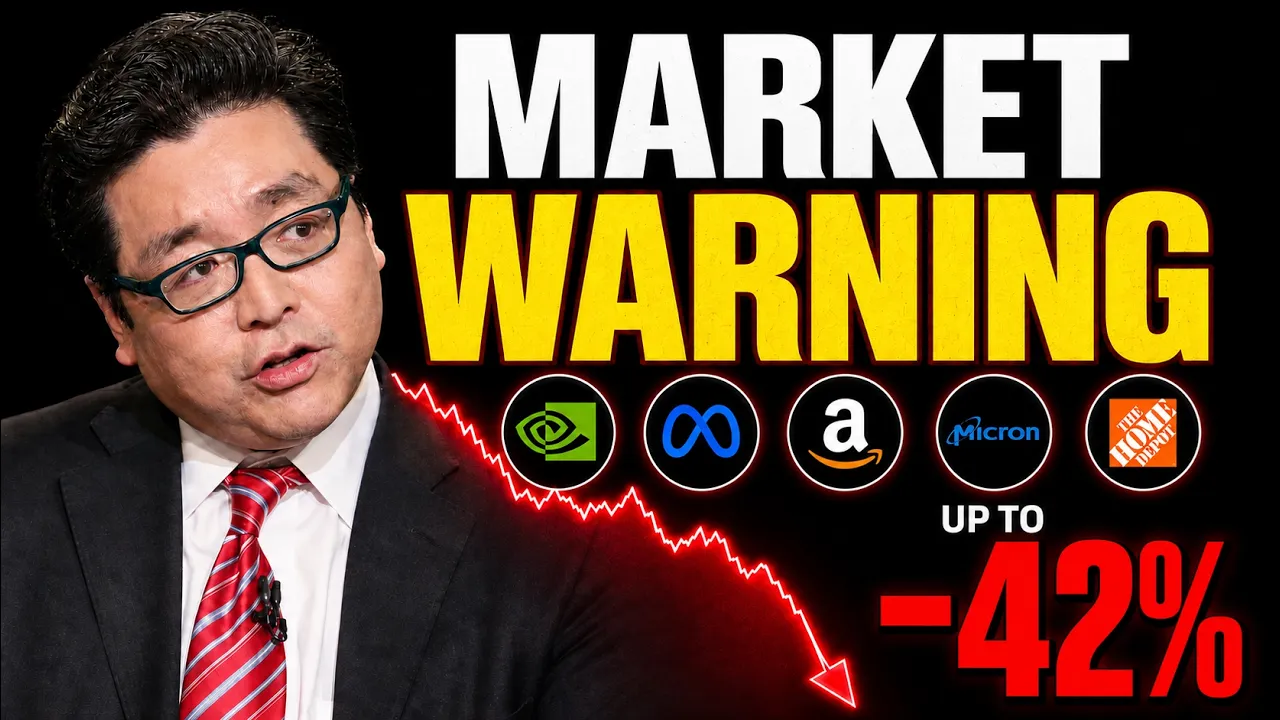
These 5 Stocks Look Cheap—Then I Changed ONE Number

- Video return
- —
- Calls
- 3
- Buy / Sell
- 3 0
- Published
Recommendations
Entry is the asset's closing price on the publication date. Current is the last close on record.
-
Entry $259.45 18 Aug 2026Current $259.45 18 Aug 2026Result +$0.00
I find it attractive at 8%, approximately fair at 9% and expensive at 10%
-
Entry $219.74 18 Aug 2026Current $219.74 18 Aug 2026Result +$0.00
my risk adjusted number one is Nvidia. It combines the best growth margins and capital efficiency in the group while still retaining some upside at 9%
-
Entry $543.67 18 Aug 2026Current $543.67 18 Aug 2026Result +$0.00
my conclusion for Meta is cautiously positive rather than blindly bullish
Full Transcript
Last week, the S&P 500 closed at a record high. Volatility was close to its lowest level of the year. Wall Street was discussing 9,000 and even 10,000. And for many investors, the only question appeared to be how quickly stocks could move higher. But underneath the index, well, in fact, the message has already become far less comfortable. Just look at today. Some of the largest technology companies are falling. Long-term interest rates are rising. And the companies funding the AI boom. They're committing amounts of capital that would have appeared almost impossible just a few years ago. And at the same time, we've got the market cycllically adjusted valuation is now close to the peak of the dot bubble. Look, doesn't automatically mean a crash is coming, but it does mean the assumptions inside every valuation, well, they matter much more than they did before. So today I'm doing something different. I've valued five companies using exactly the same cash flow forecast, but then I'm going to test each valuation at an 8% even 9, 10, even 11% discount rate. Because in fact, one of these stocks appears almost 50% undervalued at first glance. Another losses almost entire margin of safety when the discount rate moves by just one percentage point. and the supposedly safer nonAI company. Well, it produces the weakest result out of all five. But first, let's hear how bullish sentiment has become. Low volatility, aggressive targets, and a possible FOMO driven overshoot. Edard Denny had already taken his target to 8,400 for 2026. Says we're going to 10,000 or beyond by the end of the decade. The roaring 20s in full effect. Why? Because earnings are amazing. Evercore this morning. Long-term stock market trend continues to be higher. We have the potential for a FOMO driven overshoot. S&P 9000 is attainable in the next 12 months. Even if you don't overshoot on a valuation standpoint, that matters today because we're stress testing stocks amid optimism when generous assumptions can make valuation errors especially expensive. Now, the bulls may ultimately be right, but with Nvidia earnings, Jackson Hole, and a much more demanding bond market ahead, this is exactly when a valuation needs to survive more than just one optimistic assumption. Now, before we examine the five companies today, we need to separate three different questions. Is the market expensive? Are the underlining businesses still performing? And what return should investors now demand for accepting equity risk? And you can clearly see that on the first question, the answer, well, it's yes. The S&P 500 CAP, which is the sickly adjusted price to earnings ratio, well, it's above 42 compared with the all-time high of 44.2 in December 99. It tells us stocks are expensive relative to a long history of inflationadjusted earnings. But what it doesn't do, in fact, it doesn't tell us that today is identical to 99. On forward earnings, the S&P 500 is around 20 times below the rough 25 times reached in March 2000. Now, more importantly, many of today's largest companies generate enormous profits and cash flows. The excess is therefore not as simple as companies with no revenue trading at impossible valuations. The more immediate concern is complacency. The VIX more than doubled to 31 early this year that has already returned to around 14.6 six almost exactly where the year began. And you've got the fear and greed index that's back in greed. Protection is relatively inexpensive. Markets are close to record levels and aggressive year-end forecast. Well, they're becoming normal again. Meanwhile, when we look at volatility, well, the volatility skew is recently moved sharply doesn't provide a reliable market timing signal on its own that it shows that the pricing and protection is changing beneath an index that well still appears fairly calm. Then when we take a look at seasonality that also becomes less supportive as we move towards the autumn. Again, none of this proves that stocks must fall tomorrow. It simply argues against treating today's low volatility as permanent. And we've even got analysts themselves who have rarely disagreed more. Price target dispersion across the S&P 500 is at a decade high. And the disagreement is most extreme in technology. This is precisely the environment in which stock selection and the assumptions behind each valuation well they really matter. And now for the part that a simple bubble narrative misses. The S&P 500 return this year is not primarily come from investors paying a high multiple. We can see that earnings contributed around 20 percentage points while multiple compressions subtracted seven and dividends they added less than one point leaving the total return so far at around 14%. And we can also see that the rallies also broadened the S&P 493 the index excluding the Magnificent 7 while it's gained around 18% compared with around 9% for the Magnificent 7 themselves. And AI infrastructure it remains the largest earnings engine with year-over-year growth far above the rest of the market. But the nonAI portion of the index is still producing positive earnings growth. This is not a market supported by only one company. And when we look at the heat map of the S&P 500, this is just over the last 3 months. We got financials, industrials, and parts of healthcare. They've performed strongly even while several household technology names have fallen. The breadth here is one of the strongest arguments against making an all or nothing market call. And then on the flip side, we have the draw down map. It tells us how much stocks have fallen from their 52- week highs. We've got many individual companies. They're substantially below their highs. even while the index remains elevated. So, the market's not waiting for the index to fall before essentially separating the winners from the losers. And we've also got profits which are becoming increasingly connected. Investment gains, private financing, cloud contracts, and AI infrastructure commitments. They now link the fortunes of companies that investors, well, they historically often analyze them on an independent basis. We've got Alphabet, Amazon, Meta, and Microsoft together where they have around $1.5 trillion of disclosed purchase commitments alongside hundreds of billions in leases that have not yet started. And listen here to the financing concern, not whether AI demand exists, but who ultimately carries that risk. >> In 2027, we're going to spend more on AI and the and that boom than we do on the Department of Defense. Here's the thing that uh Tom I wonder about the Wall Street Journal article because when I see all that off-balance sheet financing I start to remember Enron and all the offbalance sheet financing and it's on top of that you've got these structures with the private credit funds that have a holding company that's in the JV and then there's a third company that actually is issuing the bonds. So, in the end, who's holding the bag? And is that more obfiscation than actual good business? And should we be worried about what seems to be a lack of transparency in terms of who's really lending the money and who's going to be stuck with it in the end? The point is not that AI spending is irrational, is that the financing and cash flow timing must be examined. And this chart captures the cash flow problem. Consensus expects combined hypers scale free cash flow to remain negative through 27 before recovering doesn't mean the investment is rational. It means the payoff is being pulled further and further into the future. And the further into the future the payoff sits, the more sensitive is present value becomes to the discount rate. A dollar earned 10 years from now is worth much less today when the required return rises. And listen here for why the 30-year Treasury matters even though it's not our discount rate. >> Aren't people talking about guys give me the 30-year please? Why aren't we why aren't we focused and fixated more on that the 30-year Treasury which is now at 529. Okay >> comes out of that Fed meeting right and you know reveals the fact there were three descents. the talk seems to be uh much more hawkish even though the action didn't match the rhetoric. Nonetheless, the 30-year yield shoots higher. We continue to have a lot of issuance coming on the market, right? These debt raises from the hyperscalers among others. The concerns about the deficit and whatever other issues you want to suggest are leading to the fact that the 30-year yield continues to rise. It doesn't matter. This is the bridge. When bonds yield more, uncertain equities must offer a sufficiently higher prospective return. Now, to be clear, the 30-year Treasury yield is not itself the correct discount rate for every stock. A discount rate must also reflect company specific risk and the additional return demanding for owning equities rather than government bonds. But when a long-dated government bond yields more than 5%, assuming an 8% return for a highly uncertain equity, well, it deserves to be challenged. So, I'm not going to change, as I said before, any company's cash flow forecast during the rate test. The only variable will be the required return. We're going to look at 8%, 9%, 10%, and 11%. And this is ultimately not an argument to abandon stocks, earnings remain strong, and valuation is a poor short-term timing tool. It's an attempt to identify which businesses offer a genuine margin of safety, and which only look cheap because one cell in the spreadsheet is doing too much work. And the first company produces the largest headline upside of the entire group. And that's Meta trading around $568. We can see it's down 14% for the year and heading towards 52- week lows. Now, Wall Street, they remain firmly bullish, but the quantitive rating here is only hold. So, you could argue the disagreement here reflects a company with exceptional operations and unusually large new risks. Now bear in mind met trade around 18 times forward earnings is below its 5y year average well of 22 and the yield we can see is close to its short-term history but the real attraction is not the dividend it's the amount of earnings growth available at this multiple which is below 18 and if you do want to see it on the blue tunnel which comes from simply safe dividends well it sits below the bottom end of the blue tunnel which is always highlights intrinsic fair value price so this is pointing to a clear undervaluation signal Now, with Meta in particular to their growth, revenue was up 27.7% year-over-year, expected to be 23% moving forward. And operating cash flow, well, yearonear that's grown 27.4%. Analysts also anticipating strong EPS to compound over the next 3 to 5 years above 20%. And the core advertising machine, it remains remarkable. Gross margin 82%, EBIT margin sitting at 38% and net income margin close to 30%. Meta is not being forced to finance AI from a weak underlining business. But levid free cash flow has in fact fallen 34% and the free cash flow margins has dropped to roughly half its 5year average. This is the immediate cost of the investment cycle. An incredible note here is in fact that capital expenditure now represents 39% of sales. Compare that to their 5year average that sits around 24%. investors are therefore being asked to value excellent present economics while trusting management to produce enormous future returns from today's spending. And bear in mind as well the risk with Meta is not purely financial. Meta is facing a pivotal social media addiction trial in California, something we discussed in the most recent deep dive. And these are with claims that its products were deliberately designed in ways that harm children and teenagers. And we've got the states. They're seeking an amount reported more than $1 trillion. Now, a claim is not the same as a final judgment, and Meta denies the allegations, but the potential consequences include not only money, they could include changes to both product design and engagement. Now, in terms of Wall Street and what they see for this company, at least in the shorter term, the average price target, $754, implies around 33% upside, although the range we can see runs from 580 the lower end up to $1,000 at the upper end. The extraordinary spread shows how differently analysts are pricing the legal risk and the AI investment. And my base ECF is deeply demanding in the near-term. Free cash flow falls around 2 billion 26, recovers to 20 billion 27, 50 billion in 28 and 95 billion in 2030 before growing at a rate of 12% at an 8% discount rate. Well, it produces a value of $830. At a first glance, Meta appears 46 and undervalued. And you can see in fact when we look at a margin of safety looks very strong at 32%. But then if we apply the same cash flows to high required returns we can then use 9% and see the value drops to $667 which in turns lowers the margin of safety down to around 15%. If we then change the discount rate to 10% we can see $552 actually gives us an overvaluation signal meaning no margin of safety a 3% premium. And then when we change it to 11% well the overvaluation clearly becomes larger meaning no margin of safety a 22% premium. So Meta therefore survives the 9% test better than any company in today's group. But his margin of safety disappears at 10% and the DCF does not explicitly deduct an uncertain legal judgment. So my conclusion for Meta is cautiously positive rather than blindly bullish. an attractive valuation 8% still interesting at 9% but not cheap enough to ignore either the trial or the scale of the capital spending and then we move on to the second company which has fewer legal concerns but its cash flows are even more exposed to the AI spending cycle here is Amazon's bull case listen for its two engines accelerating AWS and expanding retail margins >> but um if you already owned I mean this is a big question for a lot of people who own who have owned the magnificent seven. Do you stay in them? >> Yeah, >> I like some of the Magnificent 7. I think Amazon is the best position because I think they can win in very very many ways. Obviously AWS and seeing an acceleration to 38% growth from uh from 20 27% growth of quarter before. Um that's really good. You I think retail sales are running uh the businesses are running about 9% comps. Margins are expanding. So, I like I like Amazon. >> The acceleration is real, but supporting it suppresses near-term free cash flow and it increases the valuation sensitivity. Now, Amazon's raise around $260 is up 13% year-to date. And we can see all three rating systems are very bullish, while we have a forward P that sits close to 21 times, far below the extreme multiples that Amazon carried historically. And the most important development is AWS growth bottom around 12% in 23 but has now accelerated to 37% is not merely stable cloud demand is a dramatic reaceleration where we have AWS annual recurring revenue reaching around 169 billion compared with only 40 billion at the end of 2019. The cloud business has become one of the largest recurring revenue engines in the market. And you can also see that the rest of Amazon is also performing online stores. They were up 15% year-over-year. Third-party sellers, they were up 16%, advertising 26% subscriptions 12% AWS 37%. Total quarterly revenue reached around 200 billion that was up 20% year-over-year. However, the reported net profit of around 63 billion included around 53 billion of other primarily gains from anthropic investment. That is real value creation, but it's not recurring operating profit and shouldn't be treated as though it's going to repeat every single quarter. And their forward revenue, it sits around 14% forward EBIT DAR projections around 23.5 and we can see earnings per share expected to grow around 24% over the next year. The operating businesses, they're also becoming substantially more profitable. But we can see that the levered free cash flow margin is almost zero. Compare that with around their 5year average that sits around 3.6%. While capital expenditure that's risen to around 22.3% of sales, Amazon's producing enormous operating cash flow, but they're also consuming almost all of it. It makes Amazon central to the wider market question. Accelerating AWS demand supports Nvidia and Micron, but satisfying that demand requires Amazon to keep funding infrastructure on a huge scale. And my DCF assumes free cash flow rises from 5 billion 26 to 20 billion in 27 then 60 billion 120 and 175 by 2030. It ultimately reaches around 308 billion in 2035. These are very large numbers but they reflect the operating leverage now embedded in AWS advertising and retail. And at the 8% discount rate where we can see the fair value comes to $348 implying around 34% upside from today's price. Wall Street well their average price target comes to $327 with upside coming in lower at $26%. So based on 8% we're talking about a 25% margin of safety. If we were to drop the discount rate to 9% we get $277 which does reduce the margin of safety dramatically to around 6%. If we increase that to 10%, well, we get an overvaluation signal. Obviously, no margin of safety, a 14% premium to today's price. And if we go one step further to 11%, well, $190, indicating a huge premium today of 37%. So, Amazon is therefore a superb business with genuine acceleration, but the valuation is highly dependent on both the cash flow recovery and the required return. I find it attractive at 8%, approximately fair at 9% and expensive at 10%. Which then takes us to the third company is on the opposite side of the spending is collecting the AI infrastructure money rather than funding most of it. Now here Nvidia's case, growth margins and free cash flow, not simply enthusiasm for AI. >> I recently bought Nvidia for the first time. You know, I've been a big fan of Broadcom, but Nvidia is the cheapest it's been since 2019, and they're growing like gang busters. Like 85% revenue growth, margins are 75%, they're going to double free cash flow. >> That is the strongest operating case here. Now, we test whether the valuation leaves enough protection. Now, Nvidia itself trades around $220, $225 depending whether the price in the pre-market will hold is up around 21% year to date. Wall Street gives it a strong buy. We can see here the quantitive rating his own hold is another indication that exceptional fundamentals do not eliminate valuation risk and the forward P depending on the earnings basis well it trades around 23 to 25 times which is below the 5year average that sits at 36. So the historical comparison makes the stock look inexpensive. Although history includes periods of much lower earnings and we can see that undervaluation signal on the blue tunnel massive disparity from the stock price lower end of the fair value. And the next major test well it arrives just days away August 26 consensus expects around 92 billion of revenue $28 a EPS. And when we take a look in fact at the last 90 days, well, there have been 41 upward EPS revisions and only four downward revisions. And analysts, well, they're expecting EPS to rise from around $8.96 to $1280, reducing the forward multiple to 17.6. But that also tells us how much earnings deliveries also required. And the present growth, well, it remains extraordinary. Revenue is up 71% year-over-year. We can see forward revenue growth. We're talking around 63% forward EBIT D 67 EBIT sitting above 62 EPS also sitting above 62 and this company's producing gross margins of 74% EBIT margin of 64% and net income close to 63% these are not normal semiconductor economics and the contrast with the hypers scalers is critical Nvidia's capex is only 2.6% 6% of sales. Its customers are taking the construction risk, energy risk, and financing risk. Nvidia supplying the scarce computing platform into that investment. And it's also why Nvidia's earnings matters to the entire market. A change in Nvidia's outlook could alter assumptions for suppliers, hyperscalers, and the S&P 500 itself. Now, my DCF assumes free cash flow increases from around 96 97 billion to around 180 billion in 2027. Again, these are all essentially on analyst forecasts and then continues towards 541 billion by 2036. Now, these assumptions are enormous. The model is not asking whether Nvidia grows is asking whether the current AI economics remain durable for a decade. And at the 8% discount rate, fair value we get to $32 indicating 37% upside. If we look at it from a margin of safety perspective, well, that comes around 27%. When we lower the discount rate to 9% we get $246 where in fact again still fairly healthy margin of safety coming in at around 11. If we keep pushing 10% well that is when we see the overvaluation signal no margin of safety a 6% premium and that final step to 11% well we can see overvaluation as expected the premium becomes wider now sitting at 24%. And you can also see that for analysts, well they range from $180 to $500. It really demonstrates the real uncertainty, Nvidia's the best operating business tested so far that even Nvidia does not survive a 10% required return at today's price. So my conclusion is that Nvidia currently offers the strongest risk adjusted combination of growth, profitability, and capital efficiency, but only a modest margin of safety around 9%, not a blank check at any price. And this takes us to the stock that looks cheapest on earnings, but maybe the hardest of all five to normalize. Micron's up 254% year to date. The shares, they were around $1,000, but we can see pre-market it is in fact down. And Seek Alpha, we can see they have a weak buy rating, but Walry and Quant give it a strong buy. And again, depending on the earnings basis, well, it trades around 7 to 14 times forward P. And the bull case, it begins with high bandwidth memory. Micron's estimated HBM market share rises from around 7% in 24 to 21% while his annual shipments increase more than 10fold between 24 and 27. And the latest quarter illustrates the scale of the cycle revenue around 4142 billion up 346% year-over-year. Gross profit 35 billion net profit 28 billion. Cloud memory and core data center products they're expanding at an extraordinary rate. I mean, we got forward revenue here that sits at 112%, forward EBITRA 185%. And forward EPS, well, that sits near 400%. I mean, free cash flow shares expected to climb 98% over the next 12 months. And their margins have transformed. Gross margin sitting at 73%, EBIT margin sitting at 66%, net income margin 56%, and return on capitals risen to around 43%. But bear in mind, Micron remains capital intensive. Cabex what we can see is around 28% of sales and memories historically been one of the markets most cyclical industries. So today's margins, remember, cannot simply be treated as permanent without question. It's why the low peak can mislead. A cyclical company often looks cheapest when earnings are closest to their peak and most expensive when earnings have collapsed. The correct questions not whether seven times earnings looks low. It's whether these earnings are sustainable. And Wall Street average target $1,500 implies close to 50% upside from the prior close and more in fact from the week pre-market price. That estimates look at that range $361 to 2,200. By far one of the widest ranges in today's episode. And my DCF again following analyst expectations jumps from around 3.7 billion to 35 billion 26 reaching 45 in 27 and then grows around 10% annually to around 96 billion by 2035. The forecast they capture the HBM opportunity but it begins from an enormous step change in cash generation. Now using the 8% discount rate we can see the value comes here to $1,193 around 25% upside. What should we said? More optimistic around 1500. And using this rate, well, we get a 20% margin of safety. Let's change it now. Discount rate to 9%. Well, in fact, it's sitting just above market value. Still margin of safety, but barely at around 2%. And then as we go one step further, no surprises, overvaluation signal, no margin of safety, a 16% premium. And that final step to 11% while the premium only expands, now sitting at 34%. There is also a second warning here. When we do go back to the 8% original rate, reducing the long-term growth from 10% we can see here down to 5%. Well, in fact, it produc a value of 884. For Micron, the growth assumptions matter at least as much as the discount rate. My conclusion is that Micron's not a bad company. The AI memory opportunity is real. But after a 254% rally, much stronger in fact over the last 12 months, the valuation provides almost no protection if either interest rates or normalized growth are less favorable than expected. We then move on to the final company which has none of Micron's explosive AI growth. It should therefore be more stable, but stable does not necessarily mean undervalued. And Home Depot reported earnings this morning and exceed expectations. Second quarter sales reached around 48 billion. Comparable sales increased 1.7% and US comparable sales rose 1.3. We had adjusted EPS of $4.92, beating expectations by 4%, revenue beat by around 1% and EPS was up 5% year-over-year, revenue up 6%. And this is a mature but resilient business. Revenues remain remarkably stable through weak housing turnover and expensive mortgages. And management said customers continue to complete smaller projects. They also reaffirmed fullear guidance total sales growth between 2 and a half to 4 and a half% comparable sales between flat and 2% with diluted EPS around flat and 4%. And the shares while they've materially underperformed Walmart and Target over the last year and they remain around 15% below their level 12 months ago, the underperformance may appear to create an opportunity. However, as we can see, the forward P sits around 22 times almost exactly the same as the 5year average. Now the yield 2.7% it is slightly above the 5-year but it's not high enough to compensate automatically for the weak growth that we're seeing. I mean forward revenue growth is only 3.6% forward EPS growth only 2.6% and long-term EPS growth sitting at 5.3 with in fact both free cash flow and operating cash flow having recently declined. Now the quality does still remain strong. We've got EBIT margin that sits above 12% return on capital we can see sitting at 17.6. 6. And operating cash flow, well, that sits around 18 billion on a trailing 12 month. So, Home Depot is not a broken company. Where Wall Street's average price target sits at $374, implying only 10 to 11% upside, estimates ranging from 310 to $430. And even the bullish consensus here is not describing a dramatically mispriced stock. Now, my DCF assumes free cash flow grows from around 17.3 billion in 26 to around 29.2 2 by 2035, representing around 6% annual growth. Home Depot as well, something to note, carries around 64 billion worth of debt, which materially reduces the equity value. So, getting to the numbers at an 8% discount rate, we get $365. We can see that's only around 6% in terms of upside. Terms of margin of safety, pretty much highlighting the exact same thing. If we go back here, change the discount rate to 9%. Well, we actually already see an overvaluation signal, a premium just at that 9% level of around 18%. So, no surprises. As we keep going further and further, the essential overvaluation here only gets larger, 44%. And if we do that final step of 11%, well, it's worth around $199, indicating a 73% premium. So this is the clearest example of a great company becoming a weak investment proposition at the wrong price. Investors being offered a historically normal multiple below average growth and only a modest dividend while bond yields are elevated. So my conclusion is a hold not a buy. The earnings were solid but at today's price depot requires a lower return assumption than I'm personally comfortable using to create meaningful upside. Now we can answer the question from the beginning at an 8% discount. Every one of these companies except Home Depot appears to offer substantial upside. Meta, well that leads at around 46% using that 8% rate, followed by Nvidia at 37%, Amazon at 34, Micron at 25, and Home Depot at only 6%. At 9%, well, the picture changes completely. Meta retained around 17% upside. Nvidia, as we can see here, around 12% with an 11% margin of safety. Amazon 7%, Micro only 2% and Home Depot already sitting 15% overvalued. And then at 10% none of the stocks that we cover today in fact had a margin of safety. None of them appeared undervalued. Ma that was roughly fair value while Nvidia, Amazon, Micron, and Home Depot all moved into negative territory. Now, it doesn't prove that 10% is the only correct rate. It proves that none of these valuations is independent of the return being demanded. The strongest businesses can still be poor investments if the price assumes too much. So these are all using the 8% discount rate and my risk adjusted number one is Nvidia. It combines the best growth margins and capital efficiency in the group while still retaining some upside at 9%. As we can see here going from 8 to 9, we still get a margin of safety that sits around 11%. The risk is that customers eventually slow the spending that currently supports these economics. Meta that ranks second. It produces the greatest model upside and survives the rate test best. But the legal case and extraordinary capex prevents me from calling it the cleanest opportunity. Amazon that ranks third. The AWS acceleration is genuine and the wider business is improving but almost all of the margin of safety disappears when we move the discount rate from 8 to 9% as we can see drops down to around six. At number four I'd have Micron. His growth may ultimately outperform every forecast shown today, but after the enormous rally, investors have almost no protection against a weaker memory cycle or a higher required return. And Home Depot, it ranks fifth. It may be the most familiar and stable business, but stability alone does not create value. At 22 times earnings and low singledigit growth, the current price is just not compelling. So, the broader conclusion is not that the market must repeat 2000. Today's companies are more profitable, earnings growth is real, and market breadth has improved. But at valuations this high, investors are being paid less for mistakes. It's why I wouldn't sell everything or in fact buy everything. I want businesses whose cash flows can justify the price without requiring the most generous discount rate, the most generous growth rate, and a perfect macroeconomic outcome all at the same time. But let me know your thoughts in the comments. which discount rate you believe is appropriate in today's market and whether you would rank these five differently. That discussion is ultimately more useful than pretending any single DCF output is the truth. And if you found the stress test useful, smash that like button, subscribe, notification bell on so you're aware of future episodes. And we also release one weekly article covering many things including severely undervalued stocks, what's gone in the market over the last few days. So you can click on the pin comment below, sign up, read all of these straight away. More importantly, have a great day. I'll see you all on the next one.
Comments 0
Sign in to join the discussion.
Sign inNo comments yet. Be the first to share your thoughts!