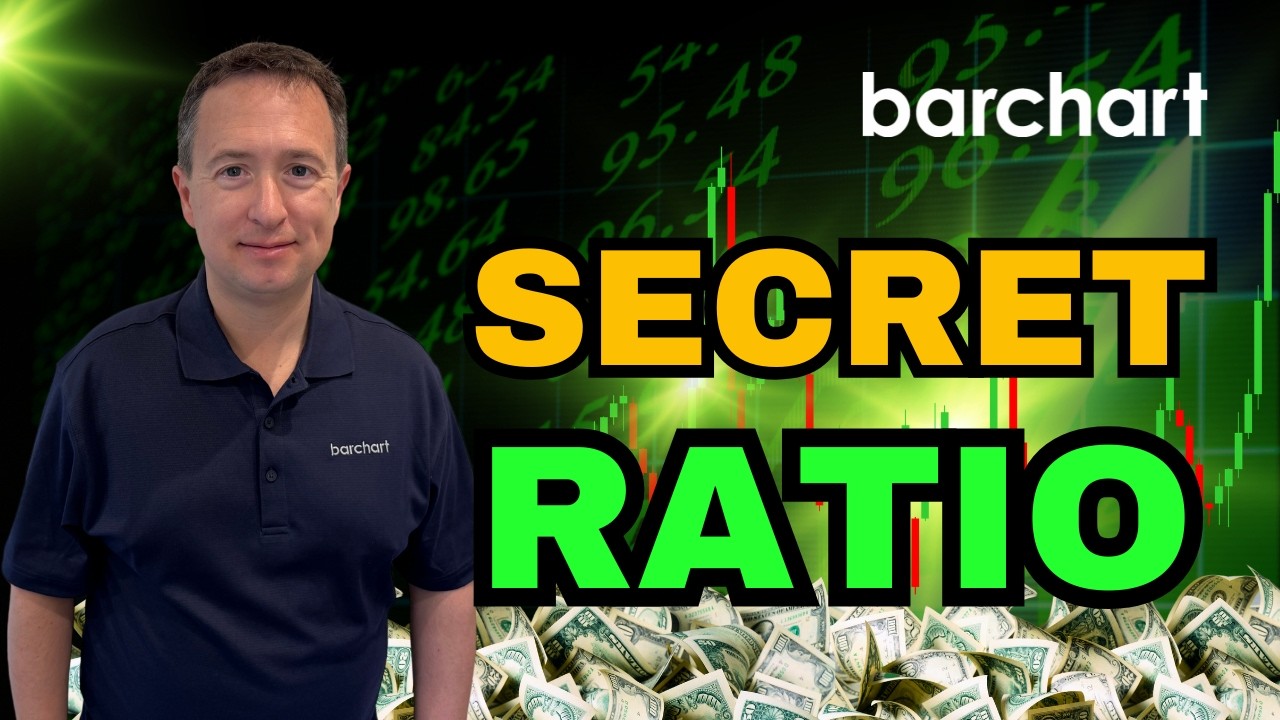
The Options Trading Signal Most Traders Ignore 👀‼️ #Options #TradingStrategy
- Video return
- +1.15%
- Calls
- 1
- Buy / Sell
- 0 1
- Published
Recommendations
Entry is the asset's closing price on the publication date. Current is the last close on record.
-
Entry $499.70 07 Sep 2026Current $493.95 08 Sep 2026Result +$5.75vs. index +1.7% SPY −0.5% over the same days
Cite this call Watch source video * †
Surrounding source transcript
…o pop out the profit and loss window by clicking here. Now, the first stop would be the volatility tab. I can already see that IV over HV is at 0.59, well below the sell signal line. Volatility is falling and IV rank is about 44%. Ideally, I'd sell a put right as IV over HV falls below 0.95 and IV rank is still above 50 or 60% for higher premiums. But since it's just a few days past the earnings release date, a good portion of that volatility has already been priced in. But still, I don't mind this trade. Microsoft is exactly the kind of company I'd be happy to own if I'm assigned. …
I'd sell a put right as IV over HV falls below 0.95 and IV rank is still above 50 or 60% for higher premiums.
AI-extracted context Microsoft ... I'd sell a put right as IV over HV falls below 0.95 and IV rank is still above 50 or 60% for higher premiums.
Full Transcript
Many of us spend hours hunting for the right stock, right chart pattern, right fundamentals, and even right sector. But what if the stock was never the problem? I mean, before I even glance at the chart, I need to know, is volatility rising or is it falling? Well, that single question decides whether the premium I'm about to collect is thin and forgettable or genuinely worth the trade. Well, in this video, I'm going to show you how bar charts rising and falling volatility tools let you spot that shift in seconds. How to tell when option premiums are getting expensive or if they're cheap, and how I pair that with IV rank to zero in on the higher probability trades. Now, before we dive into the page, let's slow down a second because everything I'm about to talk about is going to hinge on understanding two numbers. Without them, you're going to be left scrambling in the dark, so to speak. Not just in this video, but on options trading as a whole. First up, a metric that every option trader needs to know is implied volatility or IV. This is the expected magnitude of a stock's move in either direction, and it's a forward-looking measure that's derived from option prices. High IV means that traders expect a large price movement in the near future. Low IV means folks are expecting calmer markets. But then we've got historical volatility or HV, and it's the exact opposite of IV. On bar chart, historical volatility is measured over the past 30 days. Now, the core idea here is that IV and HV present two halves of volatility. And when they're out of sync, that's where the opportunities are. Think of it this way. If implied volatility is much higher than historical volatility, the options market is pricing in larger moves than the stock is actually made. In other words, option premiums may be more expensive because traders are expecting big moves. Now, on the other hand, if implied volatility is low or even below historical volatility, well, option premiums tend to be relatively fair or even cheap because the market's not expecting any excitement. Of course, none of this predicts where the stock is headed. It simply compares what the option market expects to what the stock has actually been doing. And that's exactly why we include the IV over HV ratio on our options dashboard. No need to break out your calculator or your spreadsheet cuz IV and HV are automatically calculated and presented right there for you along with other valuable metrics. So when I'm screening for opportunities to sell options, this is one of the first metrics I like to check. In a perfect world, I want to sell options on high but falling volatility. Of course, in a vacuum, it is going to be difficult to make sense of IB and HV aside from maybe saying premium might be high or low because it doesn't tell you when to act or what to do. And that's where the secret ratio comes in. Think of it like a warning system that asks the question, how different are market expectations from what the stock has actually been doing. And you know what? The benchmark is surprisingly simple thanks to bar charts volatility interpretation, which you can see right here. When the IV over HV ratio exceeds 1.05, it tells us that implied volatility is at least 5% higher than historical volatility. the option market is pricing in a bigger move than the stock has recently delivered. Now, this doesn't say the stock is guaranteed to explode higher or collapse lower. It simply tells you that traders are paying for the possibility of increased movement, which generally translates into higher options premiums. Now, for option buyers, the signal is clear. Stay and wait for calmer waters. But for option sellers, those higher premiums mean more potential income that's waiting to be had. Okay, so now let's flip the script. When the IV over HV ratio falls below 0.95, it means that implied volatility is at least 5% lower than historical volatility. In plain English, it means the stock has been moving more than the option market currently expects. And this simply tells you that traders aren't currently paying for much movement, which generally translates into lower option premiums. So, you get a discount if you're a buyer, but maybe it's not the best time to be a seller. Now, you might be wondering, why 1.05 and 0.95? Why not 1.01 or 1.1 or any other decimal? Well, it's simple. Volatility changes every single trading day. And any tiny difference between IV and HV are often nothing more than market noise. A stock with an IV over HV ratio of 1.01 isn't meaningfully different from one that 0.99. That's why the professionals tend to avoid them. However, these signals are fluid and need to be considered along with other surrounding metrics and factors. A stock with an IV over HV ratio above 1.05 5 isn't automatically a great option selling candidate, just as one below 0.95 isn't automatically off the table. I mean, there could be an earnings report next week, a major FDA decision, an acquisition rumor, or any number of catalysts that justify elevated or depressed volatility. Instead, professionals use these thresholds to narrow their focus. Once a stock passes that first screen, they dig deeper by looking at liquidity, earnings dates, implied volatility rank, technical levels, and the overall market environment before placing a trade. Now, like with anything, an indicator by itself is nothing. But if other factors point in the same direction, well, you might just have yourself a good trade. Now, if you got any experience with technical indicators, then you're probably well aware of the possibility of fake signals. And the same can happen with volatility. Just because implied volatility jumps today doesn't necessarily mean that a new trend has begun. Maybe an analyst issued a surprise new price target. Or maybe a new stock pick is making the rounds right here on the internet. Or maybe it was simply a one-day overreaction that disappears quickly. kind of like hope after an election. That's why bar chart doesn't just stop there. It also looks at the shortterm trend in implied volatility by comparing the 5-day average IV against the 20-day average IV. For volatility to be considered rising, the platform looks for three things to happen all at once. The 5-day average IV must be at least 5% higher than the 20-day average. The IV over HV ratio must be above 1.05 and applied volatility itself must already be moving higher. When those three conditions line up, it's a strong indication that the increase in volatility isn't just a one-day anomaly. Expectations have been building consistently and the trend is accelerating. But what about falling volatility? Well, the exact opposite applies. The 5-day average IV must be at least 5% lower than the 20-day average. The IV over HV ratio must fall below 0.95 and implied volatility must already be trending downwards. By the way, you can look for stocks that meet these criterias right here under options and then rising and falling volatility. Now, you might notice that the list is a bit thin, especially considering there's thousands of stocks that are trading in the market. Surely there's more than a couple of dozen of these trading today, right? Well, that's exactly the point. Bar Chart limits these lists to the 500 most actively traded stocks by options volume. At first glance, that might seem a little restrictive, but it's actually one of the features biggest strengths. After all, you probably don't want to be spending your time on on an illquid company with wide bid ask spreads or perhaps even inconsistent options chains or or worse yet option contracts that barely trade. Those stocks can be difficult to enter, difficult to exit, and even difficult to stomach once you're in it. You can also see the closest earnings date right here. So you can immediately tell if recent volatility is from earning seasonality or something else. Now, bar charts, rising and falling volatility screeners, these are great starting points, but I never use them without checking IV rank. IV rank measures where a stock's current implied volatility is relative to its own 52- week range. A high IV rank means options are expensive compared to the recent history, while a lower IV rank means they're relatively cheap. And there's another thing to know about IV rank. It'll never stay too high or too low forever. It's mean reverting, which means it naturally gravitates back towards its long-term average over time. And that's exactly why I avoid chasing extremes. Then there's another metric worth knowing, IV percentile. Now, IV rank tells you where today's implied volatility sits within its 52- week range, but IV percentile tells you how often implied volatility has been lower over the past year. For example, an IV percentile of 80% means the current implied volatility is higher than it was on roughly 80% of the trading days over the last 12 months. Now, looking at both metrics together gives you a more complete picture of whether options are truly expensive or cheap today. So, how do we use that for trading? Well, for stocks with rising volatility, I generally avoid buying anything with an IV rank above 80%. At that point, option premiums are already near their yearly highs, leaving more downside than upside. Now, for stocks with falling volatility, I avoid selling options when IV rank is below 20%. If implied volatility is already low, well, then there's very little room left for further contraction, which means less premium to collect. You know what? Aside from limiting the results to the most actively traded underlying assets, the rising and falling volatility pages also apply the 8020 rule to IV rank and percentile. And honestly, it makes screening for potential assets that much simpler. Now, this is all theory, so let's test the new pages out by finding a live viable trade. Now, if you watch me here on Bar Chart, you know that I love selling puts on high quality companies. So, let's start with the list of falling volatility stocks. And here we have a bunch of companies that I can pick and choose from. And I can also then screen them using the integrated stock screener tool right here. But honestly, I don't need to do that today. I already have a target in mind. Microsoft just released a very strong earnings report a couple days ago, at least at the time of recording, and it was driven by continued growth in its cloud segment. And we can all see from the chart how the market reacted to these results. Now, here's where volatility comes into play. Before earnings, option premiums were inflated as traders priced in uncertainty around the announcement. But once it comes out, that uncertainty tends to fade. And that's exactly why Microsoft's volatility is falling right now. So, from the falling volatility stocks list, I'll click on Microsoft, then on naked puts. Once there, I'm going to change the expiration date to September 11th, which is 41 days away, at least from the time of recording. And now I have a results page with short puts that are expiring on that date. The next step is to pop out the profit and loss window by clicking here. Now, the first stop would be the volatility tab. I can already see that IV over HV is at 0.59, well below the sell signal line. Volatility is falling and IV rank is about 44%. Ideally, I'd sell a put right as IV over HV falls below 0.95 and IV rank is still above 50 or 60% for higher premiums. But since it's just a few days past the earnings release date, a good portion of that volatility has already been priced in. But still, I don't mind this trade. Microsoft is exactly the kind of company I'd be happy to own if I'm assigned. implied volatility is still well above its 52- week low. And there's enough premium left to generate a reasonable return over just 41 days. Even better, if I go to the trends tab, I can see that all indicators point to an extremely bullish short-term outlook for the stock. So, now that I have the underlying stock, how do I select the strike price? Well, the rule of thumb is to pick a price where you're comfortable buying the stock if assigned. That's easy enough, but for a more data supported approach, let's switch to the expected move tab. This shows the range the option market expects Microsoft to trade in by expiration. And that's based on current option prices. As you can see here, Microsoft is expected to trade between $431 and $498 by September 11th. As put sellers, you'd usually want to place your strike below the lower end of the range to give your trade a better chance of expiring worthless. Now, how low below the lower end of that range is going to depend on your unique risk appetite. So, let's say I'll pick the $430 strike. According to the screener, I can sell the put and collect $510 total for the contract, and the trade has an 80% chance of expiring worthless. But even if it expired in the money, I'd get to buy Microsoft at a decent 9% discount based on today's prices. By the way, in my next video, I'm going to cover how the trade turned out. So, be sure to like and subscribe so you don't miss it. Now, if you're a more intermediate trader who wants more information on volatility, say structure, historical data, skew, or reversal across different strike prices, delta, and expiration dates. Well, you can also access the volatility charts right here. So, let's tie this all together. Bar Chart's new rising and falling volatility pages can help you identify underlying assets that are ripe for certain option strategies. It helps you look for situations where HV, IV, and IV rank are firmly on your side. One habit though I'd encourage you to build on is by making rising and falling volatility pages part of your early morning routine. Every trading day, head over to the options menu. Then click rising volatility and falling volatility. In less than a minute, you're going to have a short list of stocks where volatility is actually changing instead of wasting time digging through hundreds of charts. Now, here's a little challenge for you. Pick just one stock from today's rising volatility list. Don't trade it. Just add it to your watch list and monitor the IV over HV ratio over the next 48 hours. Watch how it changes as new information enters the market, especially around earnings season. Seeing the secret ratio evolve in real time, is one of the fastest ways to understand how option premiums respond to changing expectations. And if you're new to options trading, don't feel like you need to risk real money right away. Most brokers offer paper trading accounts where you can practice placing trades with virtual money. This is one of the best ways you can build confidence, test your process, and learn from your mistakes before putting real money on the line. But now I want to turn it over to you. Have you used rising and falling volatility as part of your own due diligence? and if so, what's your preferred option strategy for each condition? Let me know all of that and more in the comments below. And while you're there, if you found the video helpful, don't forget to like and subscribe because it really does help others find the video. It supports the channel and it makes sure that you don't miss out on our next deep dive. Well, that's it for me today. Thank you so much for watching and hope to see you again here on YouTube. Bye for now.
Comments 0
Sign in to join the discussion.
Sign inNo comments yet. Be the first to share your thoughts!