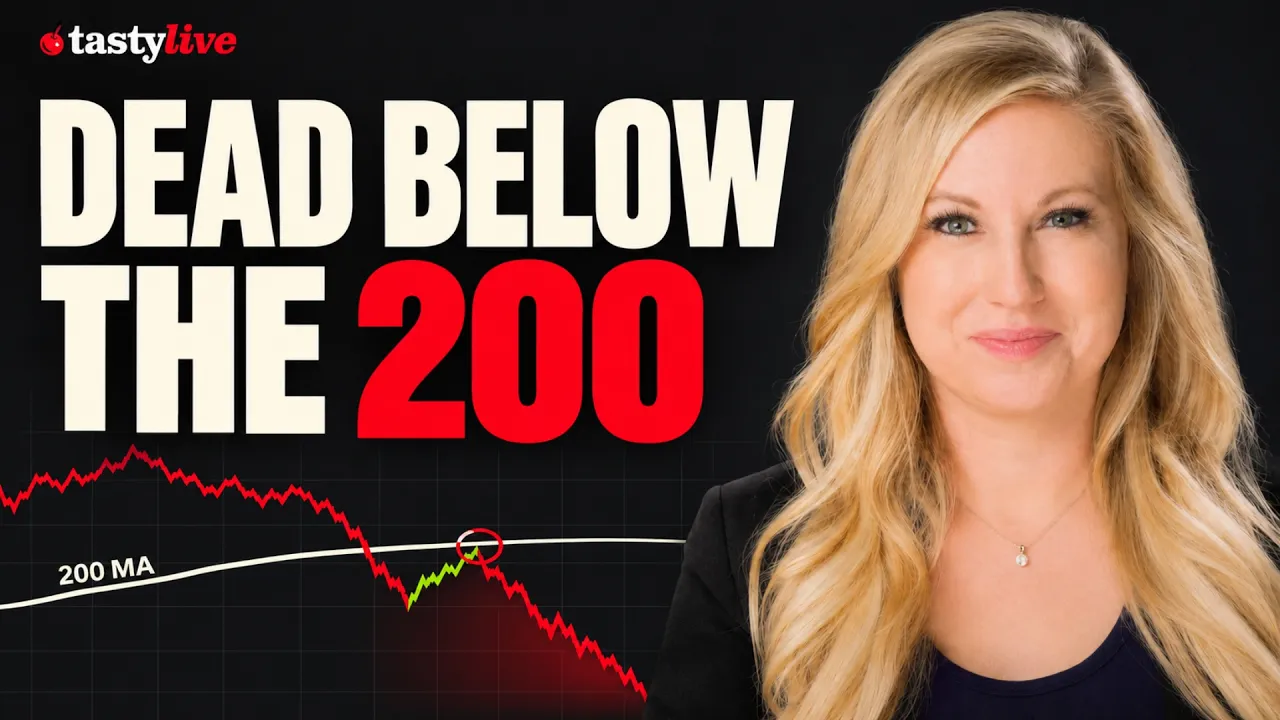
… know, I'm always focused on which tickers have relative strength, which tickers have relative weakness, and which direction I want to go with. Now, in this case, we've had multiple different tickers come out and have earnings destruction. Okay, we've had Google take a big hit um after earnings. So, that one definitely was an earnings destruction trade. And by the way, when I say earnings destruction, what I mean is that the ticker has experienced more than the expected move post earnings. So I'm looking at the expected move in the options market. And if we see a 1 and a half to 2x move, typically we're going to see more downside in the name. And it means it's not a buy and oftent times it'll be a sell for me. So we had earnings destruction with Google. We also had earnings destruction with Meta. Meta definitely below the 200 simple uh on the daily chart. Anytime a stock is below that zone, it's pretty much dead to me. But if you take a look at …
Okay, we've had Google take a big hit um after earnings. So, that one definitely was an earnings destruction trade. And by the way, when I say earnings destruction, what I mean is that the ticker has experienced more than the expected move post earnings. So I'm looking at the expected move in the options market. And if we see a 1 and a half to 2x move, typically we're going to see more downside in the name. And it means it's not a buy and oftent times it'll be a sell for me.
Contexte extrait par IA
Now, in this case, we've had multiple different tickers come out and have earnings destruction. Okay, we've had Google take a big hit um after earnings. So, that one definitely was an earnings destruction trade. And by the way, when I say earnings destruction, what I mean is that the ticker has experienced more than the expected move post earnings. So I'm looking at the expected move in the options market. And if we see a 1 and a half to 2x move, typically we're going to see more downside in the name. And it means it's not a buy and oftent times it'll be a sell for me. So we had earnings destruction with Google.
Transcription Complète
Hey, it's Danielle and I'm here with two trade of the days for you. It's been an absolutely crazy week in the stock market, so I definitely want to make sure I cover the NASDAQ MAG 7. We'll get to the chips and my favorite earnings destruction play this week. So, let's look at the NASDAQ futures first. You know, it's been a wild week and yesterday we had one of the worst days that we've seen in years. Definitely the worst day that we saw this year. Uh, and today we're getting a slight bounce. I was looking for a potential bounce based off of the put call ratio. You really have to monitor the put call ratio in these kinds of situations because if and when the put call ratio gets up above one, too many people are short and the market can rally. However, the situation is not constant because what has to happen is we have to have followthrough and continuation. Now, today we've seen a little bit of the bounce. NASDAQ is up 1.5% which is good, but it's not really good enough for a massive short covering rally. We need to see some follow-through, especially from some relative strength leaders. So, taking a look at the Mag 7, you know, I'm always focused on which tickers have relative strength, which tickers have relative weakness, and which direction I want to go with. Now, in this case, we've had multiple different tickers come out and have earnings destruction. Okay, we've had Google take a big hit um after earnings. So, that one definitely was an earnings destruction trade. And by the way, when I say earnings destruction, what I mean is that the ticker has experienced more than the expected move post earnings. So I'm looking at the expected move in the options market. And if we see a 1 and a half to 2x move, typically we're going to see more downside in the name. And it means it's not a buy and oftent times it'll be a sell for me. So we had earnings destruction with Google. We also had earnings destruction with Meta. Meta definitely below the 200 simple uh on the daily chart. Anytime a stock is below that zone, it's pretty much dead to me. But if you take a look at Microsoft here, Microsoft looks absolutely phenomenal. So, let's talk about why it looks good. Uh first of all, it has a strong bullish trend on the daily chart. If you take a look at these levels right here, what you're going to see is that we have these nice stacked moving averages. And one of my favorite buy spots is going to be down here at the 50 simple on the daily chart. Right now, we're right above the 34 EMA. So, it's it's, you know, a little bit higher from my favorite buy spot, but that's okay. What that means is that I'll take a buy now. And if it falls a little bit further down into this zone at the 50 simple or even down at into the low that it had just a few days ago, that's a spot where I would add because it was just recently at that zone. It's a key area of support. And the other reason why I like this one is because it has a squeeze. I am a squeeze trader. I love identifying relative strength and momentum and I love identifying stocks that have consolidation that are getting ready to break out. Now, Microsoft is trading at 532 right now. And if we go and take a look at where we could place some upside price targets, um I personally like, you know, the previous area of resistance where Microsoft has already been. I typically like to use that as the easy target. Uh but I also like to overlap that with the options chain. So, if we take a look at the options chain and just see, you know, what is going on with Microsoft here, I like personally to go down to the uh monthly expiration series because that's where I'm going to have uh really the the best um options that I can deal with. And when we're taking a look at Microsoft here, going to just scroll up here. Uh basically, I like to start at the money. So, trading at 5 533 right now. If we can place a butterfly where we put that first leg just in the money um at 530, that's just going to give us nice little value there. And then if you take a look at where you could place that upper strike, as I noted, I like that 550 price target because Microsoft has already traded there before, but I also like that price target because it has quite a bit of volume and open interest. So, whenever I'm placing a spread in the options market, I definitely want to target zones that have a lot of volume and open interest. And you have 12,000 contracts there. So, that looks great. Um, for me personally, I like to place my butterflies evenly. So, I have a butterfly set up here that is 530, 550, 570. Now, this butterfly uh has a pretty good risk-to-reward situation because your max loss is a debit and it's going to be $480 and then the max profit is going to be $1520. Now, normally what I do with these is I try to target much, you know, lower percentages, but the thing is is that when you have that risk-to-reward scenario, it's significantly more optimal than, for example, if you're risking two to make one. So typically I like to target about 75%. Uh on the debit I'll take 50%. Uh but ultimately the price target is going to be 550. So I'll go ahead and take that one. Submit that trade. And now I want to talk about SMH because it would not be the end of the show without talking about the major hit that this area in the market took this week. SMH had an absolutely destructive move and this started due to earnings destruction. Okay, so this season um it's been a disaster for multiple different companies that have come out reported earnings and they were sitting just just not some of them were on the dead lows of the quarter but some of them like Intel for example it wasn't on the dead low but it was pretty close. We were up here. We were up above the 200 simple. But the issue with Intel going into earnings was the expected move took it below the 200 simple on the daily chart. Any company that's just sitting right there on that 200 simple on the daily chart going into earnings close to the lows of the quarter, especially if the prior quarter it either had a huge beat and didn't rally or even worse, it had a huge beat and rolled over and died, it's a candidate for earnings destruction. So, Intel got totally destroyed. I was down I think 28% the day after earnings and the entire SMH has gone with it. Now there was another company that reported earnings uh yesterday MCHP and this one is getting completely hammered today. Now people will ask me and they'll say oh my gosh why would you buy something like this that's already down? Well, the answer is because it has broken through multiple different support zones. It's getting sold on high volume selling. It's down twice the expected move after earnings, which is really the kicker. But if you look at these technical zones, it has broken through zone after zone after zone and it's getting sold on high volume. So, I will take some of these post earnings momentum trades. Um, you know, I do tell people that I generally use less risk when a ticker is already down to this extreme. However, I do still like to get a little piece of it. So, taking a look at where this one could go from here. Uh, right now it's down 14.87%. What I like to do is I like to target the uh prior lows. So the first low that I could have targeted uh that one has already been broken and as you can see when it broke that low it just continued to flush and the reason for that is because people have their stops there right so uh the next price target is now going to be this prior low and that's going to come in right around 50 and if that low holds that would be the spot where I would say okay that key psychological value held um I'm going to go ahead and take this one off. However, this is also one of those things where if that low hits and it breaks and it flushes, then in that case, I would just continue holding on until the momentum died. Uh so, if we go ahead and take a look at the options chain, um if you know about me, you'll know that I do really like spreads. I like spreads. I like butterflies. Um, and you know, you you could do a butterfly in this situation, but for something that is down so much, um, it just makes a little bit more sense just to do the puts, especially since they're so cheap. So, this is only a $55 stock at this point. Um, if you take a look at your options chain, the the puts are just they're not expensive, right? So, you can come in here and look at your options chain at the money or in the money. I mean, $5, $2.95. Um, this is just going to be a way that you can take a look at some of these earnings destruction moves and get involved. So, I really think that, you know, either one is fine. It really just depends on your overall uh risk control. But for me personally, um, taking a look at either the butterfly, um, and targeting like the you could target the $50 strike with the butterfly, um, or you could just use the straight puts. So, taking a look at those straight puts, um, they're, you know, not going to be too expensive. and either the uh 295 price at the 55 strike or the 5.40 price at the $60 strike. Either one of those would be completely fine for this earnings destruction trade. Really just depends on your overall risk tolerance. Um and that is my second trade of the day. So, thank you so much for having me on the show. I'm looking forward to being back next week. I'm going to be off uh out of office, but after that, you're going to be seeing a lot more of me. So, thank you for much. Thank you for having me, and I'll see you then. >> [music]

Commentaires 0
Connectez-vous pour rejoindre la discussion.
Se connecterAucun commentaire pour l'instant. Soyez le premier à partager votre avis !