…nitely check that out, especially if you want to dollar cost average safely, okay? So last Thursday, I told our members I'd love to see the mid to low $60,000 range and that any price under $70,000 is an absolute blessing. And here we are. The best time to buy is when you don't want to buy. So my simple suggestion is this. Decide how much you'd like to put in over the next few weeks. Split it into chunks. Buy a chunk on a set day or each time it drops. Do not chase a bounce and definitely move every coin to your hardware wallet, okay? My coins are in my own wallet with zero leverage and I'm watching $69,700 above us and $58,559 below us. So thinking years, not months. If this helped, ple…
The best time to buy is when you don't want to buy. So my simple suggestion is this. Decide how much you'd like to put in over the next few weeks. Split it into chunks. Buy a chunk on a set day or each time it drops.
AI-extracted context
The best time to buy is when you don't want to buy. So my simple suggestion is this. Decide how much you'd like to put in over the next few weeks. Split it into chunks. Buy a chunk on a set day or each time it drops. Do not chase a bounce and definitely move every coin to your hardware wallet, okay?
Full Transcript
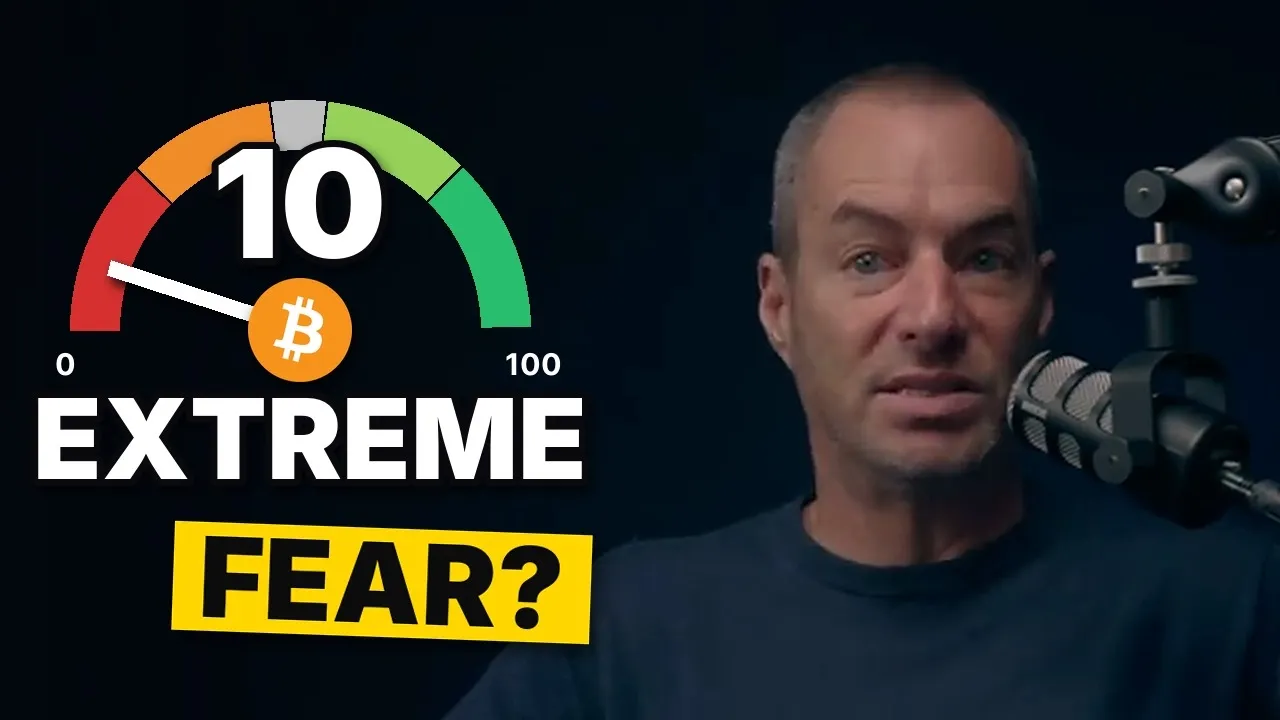
People are miserable about Bitcoin right now. Six red weeks in a row. The fear index is around 10 and the price is around $64,000 as I'm doing this video. And everyone is asking me the same question. Is the bottom finally in? All right? So even Nvidia smashing its numbers last night couldn't lift it. All right? But today Bitcoin is 408 days past its all-time high. And each of the last three bear markets, the bottom came between 363 days and day 406. So I'm going to show you three reasons why I think we are very close. The one chart that could still give us one more flush down, which would be a absolute blessing. And by the end of this, you'll have my honest answer of exactly the levels that I'm watching. So let's get into this. Reason one is time. This is every Bitcoin bear market since 2013 lined up from the day of the all-time high and each line shows how far the price fell below that high. The gray line 2013 bottomed 84% down on day 406. The blue line 2017 84% down on day 363. The orange line 2021 77% down on day 376. And that shaded band is where all three bottoms landed. The mint line is us from $126,198 in October last year. And today on day 408, we're down 49%. So we've reached the end of that window, having fallen far less than any of them. And our deepest close so far was $58,559 on the 30th of June. Okay? Three cycles isn't a law of physics, it tells me this bear market is old, not young. And the second reason is how people feel about it, okay? So now, this is the Fear and Greed Index since 2018 and each red dot marks a spell where it fell to 12 or lower. And on Sunday and Monday it hit 10. Only the 14th time fear has been this extreme. Now, here is the honest part. Look at the box on the right because in every one of those 14 the price went lower at some point first and the ones early in a bear market like January 2022 kept falling for months, all right? But the ones late in a bear market are a different story. So November 2018 at $4,347 was up 70% a year later, okay? March 2020 at $5,564 was up more than 10 times. And Glassnode's data shows about 45% of all Bitcoin is now sitting at a loss. And in 2015, 2019, 2020 and I think 2022 that kind of pain only showed up near the bottom. I've always said that when 99% of the people want to quit this space forever, the bottom is closer than everyone thinks. And that's exactly where we are right now. So where exactly could that bottom be, all right? So here's the weekly chart and those shaded candles are six red weeks in a row, 24% off since the start of October. And since 2014 only one streak was longer, nine weeks in 2022, okay? Last week I said the gold line, the 200-week average at $69,700 was the line between correction and a bear market and we closed below it. And below the dashed 200 weeks simple average at $67,974. So the short-term trend is clearly against us, but this is the fourth time this year we've closed a week under that gold line, and every time so far it has climbed back. So the zone to win back is $68,000 to $69,700 on a weekly close. And the floor I'm watching is that mint dotted line, the June low at $58,559. And if we go there, I see it as a gift. So what could push us there, okay? This is one chart that could give us one more flush, and it's not even a Bitcoin chart. It's the US 10-year yield in blue and the 30-year in orange back to 2000. Both are above that white 5% line. And last month the 30-year hit 5.67 %, its highest since 2001. So when a big fund can get 5 % from the government with no risk, it sells the one thing that that swings around, volatility, Bitcoin, tech stocks, and even gold, which is down more than 8 % in a month. With this much debt, they can't live with those rates for long. They'll print it back, not pay it back. But before the printing comes the pain, okay? And right now that pain is hitting tech. Since the 1st of October, the Nasdaq, the blue line, is down 9 %. Bitcoin, the orange line, 24 % and Nvidia, the white line, 33 % after Jensen Huang resigned as chief executive on the 11th November. Last night Nvidia's first results without hit smashed expectations, $115.8 billion of sales against what about $109 billion expected. And the shares jumped about 4% after hours, then gave half of it back. The bottom line shows Bitcoin moving with the Nasdaq at 0.68 close to the year's highs. So while tech is wobbling, Bitcoin wobbles with it. But the third reason I think we are very close is who already has been forced out. Reason three is the forced sellers. The Bitcoin ETFs lost $2.35 billion in two weeks, the most since early June, and more than $11 billion of leverage bets have been wiped out since Binance hack of 29th of October. People gambling with money they they don't have, so don't feel bad for these people. These bars are crypto's own cash. The stable coins and that red bar on the right is minus $16.1 billion in 30 days, the biggest drain since 2022 with only the Terra collapse, which was bigger. That is painful, but it's what the end of the bear market looks like. The tourists and the gamblers handing over their coins to people who actually hold them. And with North Korea still moving stolen Binance money and Apple Pay and the big US banks going down this week, I'd say it again, hold your own keys. So what about the Fed, okay? Wall Street is betting 98% on another hike, rate hike on the 9th of December. And tonight at 7:00 p.m. Lisbon time, we get the minutes from the last Fed meeting while Anthropic prices its share sales around $60 billion before it trades tomorrow. You know, I think the Fed meetings are all theater. And remember the if the the Fed hiked four times between 2016 of December and December 2017 and Bitcoin went from under $800 to almost $20,000 during raising rates because the Fed can only decide how bumpy the next few weeks are, not where Bitcoin goes over the next few years. So let me give you my answer here. So is the bottom finally in? No one knows that exactly, all right, when the bottom will be, but my honest answer is that we're in the bottoming zone. Either the June low at $58,559 was it or we get one more flush towards it. My base case around 50% is chop between $60,000 and $70,000 into the December Fed meeting. The bad case, about 30% is a break under $62,000 and a test of the June low. And the good case, about 20% is a weekly close back above $69,700, which would tell me the bottom was in the summer. Now if you've got real money in Bitcoin alongside a job and a family and want to hold through these cycles with a clear head, that's who the Learning Crypto membership is for, okay? Coming from me and Heidi doing this since 2016 and the link is in the description. I would definitely check that out, especially if you want to dollar cost average safely, okay? So last Thursday, I told our members I'd love to see the mid to low $60,000 range and that any price under $70,000 is an absolute blessing. And here we are. The best time to buy is when you don't want to buy. So my simple suggestion is this. Decide how much you'd like to put in over the next few weeks. Split it into chunks. Buy a chunk on a set day or each time it drops. Do not chase a bounce and definitely move every coin to your hardware wallet, okay? My coins are in my own wallet with zero leverage and I'm watching $69,700 above us and $58,559 below us. So thinking years, not months. If this helped, please like and subscribe and tell me in the comments, is the bottom in at $58,559 or do we go lower first? And please once again, like and subscribe. It really does help out our channel and share this with people that actually need to hear this. All right, talk to you soon.

Comments 0
Sign in to join the discussion.
Sign inNo comments yet. Be the first to share your thoughts!