…ing you a cash flow. SCHD is up almost 27% for the past year. So, this is my favorite and they give out a dividend close to 3.5%. So, I'd put 30% of the portfolio in that. Then two solid covered call ETFs that I like most are SPY and QQQI. SPYI has a dividend around 12% and QQQI has a dividend around 14%. So, I'd put 20% in each of those. With a $500,000 and at those percentages for those assets, one could be earning around $38,000 per year in income. And then when you factor in things like possibly rental income or just social security on top of that, that is a pretty good…
SPYI has a dividend around 12% and QQQI has a dividend around 14%. So, I'd put 20% in each of those.
AI-extracted context
Then a solid ETF that not only earns a good dividend but also grows as far as price appreciation making your portfolio keep growing even while giving you a cash flow. SCHD is up almost 27% for the past year. So, this is my favorite and they give out a dividend close to 3.5%. So, I'd put 30% of the portfolio in that. Then two solid covered call ETFs that I like most are SPY and QQQI. SPYI has a dividend around 12% and QQQI has a dividend around 14%. So, I'd put 20% in each of those.
Full Transcript
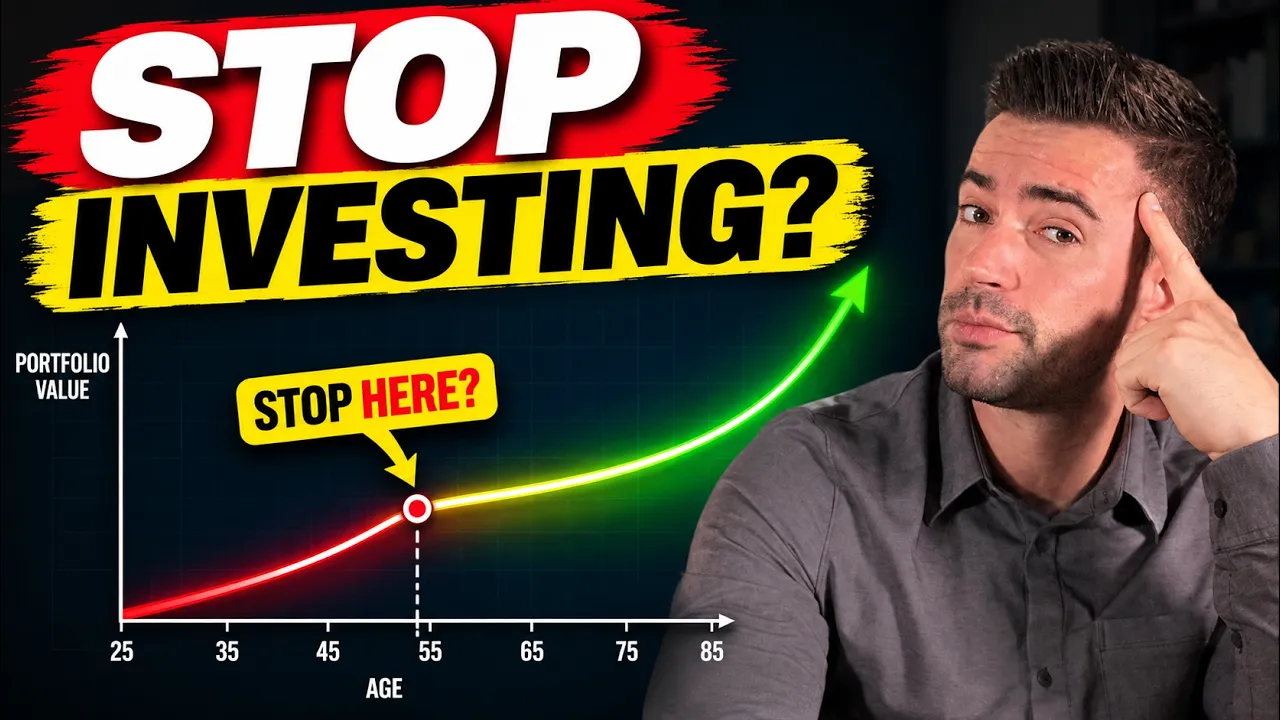
If you're anywhere within 10 years of retirement, you've probably caught yourself doing the same mental math over and over. Some version of how close am I really? Now, there isn't one answer, there's actually three, and they sit at very different portfolio sizes. For a typical saver, they land somewhere around $400,000, $1 million, and $800,000. And the smallest one hits way earlier than most people expect, but it gets treated like the finish line when it definitely shouldn't. Today, I'm going to show you where each one of them sits, the exact math behind each, and which one actually means you can stop working without flinching every time the market dips. So, let's just jump right into it. My name's Nolan Gouveia. My students call me Professor G, and I made this channel to make investing simplified. Remember that all investing carries risk, so do your own research. This is not financial advice, and I'm not a financial advisor. So, crossover number one, this is the moment your portfolio's annual growth is bigger than your annual contributions. Your money starts doing more of the lifting than you do. The math here is simple. Say you're saving $20,000 a year, and the market gives you its typical long-term average of about 7%. Growth and contributions are roughly even once you've got about $300,000 invested, and growth pulls clearly ahead somewhere around $500,000. So, basically, roughly 20 times your annual contribution is where you're comfortably past this first line. If you're saving $20,000 a year, around $400,000 you've crossed. Save $30,000 and the line sits near $600,000. And at $40,000 a year, it's around $800,000. That's crossover number one. And picture the year that you actually land there. Your portfolio's sitting at $400,000. You put in your 20,000. The market does its typical 7% and hands you $28,000 in growth. For the first time in your life, your money out earned your effort. That's a real milestone, and it's worth celebrating. But this is where people get it wrong and this is what actually matters. So, what actually changes when you hit that crossover number one? One thing. Basically, you can stop sprinting towards that savings goal. That aggressive savings rate that you've been doing over these past couple of years and has gotten you to this point, you can actually slow that down a bit. What does not change though, and this is where people get it wrong, you shouldn't stop contributing. And basically, there's three main reasons for that because this could be a huge trap. First is your employer match. If your company matches 50 cents on every dollar up to some limit, that's an instant 50% gain on that money the day it hits the account. You don't want to walk away from that just because compounding finally clicked. That's leaving free money on the table. Second would be the market itself. A 20% drop knocks you right back below the crossover in a single year. This line's not a switch you flip once. It's a line that moves and in a bad year it moves against you. And third, we see this all the time and it's just lifestyle creep. The moment you stop saving, your spending baseline quietly rises to absorb it. And now the portfolio you crossed over with isn't enough for your new spending level. You moved your own goal post without noticing it. So, the takeaway for crossover point number one is simple. It means you can actually breathe. It doesn't mean that you should stop. You could definitely cut it down a bit and then contribute just a little bit less than what you've been doing just because compounding is now doing most of the work for you. But honestly, the more that you add to it, the more compounding works even harder and why not just go that route. But now let's move over to crossover number two and this is the one where you could actually retire. Crossover number two is the moment your portfolio's annual growth is bigger than what you earn from work. Your money makes more money than you do. And here's the math. At $1 million invested, a 7% year gives you $70,000 in growth. So, for somebody earning $70,000 at their job per year, $1 million is the crossover point. If you're earning $150,000 per year, your line sits closer to $2.1 million. If you have a bigger paycheck, then the bigger portfolio is needed to out-earn it. That's why this crossover is personal to your income, not some universal number. And I'd invite you to even just pause this video right here and check out what would your number be. Take your annual salary, divide it by 0.07, and just see what that number is and how close you are. Once you hit that, your portfolio is now out-earning what you're trading your time for. But when you hit this one, you do definitely need to be able to answer this question. How long can this portfolio carry you forever? Because what we don't want to happen is for you to think that you're there, and you're only thinking that because it's a very good year in the stock market. Then we have a bad year, followed by multiple bad years, and now what do you do? Because this actually happened in history. Just look at 2000 through 2009. The S&P 500 returned about -1% per year for that entire decade. And in that, anyone who crossed this line in 1999 spent the next 10 years not crossed over. So, let me put this into real terms for you. Somebody hits $1 million invested in 1999, feeling great about their crossover. Then they watch the S&P 500 fall about 49% from its peak by late 2002. It recovers for a few years, and then 2008 hits and it craters again, down about 57% peak to trough. A full decade of statements going sideways and sometimes backwards. If the retirement plan depended on the stock market continuing to grow, that really hurt. But if their plan instead had leaned on the income that their assets could produce, like dividends or interest or rent, then during that time that actually would have been a totally different picture. So, once you hit crossover two, the question changes. It stops being did I save enough and becomes is my income structure stable enough to actually retire on. That's a completely different question and it's exactly what we see in crossover three as the actual answer to this. So, I went ahead and dug into the original definition of the crossover point. Like, when did this actually become a thing? Because it's not showing up on any retirement calculators and no new books in the last 10 or 20 years really talk about this. They're all pushing something different because it makes people a lot more money. So, let me fill you in on the actual truth. The original definition of the crossover comes from a book called Your Money or Your Life written by Vicki Robin and Joe Dominguez back in 1992. They defined it like this. At the crossover point where monthly investment income crosses over monthly expenses, you'll be financially independent in the traditional sense of that term. You'll have a safe, steady income for a life from a source other than a job. Now, notice what they're actually measuring there. Not portfolio size and not a multiple of your spending, monthly income from assets crossing monthly expenses. The original idea was that your assets pay your bills directly. You live on the income and you never have to touch the principal. And that one shift can compress the amount of actual money that you need. If you spend $40,000 a year, what you need is $40,000 a year in income. At a 5% income yield, that's $800,000 of income producing capital. Right now, treasuries and CDs sit in the mid-4%. So, a true 5% or more means blending in some dividend payers and those carry a little bit more risk than a treasury. Nowadays, there's just so many different creative ways that you can build out your portfolio to be paying out a nice dividend or interest or rent from rental income in a way where you're able to live off of it and you don't need that $1 million, $2 million, $5 million that most people think they need to retire. I have so many clients that are retired off of $500,000, $700,000 and they're doing quite well. Let me show you exactly what I would do if you had $500,000 but you needed to live off of that money. 30% in something quite safe and sustainable earning 4% of which the 10-year bond is hovering around 4.4 to 4. 7%. So, let's say 4.5. Then a solid ETF that not only earns a good dividend but also grows as far as price appreciation making your portfolio keep growing even while giving you a cash flow. SCHD is up almost 27% for the past year. So, this is my favorite and they give out a dividend close to 3.5%. So, I'd put 30% of the portfolio in that. Then two solid covered call ETFs that I like most are SPY and QQQI. SPYI has a dividend around 12% and QQQI has a dividend around 14%. So, I'd put 20% in each of those. With a $500,000 and at those percentages for those assets, one could be earning around $38,000 per year in income. And then when you factor in things like possibly rental income or just social security on top of that, that is a pretty good living and most people can actually fit into that very, very easily in retirement. Now, I will be real with you and say that that portfolio that I just went over is a little bit more risky than I would want for most retiree. If you have the luxury of having a little bit more saved up, then we can cut down on the covered call ETFs because those would be the most risky. We could add more to things that are a little more sustainable, things like the overall S&P 500 or total US stock market, more foundational ETFs and possibly even more into just income-bearing things that are even more safe like bonds or short-term T-bills or things like that. But here's the thing that I definitely wanted you to see because it's interesting how nowadays financial advisors are pushing for this other thing that makes them a lot more money when you could absolutely be doing this yourself. So now, 2 years after that first book came out, that first one in 1992, this next one came out in 1994. And this is by a financial planner named William Bengen. He published a paper that introduced what we now call the 4% rule. Withdraw 4% of your portfolio in year one, adjust for inflation each year, and historically your money lasts at least 30 years. But understand that that's a completely different framework. Not necessarily wrong, it's just not necessarily the same thing and possibly not even the best way for you to do this. The 4% rule assumes you sell shares every year. The original crossover assumed you live off income and never touch the principal at all. Kind of crazy that out of nowhere Bengen's math became just the standard for all financial planning. By the time The Simple Path to Wealth came out in 2016, financial independence had shifted to mean 25 times your annual spending. Same phrase, completely different math. An income stream that pays you forever got replaced by a pile you accumulate and then draw down. The original got buried. And the reason makes so much sense. It's actually quite brilliant of the finance industry because now they get to make a lot more money off of you. There's more than 107,000 certified financial planners in the United States today. And research from inside the industry shows about 86% of advisors price their services primarily on assets under management. They charge a percentage, usually around 1% of the money you let them manage. So let's run the math from the advisor's side. A client moves $500,000 out of a managed portfolio into a rental property or a CD ladder or SCHD or something, and that advisor loses about $5,000 a year in fees every year. Multiply across a whole book of clients and you can see why income-producing assets outside the market rarely show up on the standard planning menu. Now, I'm not saying financial advisors are bad or they're bad-intentioned or anything like that, but what I will say is that most people can absolutely do this absolutely on their own. Now, some people should have a financial advisor, but if you are taking the time to actually watch this video and educate yourself, my whole goal with my channel is to empower you to be able to do this by yourself. Unfortunately, I've seen so many clients over the years that are spending tens of thousands of dollars with these advisors, where instead those tens of thousands of dollars could be quite helpful in building their portfolio, not only for themselves, but maybe for their heirs down the road. I don't know about you, but I would rather be giving my money to people that I want to give it to, like my family or charities or things like that, rather than to a financial advisor. And so, learning this and then keeping it very, very simple is definitely my goal for you, and I hope that what you're learning from these videos is helping with that. Just know that if you were to go back to that lost decade that I was showing you from before, that 1999 to 2009, when the whole stock market dropped, had you been doing the 4% rule of selling off your portfolio, that would have been terrible during that time. But had you had income-producing assets during that time, things like CDs or bonds or rental income or even good ETFs like SCHD that have very solid dividend-paying companies in them, not only were they paying a good dividend during that time, they were actually raising their dividend during that time for most of the companies. So, had you build your portfolio more around that, even during a lost decade or a depression of some sort and definitely recessions, that's going to keep you a lot more safe than just pulling money off the top. So, So, actually can you do with all the information in this video? What are four main things you should do right now? Number one, don't stop contributing. At a minimum, make sure that you're still getting the full match at your job. And even if you are at one of these crossovers or a couple of them, it's not a bad idea to keep adding some into that, but it is smart to maybe pull down a little bit so that you have a little bit more freedom. And you could also increase the amount of cash you have off to the side for even more safety. Number two would be if you're past age 45 with $1 million or more sitting in pre-tax accounts, it may be time to stop maxing the pre-tax bucket. Required minimum distributions kick in at 73 or 75 if you were born in 1960 or later, and every dollar that comes out is taxed as ordinary income. One big RMD can push you into a higher bracket, pull more of your social security into taxation, and raise your Medicare premiums all at once. Past the crossover, the stronger play is usually Roth contributions, a taxable brokerage, or income-producing assets. And number three is all about a mindset shift. Stop treating net worth as the headline number and start measuring how much income your portfolio actually produces each month. Net worth is just fuzzy. Most people will put things like their car and their house into this whole big net worth picture. And really at the end of the day, none of that's actually liquid. You're not actually pulling any money from that anyway. So, while yes, it's important to know what your net worth is, I guess, the more important thing here to answer your question is, how much actual income do you have? How much money will you be able to live off of in retirement if you were to stop working? If you can answer, "How much did my assets pay me last month in dividends, interest, or rent?" then you have crossover three in view. And then number four would be to stress test before you call yourself retired. Take your portfolio, knock it down 30% in your head, and run all the math again. If retirement only works at the market's all-time high, you're not crossed over. You're at a peak balance. Those are very different things. Crossing the line is half the work. The other half is the structure underneath, the income floor, and the cash cushion, so the crossover survives a bad year. Now, the next step is to understand everything that's in this video here. If you only watch one other retirement video all year, this is the one. All of my clients have said they've got pretty much all of their information and the most value out of this video, and it's one of my highest viewed videos ever, so take a look at that now, or watch this one to keep you going strong in investing. And remember to keep investing simplified.

Comments 0
Sign in to join the discussion.
Sign inNo comments yet. Be the first to share your thoughts!