…ing to hold this 300 level. And literally my trade is banking on us holding the 300 level and getting a nice pop back to the upside here. This is fairly near term. I'm going to go out to the Oct 16 expiration again October 16th expiration. I'm going to buy the 310 calls. I'm going to sell the 315 calls against it. I like to use spreads. In this case it's a $5 wide call spread for $1.70 debit. It's just a nice trade. Looking for a pop back to the upside. Look it doesn't have to be like an investment thought in here. This is just a pop back to the upside. Let's you know hold the 300 level. Get back to like you know, 3153 20. And then we'll reassess because that's all that this trade needs i…
I'm going to buy the 310 calls. I'm going to sell the 315 calls against it. I like to use spreads. In this case it's a $5 wide call spread for $1.70 debit. It's just a nice trade. Looking for a pop back to the upside.
AI-extracted context
What I'm looking for, though, specifically in Home Depot, is a rotation back into anything but technology. You know, there's going to be a day and I know this sounds crazy, but probably this week, next week you're actually going to see some sell side activity in AMD. You're going to see sell side activity in micron. Your sell side activity obviously in in meta sooner or later semiconductors get hit. Meta gets hit and we start to rotate out of technology back into, you know, some of the staples of the economy. One of those is witches, Home Depot. Now, why do I actually like Home Depot? Well, that is the technicals. It looks like it's actually going to hold this 300 level. And literally my trade is banking on us holding the 300 level and getting a nice pop back to the upside here. This is fairly near term. I'm going to go out to the Oct 16 expiration again October 16th expiration. I'm going to buy the 310 calls. I'm going to sell the 315 calls against it. I like to use spreads. In this case it's a $5 wide call spread for $1.70 debit. It's just a nice trade. Looking for a pop back to the upside.
Full Transcript
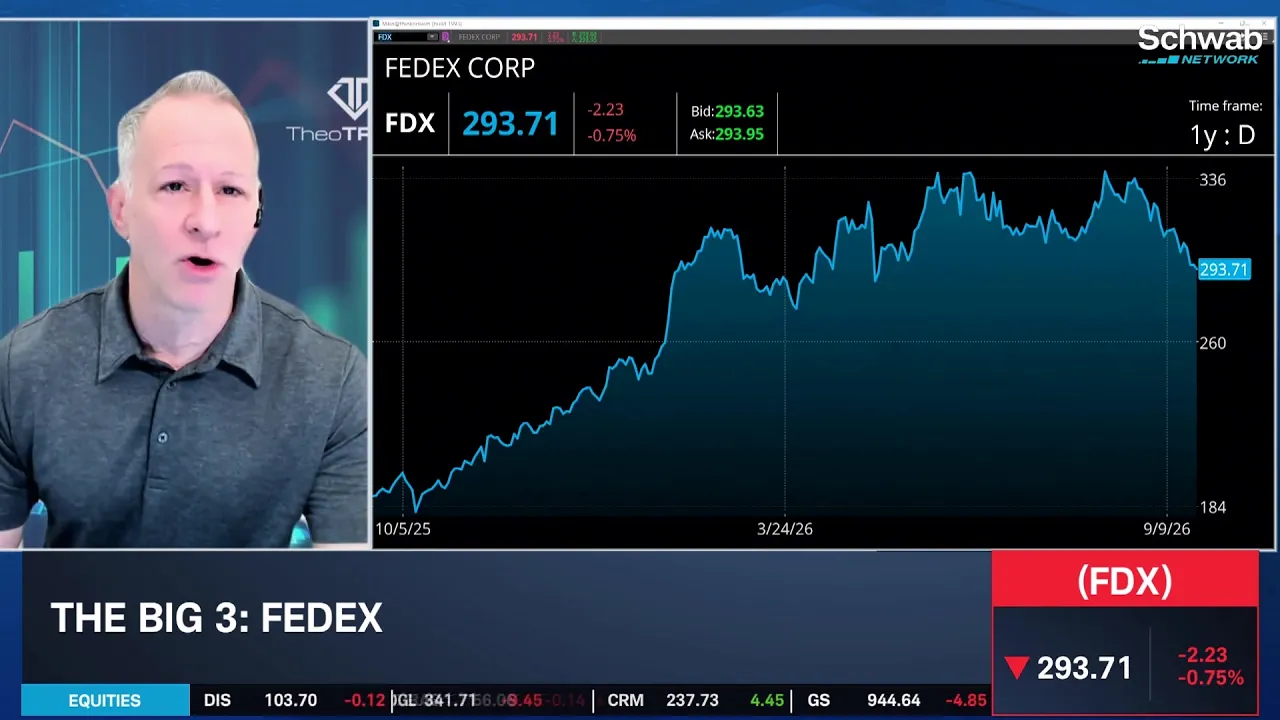
get your podcasts. Welcome back to trading 360. I'm Marley Kayden. It's time for the big three. We've got three stocks three charts and three trades for you. Will take us through the charts here to take us through the trades today. Don Kaufman co-founder of Theo Trade. Great to have you back on Don. Love to kick things off the same way we always do. Big picture thought on the market. Yeah. You know there's still a lot of bifurcations in this marketplace. It's, you know, 3 or 4 tech stocks followed by, well, the rest of the marketplace. You know, really what it comes down to is when you look at Underlyings, I'm ank and I'm going to explain something a little bit deep over here for look at the options chain inside of meta. If you want to see chaos, just go a week, maybe two weeks out, there is a $2 trillion company that is seeing an inverted implied volatility skew. What that actually means is that the chances of the marketplace, if you will, crashing to the upside, is priced in okay for meta higher to the upside than it is to the downside. And that in effect is is just wild. Again, a $2 trillion company with an inverted implied volatility skew to that extent is not something you're going to see in in everyday markets. Certainly not. But something to be excited about. We love that stuff over here. So thanks for highlighting that. For everybody watching, I want to dive into your big three though. You've got Fedex as your first pick here in the big three. They're a little under pressure today. Kind of down with the broader market right now only about 6/10 of a percent. So how are you looking at Fedex today. Fedex is going to be this is going to be my bearish trade for the day. I promise there's only going to be one bearish trade today. But look I'm going to hop on the bandwagon of what is the the current trend. And that is a trend to. The downside is you're going to see in in moments here as Rick is going to take you through. It appears to me like a double top is actually formed anywhere right around that. 34345 ish level. Hit it twice. Okay. Has reversed hard from that. 340 level down to present value. And I have to tell you, it does not look like it's going to stop anytime soon. The technicals are in a horrific stance right now. As I said, I'm going to get bearish in here, but I'm going to give myself a little bit of duration this trade. Look we're going to have to pass through earnings. Maybe it gets a little bit of a bid back under it. But again I want to hop on trend right now. And that trend is absolutely to the downside. Let's go to the D 18 expiration again give myself a little time D 18 expiration. I'm going to buy the 280 puts. I'm going to sell the 270 puts against it. This one is done for a $3 debit. So a full $10 wide put spread being done for a $3 debit gives us all kind of time. There's huge upside to this. If Fedex continues to trade to the downside. All right. Rick. So he says the technicals are in a horrific stance. Are you seeing the same thing and take us through what's horrifying. Well it's not great. I mean and to to kind of illustrate some of these things. These would be the double top areas that Don was discussing here near about 34341 or so. So you can see kind of it makes this, this M shaped pattern here where we hit the same point and see rejections, you know, two separate times. Now we've formed a downward sloping channel type shape here between our two white lines, we have crossed through a floor that was formed after earnings here near 306. After a brief bounce, we collapsed through that pretty swiftly here. So now we have a couple important areas to the downside to consider. We have a set of relative lows here at 290 and here at 286. So that gives us this supportive zone here potentially. But we also have a gap that formed back here. So 276 to about 271. You can see that was some low points there. And if you recall that that roughly lines up with the break even and the short strike of our trade. So it would be looking for a move down to this this supportive area here where we formed this gap almost back toward the beginning of the year in January or so. So now we can see our moving averages in this case are showing signs of trend acceleration to the downside. You can see that we have our five day, 21 day and 63 day exponential moving averages in descending order according to their their speed here. So the fastest is below the slowest one. We also have our 251 day EMA representing one trading year coming in at 28441. So that remains another notable downside area to watch. It also lines up pretty closely with the lower boundary of our channel. So that gives it even a little bit more extra emphasis as an area to watch out for. RSI is hanging on just by its fingernails here above the 30 threshold here. That would represent the oversold area. A move below that area would be another more bearish signal here. So you know kind of the technical bearish evidence here is piling up a little bit. Not really the greatest situation. So if we were to start moving too far below 285 as well, that would take us below this heavy concentration of trading activity that we've seen a rather large area here. 285 to 333 with particular importance here around 312 the point of control if we did break lower the next pocket of activity with any any real significance here between about 245 to 255. All right. George Tillis always likes to say the trend is your friend. And in this case, the trend is down 10% over the last month. As we're looking at Fedex. Your next pick you brought today is Home Depot. Also the trend to the downside as I'm looking at this chart. So I, I do want to hear how you're playing this one and it's bullish. So I want to make sure you're also feeling okay that that you've brought two bullish trades today. It had to happen sooner or later right. So you know the trend is to the downside inside of Home Depot. But you know before I get into anything, you know, technical specifically inside of Home Depot, allow me to state what I am looking for in Home Depot goes beyond what we're seeing inside of the chart. What we're seeing inside of the chart could be very supportive right around this 300 level. Again, to get into that in just a moment. What I'm looking for, though, specifically in Home Depot, is a rotation back into anything but technology. You know, there's going to be a day and I know this sounds crazy, but probably this week, next week you're actually going to see some sell side activity in AMD. You're going to see sell side activity in micron. Your sell side activity obviously in in meta sooner or later semiconductors get hit. Meta gets hit and we start to rotate out of technology back into, you know, some of the staples of the economy. One of those is witches, Home Depot. Now, why do I actually like Home Depot? Well, that is the technicals. It looks like it's actually going to hold this 300 level. And literally my trade is banking on us holding the 300 level and getting a nice pop back to the upside here. This is fairly near term. I'm going to go out to the Oct 16 expiration again October 16th expiration. I'm going to buy the 310 calls. I'm going to sell the 315 calls against it. I like to use spreads. In this case it's a $5 wide call spread for $1.70 debit. It's just a nice trade. Looking for a pop back to the upside. Look it doesn't have to be like an investment thought in here. This is just a pop back to the upside. Let's you know hold the 300 level. Get back to like you know, 3153 20. And then we'll reassess because that's all that this trade needs is that pop back. And I think that that rotation in the overall market environment is, is coming to a theater near you in the next couple of trading sessions. Well, we've got Micron's earnings a week from today. So perhaps a potential catalyst there. But as we look at the technicals for Home Depot Rick is that 300 level also standing out to you. You know what I had was a little bit more granular here. Generally speaking 300 did you know catch my eye. But what I highlighted here was these lows that we saw here. And then the subsequent breakdown at about 308 specifically, I also chose to mark 289 or so. 290 that's our low point that we saw recently. But to backtrack a little bit, what we have is kind of a similar situation to our last chart. We had a notable old high point here at 354. Then we had this same double top type of resistance that was formed here, giving us, again, this kind of M shaped pattern. Here. We had old highs here and subsequent lows here near the middle part of our M, if you want to call it that, near about 322. And then a further breakdown. So as we start to, you know, look at approaching these lows, these 52 week lows that we formed, it looked like perhaps we were going to make a test of breaking out of our channel to the upside. So if we do start to do that around this 300 level, some of these areas that could come back into focus where some of those lows, our previous lows that I mentioned here. So now we also have our five day exponential moving average just shy of 302. Meanwhile to the upside, our teal 21 day EMA, if we were to break out from our channel, is about 31275 at this point RSI improving somewhat here we have broken out of our downward channel or sloping trend line rather. And we've also pushed out of the oversold area here. So we are making did make relative highs as well during our last peak here during an update. So those are a bit more positive pieces of information here. And a name that's been rather beaten up so far. We can see a volume node here at about 300 to 305 or so. Another one up here 309 to 317. So those would be the potential consolidated areas to watch out for. All right. As we look here at Home Depot we are down about 1.8% today at 2.9989. Just below that $300 level that Don's looking for to hold with that trade. Your last one here, different chart you've got. Qualcomm is your third pick. And the trend is your friend here. I mean they're up more than 20% over the last month. So you think this run can continue. But for how long. Yeah. I'm not going to stand in the way of this run at all. This is going to be much more of a short duration trade. And I always like to make that distinction. You know, there's things where, you know, like Fedex earlier, it's a little bit of an investment to the downside. And then Home Depot is kind of, you know, mid tier. It's about a month out in time. But here in Qualcomm, Qualcomm, we're going to the second expiration. We're just going short distance into the future here just over a week. And the reason we're going to do that is look I'm going to watch you know ride the lightning pretty much in this one. And that is gamma squeeze. For those of you that are not necessarily intimately familiar with that terminology of gamma squeeze, but it really is, is you've got retail traders rushing into the marketplace buying calls, you've got proprietary trading firms buying calls, you've got hedge funds buying calls. And when you buy calls, it forces the counterparty, the market maker, to buy stock. And that actually causes a feedback loop. And it definitely appears that Qualcomm is in one of those feedback loops right now where call buying is generating again, pretty magnificent upside potential in the underlying. As such, all I'm going to do with this trade is I'm just going to buy a call spread again. As I said, I'm going to ride the lightning. I'm going to hop on board. This is an ox second trade. Remember this is a short duration trade ox. Second, I'm going to buy the 200 calls and I'm going to sell the 210 calls against its full $10 wide call spread done for a $3.10 debit. Again making this a $10 wide call spread. Because this is a volatile animal, a spread is absolutely essential in here to mitigate some of the volatility exposure. Look, if you're wrong, the worst that happens, you lose $3.10. If you're right, this thing can explode. To the upside. This trade is almost worth seven bucks in in just a couple of trading sessions. If Qualcomm actually continues on this upward trajectory. All right. And looking for a break even, that's about $7 north of where we're trading right now. So Rick as you look at the technicals and what they're signaling to us, do you also see the potential for a move to the upside. Right. So what we do have is a push above an old high point here. This peak that was formed near about 196. We are starting to push our way above that level. And to Dan's point, when the counterparty is forced to, to make a, you know, selling the call options, they need to buy the underlying stock in order to protect themselves from possible runaway losses. So this gives you more fuel to the fire for the breakout. That's what a lot of times we're looking for as technical traders here, we get the cascade of orders that triggers the stop orders or other types of orders that are triggered when a certain threshold is breached here. And then it just kind of makes this runaway price activity that can be very profitable if you are positioned correctly here. So beyond that, 220 is another area that stands out here. 179 to the downside was another old high point during our decline that we saw here. It kind of was supportive. A little further down the road, upward channel type shape is what we're seeing more recently for now, possibly even an upside breakout here that has mitigated somewhat today. We're kind of right on that boundary line of our trend line here. Our five day exponential moving average in dark blue 19232 is the closest to our current activity. For the most part, it's seeming like the trend is improving. Here we have our moving averages in the order you'd want to see them if they were bullish, with the fastest going from the slowest at the bottom. We also have our 21 day and 63 day starting to pull apart from each other here. The 63 day lines up with our lower channel boundary near 176 40 RSI not quite in the overbought area yet. That's what you would want to see if you're bullish would be a strong price breakout coupled with RSI making new highs and breaking above that 70 level. Finally, our volume profile here shows that we have moved beyond this heavy trading area that contains our point of control. We also saw quite heavy volume a few sessions ago here during our big down day here. So perhaps some buyers taking advantage, possibly at those low levels. We have now next our next volume node here 198 to about 208 to consider. All right. As we look at Qualcomm here they're down about 8/10 of a percent at 19657. Again about $77 below that break even for that trade there. Don. Always a appreciate you coming to join us for the big three. Great to talk to you. I would do a temperature check if you were here just to make sure you're okay with those two bullish trades. But I'll check ba

Comments 0
Sign in to join the discussion.
Sign inNo comments yet. Be the first to share your thoughts!