
- Rendement de la vidéo
- -3,49%
- Appels
- 3
- Achat / Vente
- 0 3
- Publié
Recommandations
L'entrée est le cours de clôture de l'actif à la date de publication. Le cours actuel est la dernière clôture enregistrée.
-
Entrée $225,27 09 sept 2026Actuel $229,30 23 oct 2026Résultat −$4,03vs. indice −1,5% SPY −0,3% sur la même période
I'm going to be buying the 220 puts and selling the 210 puts against it.
-
Entrée $147,60 09 sept 2026Actuel $145,27 23 oct 2026Résultat +$2,33vs. indice +1,9% SPY −0,3% sur la même période
I'm going to be buying the 140 puts buying the 140 puts selling the 130 puts against it.
-
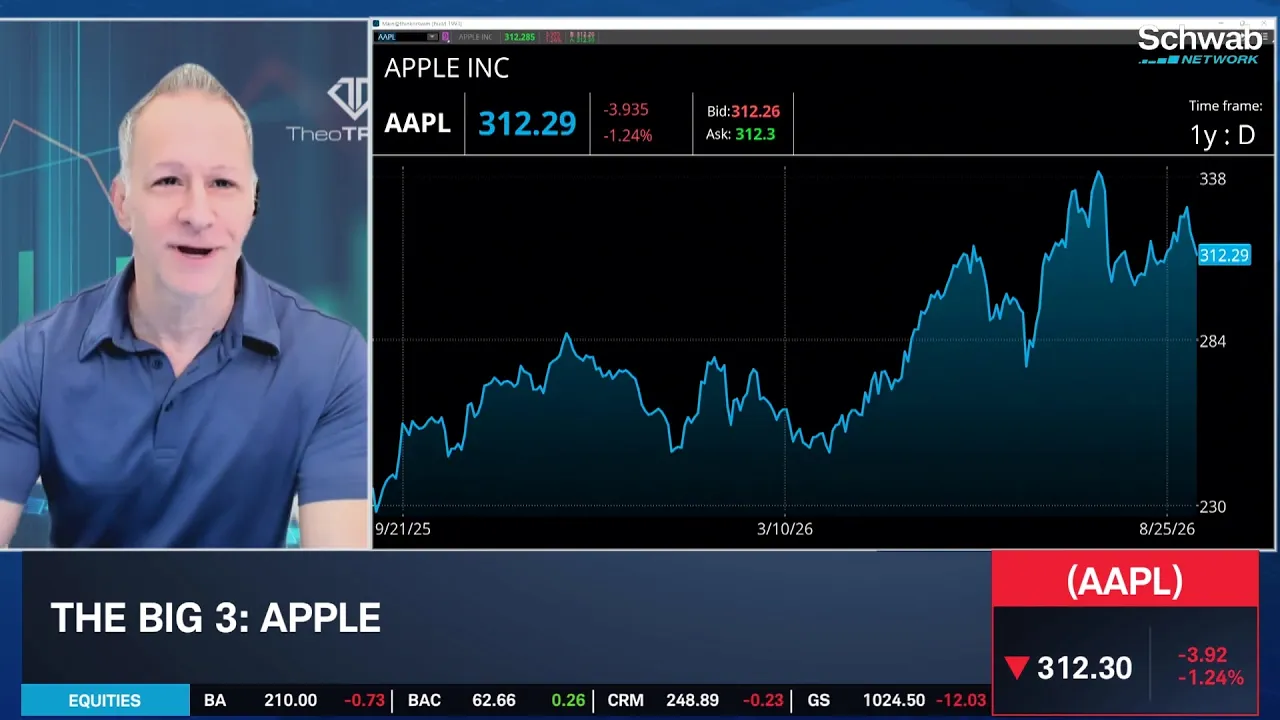
Entrée $315,34 09 sept 2026Actuel $347,73 23 oct 2026Résultat −$32,39vs. indice −10,0% SPY −0,3% sur la même période
I'm fading the flip phone.
Transcription Complète
get your podcasts. Welcome back to trading 360. I'm Marley Kayden. It's time for the big three. We've got three stocks three charts and three trades for you. Rick Duquette taking us through the charts as always here to take us through the trades. Don Kaufman the co-founder of trade. Don great to have you on. I mean, we're watching a real time reaction right now in terms of the markets and rates to the Treasury Department buying back $6 billion in longer term debt, about triple the normal level within the consensus. But about $2 billion higher than the estimate. How are you looking at this reaction. Of course it's just happening. We just got this announcement about five minutes ago. You know we've been watching it here literally since this announcement came out. Like I thought they were missing a zero off there. I didn't care what the estimates happened to be. But this is nominal. It really is nominal. And you can see how the market's reacting. The ECB is really getting tagged right now about to go through some of its some of its lows. The the Zn which of course is the is the ten year fairly precipitous sell off. I mean look, the interest rates continue kind of explode the the Treasury Scotty B and the Treasury is is there, but clearly not enough to really support this marketplace at this point in time. Yeah. Seems to be a negative. We're just off of session lows right now. But certainly seeing a dip across the board here. But let's dive into your big three. You've got Ross stores as your first pick here. They're slightly lower on the session but year to date performing well. They're up 25%. They're coming off a strong performance in terms of their earnings. But I know from looking across your notes that you brought us three little bears today, there's no Goldilocks to be found. So take us through how you're looking at Ross. Yeah. I'm all Baird up with no place to go. And you know what? That's been working everywhere. But tech right now has been, you know, taking a little bit of heat. So let's get into it with Ross stores. So one of the reasons I selected Ross Stores is this just happens to be, you know, in the midst, if you will, of some sell side activity, the underlying just recently came off of a high of 257. It's now down to like the 227 kind of handle. If you take a look at some of the peers within the group, which happen to be like TJ Maxx, I would think of something like Kohl's KSS take a look at what's happened to Dick's Sporting Goods, Lulu, which is much more brand specific. Nevertheless, they're getting tagged across this sector. Like retail is not looking good. Obviously, I can point to the other side of that with gap and a few and a few more, but specifically more in discount over here. When I look at TJ Maxx and I look at Kohl's, they're well off the highs. And I just think that this happens to be the most opportunistic trade within the particular sector. And that is going to be a bearish position because as I said I'm going to jump on trend right now. We're seeing some sell side activity, but it's not getting hit nearly as hard as, if you will, the TJ Maxx or like a Dick's Sporting Goods. Nevertheless, I'm going out to the Nov 20th expiration here in Ross Nov 20. I'm going to be buying the 220 puts and selling the 210 puts against it. So it's a nice big $10 wide put spread done for a $3.20 debit. And I've given myself all kinds of time 70 days for. There's some sell side activity to persist here. And that sell side activity, as I said, it's already begun. We're 257 to 227. If this trend continues, you know, we'll be we'll be right where we need to be for for that November expiration. All right. And I love when Rick brings us a surprise chart to demonstrate some of what you're talking about here. I mean Ross the clear outperformer in the light blue here against TJX, which is the green and down near the bottom of our chart. Yeah. But kind of a notable slide for many of these names here. Burlington stores really has taken a strong severe move to the downside here recently. So interesting food for thought here to give a quick visual. But so if we do look at Ross here's those highs near 257 Don mentioned here. But we can also see from their downward sloping channel type shape has developed. We can see then we're between those two white lines here our top line pointing downward. Just duplicate it put it across the lows. You can try to project potential support based on that. Certainly not going to work every time. Just a general guideline here. We can see a relative low here near 218 and as well as a repeated low after the earnings gap that we saw to the upside back in April here near 207. Meanwhile to the upside, a relative low became a ceiling here near 232. Another relative high near about 247 stands out as well. If we were to look at our moving averages next, we can see that price has slipped below three of them. Our exponential moving averages that we follow here are. Five day in dark blue is the closest. 22926 is where that one comes in. If we did push out to above our channel type shape, we have a confluence between our 21 and 63 day near about 234. RSI is moving lower. Here. We are below the 50 mid line. We are on the verge of breaking through our green trend line as well. So look for that to happen. If you have more of a bearish outlook as well as a slip below that 30 level for further bearishness, we can see our volume profile study shows that we have a node here between about 223 to 236. We are basically right on our point of control. Our heaviest trading area of all that comes in just below. 228 another node down here. 209 to 217 another one to the upside. 249 to 255 so we have the luxury of some very clearly defined areas of heavy trading to look for potential support or resistance. If we do get a strong directional move in the coming days. Yeah. Right now that direction, at least over the last month, is to the downside. We've had more than 11% pullback in raw stores after that runup that you just highlighted there. Don. Another one with a big run up is Merck, which is your second pick here in the big three. They came out with a really positive trial news. Perhaps we're one step closer to curing melanoma or having at least a profound treatment for it. But losing you know, maintaining their momentum. They're up about 14% but falling off of those highs. How are you looking at Merck? Yeah, Merck is actually very similar to the first trade is I'm looking at, if you will, the strongest relative to the to a particular sector in this particular case, health care. Specifically, if I looked over at like the Xlvi took a huge hit in the last two trading sessions, along with a lot of the other peers within this particular sector. So what am I doing in here? Okay, I'm using Merck's relative strength, which has been great. Okay. And it's held up and it's up about 40% year to date and it's completely unscathed. Okay. In terms of some of the recent sell side activity and that recent sell side activity, as I said, it really started to hit the Xlvi and a few of the health care stocks in the last two trading sessions. And you can see Merck completely and totally unfazed by that selling. So the relative strength of Merck okay, literally being its liability down the road is what I'm looking for. All right. So for Merck I think this one's going to be a little bit tougher. I'm going to give myself a bit more time for the trade to actually develop for that. Okay. This is not so much a short term trade as this is going to be, if you will, an investment to the downside. The options trade is going out to the D 18 again, D 18 options expiration. All right. That's 100 days out. I'm going to be buying the 140 puts buying the 140 puts selling the 130 puts against it. This one's done for a $2.95 debit. Again a very similar similar conceptual setup to what I did in raw stores, this one being applied to the health care sector, specifically to Merck, which as I said, relative strength is great versus the rest of the sector. But as we well know, you know, markets often move, you know, the sector moves and the individual stocks will then move with it. All right. And so as we look at Merck, it's just fractionally lower right now. But I see multiple sets of converging lines on the chart here. Rick. So walk us through what you're seeing. Yeah late stage failure of Novartis cardiovascular drug seems to have been a bit of a bucket of ice water on the group. But as I said Merck holding up pretty well. So here's some of our lines starting with those highs. 15692 this triangular shape is what we've seen develop recently after a big gap to the upside here. Before that, we had more of a rising wedge type shape here, which often is regarded as being a little bit more of a bearish type of setup. But as you can see, it can really go either way. What you're looking for is a breakout beyond either of those two boundary lines. Same deal here. We have now this kind of more triangular type shape. Here we have our extreme low after the push to the upside near 145, our extreme high. 15692 so if we were to move lower, some traders might be looking for the gap to be filled near about 138 or so. That's our our green lines that we have highlighted here on our chart. also find ourselves slipping below our five day exponential moving average. The past few sessions here that comes in at 14918. At this point we have our teal 21 day EMA coming in at 14562. That would represent a breach of our lower trend line in this case. So that could be a supportive area traders would be looking for. We can see now as well we have a green upward sloping trend line on the RSI here that is in danger of being broken today as well. We sit at 57 right now. So again a break below the 50 mid line would be noteworthy if we were to move beyond that. That trend line that we have there, we have our volume profile showing that there were some takers in terms of trading activity up here at these elevated levels. 148 to 153 is where the bulk of that happened. Here. Things start to pick up again much more notably between about 126 to 130 back down here. If we were to fill the gap and move lower. All right. Right now Merc is at 14765 down about a half of a percent. As Rick just highlighted there, the whole entire sector got a little bit of cold water thrown on it with that Novartis trial failure not yielding the expected result. Now, your last one I find the most interesting just because of the timing of today's event. You've got Apple as your three in the big three here. How are you looking at Apple? You're you're not going to be a user of the flip phone. The foldable phone. Oh, I love the idea. I really do. I love the idea at some $2,200. I do not love that idea. You know, I'm just crazy enough to own just about every Apple product out there, but there's no way I'm paying this $2,200 for a for a flip phone. It's just I think that that's a bit extreme. And, you know, I again, this marketplace in Apple. Look, Rick, I'm not even looking at the chart on this one. I'm fading the flip phone. That's that's what it comes down to. This one's going to be a very, very short term trade. And you know I've actually seen this with a number of some of the recent product releases from Apple. So major product release comes out. The marketplace kind of absorbs it has a little sell side activity after it. That's really what I'm going after over here. But again, the price increases. Look, I you know, I've never said this before, but when it comes to a, to a phone, a thousand bucks, I can swallow that maybe 1200. Let's get crazy. But when you start talking about $2,000 for a phone, I'm out of the contest at that point. With that, I'm going to go out to the Sep 18. That's not that far out. Right. So Sep 18 it's going to be a rather short duration trade. We're not talking 0DT but about a week out I'm going to be buying the 310 puts buying the 310 puts selling the 305 puts against. It's just a nice tight $5 wide put spread done for $1.40 debit. Just a little sell side activity. Look. You may see a pop after this announcement, which should actually make this trade even more advantageous to get into. But the the truth is I want to fade a $2,200 flip phone, which, by the way, is unfortunately, it's a little, you know, too late if you haven't looked pretty much everybody out in the Android side already has that. Not saying I'm Android, I'm not going to go that far, but I'm not thrilled with the the price point on this Apple product. All right. Fade the flip phone. We're going to talk a lot more about this foldable phone in our next segment. But before we get to that, let's take a look at the technical setup coming into John Ternus first event as CEO. I can certainly see the thinking behind all this. I'm personally quite curious to see what becomes of Siri. I don't think I'm being unfair or controversial if I say Siri has been a laggard among AI helpers here, to put it mildly. But we can see here 34457 was our high point that we had shortly before our last earnings event, which was July 30th. From there, you could draw a boundary line going along these subsequent highs that we formed. Not really a trend line yet. A trend line would connect three or more points. But in this case, you could say that we have a upward sloping channel that did develop after earnings. We hit our lows that we established here near 300. We had some relative lows that were formed near 313. But today's price activity, we're dipping below the channel and we're breaking through those relative lows. So not really the greatest setup here. If you're having a more bullish outlook as the the day is still quite young though. We still have this event coming up. So a great deal could change from there. But not the most encouraging setup that you could see here. 330 was where we had our gap. That gap has been filled. Another small gap here near 337 would be two of our notable upside areas to be on the lookout for. If things do start to turn around now, we can see that we have slipped below our five day and 21 day exponential moving averages. Those come in at about 316, 317 or so. We are also approaching our 63 day exponential moving average near 310 to the downside. That could be a supportive area. The longer term, the moving average, the more significant it is as a source of potential support. We have also broken out of our green trendline on the RSI, slipping below our 50 mid line as well. So this is starting to develop into more of a bearish technical situation at this point. Now we can see here again we have some very distinct nodes on our volume profile study here 308 to 314 is an especially heavy trading area here. Another smaller pocket of activity here 295 to 300 as well as a very slight area here near 330. All right. Right now Apple is at three 1240 down about 1.2% as we prepare for this event, which will kick off here in about 90 minutes or so. But we of course will be listening. Don. Appreciate you joining us today for big Three and being wit
Commentaires 0
Connectez-vous pour rejoindre la discussion.
Se connecterAucun commentaire pour l'instant. Soyez le premier à partager votre avis !