
- Video return
- —
- Calls
- 1
- Buy / Sell
- 1 0
- Published
Recommendations
Entry is the asset's closing price on the publication date. Current is the last close on record.
-
Entry $3.14 28 Sep 2026Current $3.14 28 Sep 2026Result +$0.00vs. index −0.7% SPY +0.7% over the same days
Cite this call Watch source segment (894s) *
Surrounding source transcript
… that. There's too much good news ahead. The charts are basically more positive than negative, and it's really cheap. We have some institutional analysts projecting anywhere from $200 to $1000 an ounce and one ounce sharese next few years. But as a trader, I'm a buyer 'm long here and I think you can trade it and add if it does see ae bit more of a setback. All right, Rick, space mean, they launched their Starship rocket into orbit for the first time. I think t ed about 26 different satellites into orbit as well a success there. What are the technicals telling us on space X though. And of cou…
But as a trader, I'm a buyer 'm long here and I think you can trade it and add if it does see ae bit more of a setback.
AI-extracted context But as a trader, I'm a buyer 'm long here and I think you can trade it and add if it does see ae bit more of a setback. All right, Rick, space mean, they launched their Starship rocket into orbit for the first time.
Full Transcript
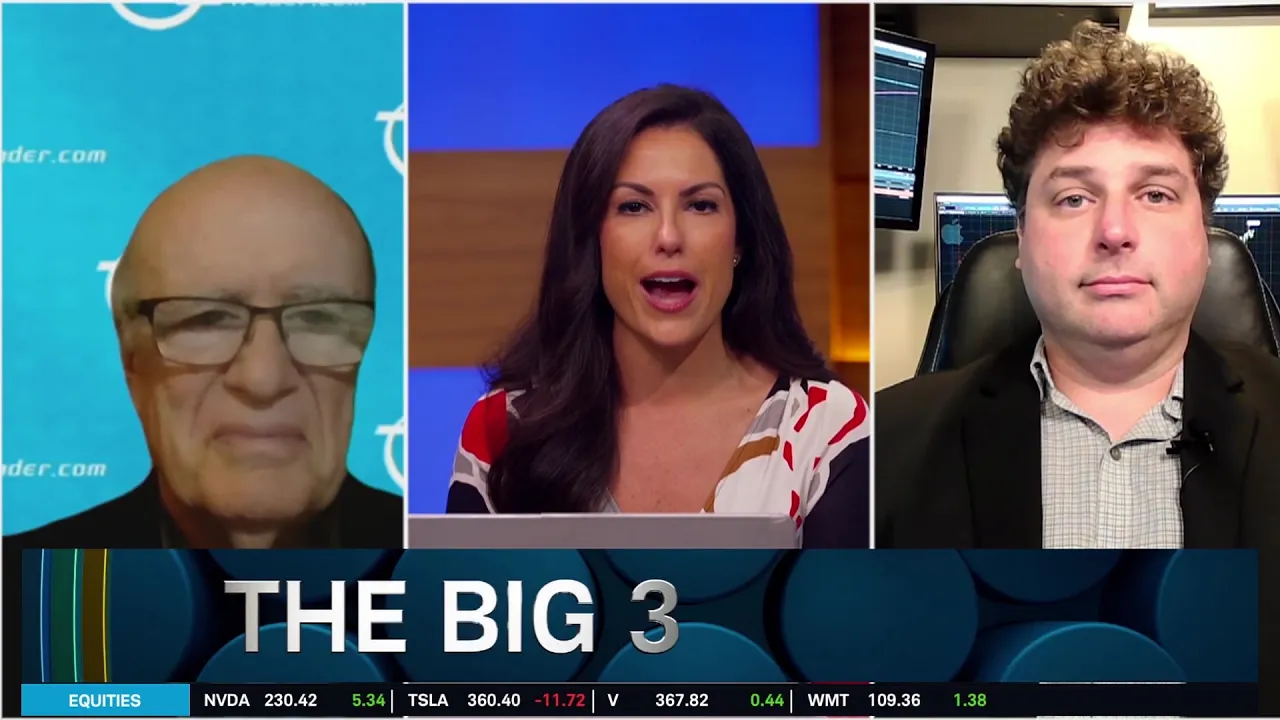
Welcome back to trading 360. I'm Marleyden. It's time for the big three. We've got three stocks, three charts and three trades f. Taking us through the charts here to take us through the trades today. Ast strategist for VR trader.com. Mark great to have you you for joining us. Before we dive into your picks for the big three, I woue to get your thoughts on the market action that we're seeing today. This mothe downside tech being pulled down yet looking at Nvidia still up about two and a third percent. Well my forecast model called for weakness this time of year. I don't know whether we're going to show that visual or not. But we put that out every year. It's based on cyclical analysis and my volume work and a whole bunch of historical history seasonality in the market. So and we're also, as you know,n af divergence in the other major ETFs, the Dow transportation average, the mid cap index, the l 2000, even the Dow industrials. So there's been warning here for actua few weeks that we're headed into some type of correction. Of course there's a lot of worrying about the midterm elections and so forth. S a trader you know I've been really cautious. I know they're painting the tapeh Micron and Nvidia and so forth. But this has been the case up to this point. And frankly, when I see a company like Nvidia buy back their o shares versus investing in their business, to me that just financial neering s enthralled with the video when it starts doing stuff like that. But regardless, the cycles are saying the tape action hasn saying, and I'd be cautious. Many people say, well, this is ob September, October, you could get a correction and so forth. So maybe just the seasonality cycles work out. And that seems to be what's happening until we get a clear positivegence in the other indices, particularly the Dow transportsnd Russell and so forth. I'd be careful. All right. So let's dive into the big three then. Your first pick you've brought for us is the bi XRPETF the ripple ETF here. How are you looking at cryptocurrencies specifically XRP very bullish. We had a cycle top in Bitcoin fall. It said we got we can go through anywhere from a12 month correction. We saw that. It's clear that I thinkcoin has bottomed. And I'm looking for new all time highs and may takee time. But you know above 126,000 maybe even as high as 200. You know this could be a year or two comment. But you know, we had a year correction in it. So I'm a bull. XRP is a whole other animal. XRP is a new institutional favorite payments, execution, liquidity,in of variables are what XRP is providing. It was as high as 360, oh about a year and a half ago, got down to about $1. Just a few a couple of weeks actually. And now it's turned up again. I mean, I know it soundsittle crazy, but my target for XRP, which is now about a buck 50 is $26. And that could be, you know, a year or twors. But even if it's three years, that's a tremendous potential opportunity. A lot depends, course, on usage. There was a little delay in the Senate, as you with the Clarity Act. But at the same time, the CFTC td make it more useful. So at and buck 50r lower, I would just accumulate it and hold your breath. I thi huge. And even the 26 target could be very conservativ I can give you numbers that sound crazy. acceptability congressional action, usage. But this is not a short term dayde play. I mean, there have been some great trades in it. If you were g itself, it got down to $0.99 within the last couple of wee Rallied up to a buck 59. I think now it's around a buck0 if you're in the XRP trading. And of course you don't have to do XRP crypto, you can do the ETF and is about 6 or 7 of them. You can choose from. One of my favorites is just the ticker symbol XRP. A it trades around, I think it's trading around.40 a share today. If I'm right, obviously that could be a 50 or $60 stock, if not more in the next couple of years. So that's opinion. All right. So let's dive into the technicals here. I meanrk st $1.48 today. But crypto overall taking a little bit of a bath in the session today. Even XRP the ETF that you like Mark is down close to 6%. So Rick take us through what you're seeing in the technicals and a potential for the move higher here. To be sure crypto is kind of known for fluctuations here. When we do look at our chart specifically, what we can see is that we have aising wedge type shape here. Between our two white lines, we can see that one begins quite close to those lows on our ETF of 1108. We can also see a more modestly slopin boundary line going across those highs. Our red line there. Our f red line 1730, is also quite significant to me because we have topped out there multiple times. We recently brokebo We've seen some fluctuation back and forth as price k of struggles to retake that level. But for now, we remain a little bitow that. That seems like a crucial potential tipping point. Our second red line at 22 represents a roughly where we had a gap o up from earlier in the year back in January or so. Meanwhile, to the downside, $14s a relative low point that we saw that is giving us our trend basis there. We also have a gap 12 to 1330 are two lower green lines there. To look at our next chart, we have quite as much of a full year of data here. So what we do have olive colored 20 day simple moving average coincideser closely with our 200 day simple moving average in purple there right a 1590 or so. So that gives us a notable supportive confluence there. We can also see RSI. Ourre of momentum has been trending lower but remains above the 50 mid line.o the bullish signal would be a break above that downward sloping trend line. bea break below the 50 mid-line e. Fe profile study shows that we have a significae and accumulation of trading activity 15 0, with our point of control coming in at 1533. S again, this would be a very crucial supportive area to th downside to the upside. We have another small pocket of activity 2080 to 2180. You can see that highlighted area to idet another resistance Consolidative c Mali. All right so as we look here, if we're just looking atRP ETF, it is close to 6% lower on the n. If we're looking at the actual cryptocurrency we're down about three and a quarter. But all of the cryptocurrencies lower on the session today. Let's talk a physical asset here. We've got gold mark as your next look that taking today. Lots of ways to play gold. But what's your overallsis right now on gold? My last guest said he'd be buying this dip. Well, you know, hope you're sitting down because I came out w report and apparently others have picked up on it as well. My big picture target is now 38,000 in gold, maybe even as high as 140,000. Of course, this could be a 4 or 5, six year comment. But basically, you know, we can talk about the US debt. We talk about the of interest that's being paid on the debt. It's really unsustainable. What's going on. We've got a trillion a year for Social Security defense. And you're paying 2 trillion a year only on interest. So my calculation really got down whether we're going to take the 40 trillion in debt that we really have out there now, and dividing it about into the 261,261.5 million ounces that suly the US government has. And that comes out, believe it or not, to $152,000 an ounce. If we're going to take a settlement and we're only going to use a fraction ofr target of 38,000 to 40. So I know it sounds off the charts. I think the unexpected can happen. There's been a lot of discussion about the revaluation of gold, continued weakness in the dollar, I think is is a given considering ra Secretary Benson's beenssing out there buying bonds now potentially now up to six, six,e numbers are just, you know, off the charts here. And I think it's unsustainable. The US government is can't afford over 5% interest rate on its debt. And if you rr, even back in the 19 1980, when Volckers ie surged to 20%. You had that huge surge in gol to $800 at that time. So higherates are not bearish for gold. I know it's down today. I think it's a technical effect. It could be even on manipulation. There's a lot of that going on. And suppressing of gold's been going on for decades. There's the court cases you can refer to. We don't have to get into all the details of you,tGPT. And you can see what's going on. The gold market over the decades. But I think technically, you know, if yo say, well, if ithe chart doesn't hold the 3900 area, maybe get to that ultimate 3600, but it's irrelevant if you're looking for the kind of numbers that I'm looking for and also the shares, you know, names like Newmont Mining and other are printing money, you know, gold at these levels. And they pay stoe Newmont actually pays a nice dividend. So, you know, trading basis, I'd be accumulating, nibbling here if it does drop a little bit more into the 36700 ra don't think it will do it, but it could look at the charts,d t, hedge against the the debt. a It's a hedge againstess in the dollar. It's a hedge against government ag And you know, I just think it's it's the ultimate source of s Silver is a similar synergistic play. But gold is the playing play for me. So we're buyers on any weakness. We've beening gold since it was 1100 back 20 2021. So we're in there. Well we've certainly made a nice move up from 1100. 800 plus percent move to thean upside. So take us through what you are seeing in the technicals. When you look at gold futures right. Toook at kind of the more recent trend here the shorter term pic Remember the long term picture. The short term picture can be quite different. So what I'm going to focus on is just the past couple of months here youcd sloping trend line that has been broken afterce failed to overtake those previous highs near 4760. Kind of our our pink colored top line there of our red colored g there. So from there we have formed a downward sloping channel type shape between our two white lines. We can see that today's drop off has taken us below our first lowest red line, 4285, representing some prior lows. It kind of looks like a head and sho type of pattern here as well, where we have our our shoulder shape on thet side, around the 4500 level, our head in the middle where we tout at those previous highs. And then we have seen a decline from there, certainly not a guarantee that these things are going to work out. Just pointing out a c pattern that I that I noticed there. So today we find ourselves starting to potentially slip below the lower level of that channel. Our first potential supportive area that really stands out our green line 3960 quite, quite a ways to the downside here, but just basing it off of our old horizontal levels of interest. Beyond that, we have our 52ek lr ago at 37, 8550. So today's the past week or so ofce activity has brought us below our moving averages that we follow. They are alui close together. Given the scale of the chart. The most important one, our 251 day EMA in orange, 4269 is where that coe trading year. We can also see RSI. Our measure of momentum has been trending lower. We are trend line sloping downward is still in play. We areapproachind that represents the oversold area.ly, our volume profile shows that we have the most significantolume area to the downside 37, 39, 70 to 4113. With our point of control at 4044. this is a notable area in terms of our trading actire we could find a foothold for the bulls if we do move lower.ll right Mark, we're a little tight on time here, but I want to make sure we get your third pick in. You've got space and we're just about back at the pricehat it opened at on its first day of trading. So how are you looking at sight now? Well, a lot is contingent upon, you know, a lot of the developments in the company. I don't know if we have time to go over the various flightsarious events that they have coming up between now and mid-October. But, you know, lookithecharts, y work of close to up to about 165, 170. I know they came out with some decent news today on the on the 14, the space space X 14, liftoff. The charts say you have suppo a that. Oh, worst case, I think around the 135136 is where it originally, as you know, was offered as a public deal. So a lot of it is news related day to day. It's one of my favorite trading stocks. I mean, it'll move 5 or 10 points. And if you're a trader you can catch some nice intraday moves. But I'm pretty much positioned for a move through the 155 high into the mid one 60s toward 170. And realizing that, you know, I guess we can get caught in a sharp correction down in the mid one 30s. But I'm betting heavily on that. There's too much good news ahead. The charts are basically more positive than negative, and it's really cheap. We have some institutional analysts projecting anywhere from $200 to $1000 an ounce and one ounce sharese next few years. But as a trader, I'm a buyer 'm long here and I think you can trade it and add if it does see ae bit more of a setback. All right, Rick, space mean, they launched their Starship rocket into orbit for the first time. I think t ed about 26 different satellites into orbit as well a success there. What are the technicals telling us on space X though. And of course we don't h full chart to really look at here as they haven't been trading for a yeart line up with some of the things that I was focusing on as well. To start out with, you can see the 130 levele. Our second green line on our chart lines up with the high after we saw a gap to the downside and then subsequent lows. So you can see hat was one of the levels that that we just discussed here. Meanwhile to the u our second red line that's at 157. But kind of thad represent a break above those recent highs that we established. Then finally the upper red line 172 40 was a ble w from back in late June. So I had my many of those same price areas as well. Our movingrages here, we are very close to our 20 day simple movingge. drifting below our channel shape there. That was pointing upward her But for now kind of just hanging onto this moving average. Our 50 day SMA is a 136 40 to the downside, RSI still above 50 as well. The volume in here is between 136 to 158. Kind of overwhelmingly one 5029 is our p of control very close to there. If we start to get too far above 155 or so, you could see fast moving prices due to the light tradintory. All right. And today, despite that successful og lower, we're down with the rest of the market about two thirds o
Comments 0
Sign in to join the discussion.
Sign inNo comments yet. Be the first to share your thoughts!