
- Video return
- —
- Calls
- 1
- Buy / Sell
- 1 0
- Published
Recommendations
Entry is the asset's closing price on the publication date. Current is the last close on record.
-
Entry $70.84 21 Sep 2026Current $70.84 21 Sep 2026Result +$0.00vs. index +0.0% SPY +0.0% over the same days
Cite this call Watch source segment (2162s) *
Surrounding source transcript
…n things in. He says if they have to Dom. >> All right, Megan trying to identify the toolkit here for AI. Thank you very much for that. Welcome back to the halftime report. We are now here with final trades. Bin Talkington to you first. >> Uber. I like the stock at 70. has a trade a trade between 70 and 78. So, I think it's a good entry point here. >> All right, Uber for uh Bin. Jim to you. >> Well, I'll be honest. I delayed my final uh trade until I heard what Mike Seni had to say. And based on that, I'm going with Micron. I mean, similar to Qualcomm, where this has been an unloved …
Uber. I like the stock at 70. has a trade a trade between 70 and 78. So, I think it's a good entry point here.
AI-extracted context Bin Talkington to you first. >> Uber. I like the stock at 70. has a trade a trade between 70 and 78. So, I think it's a good entry point here. >> All right, Uber for uh Bin.
Full Transcript
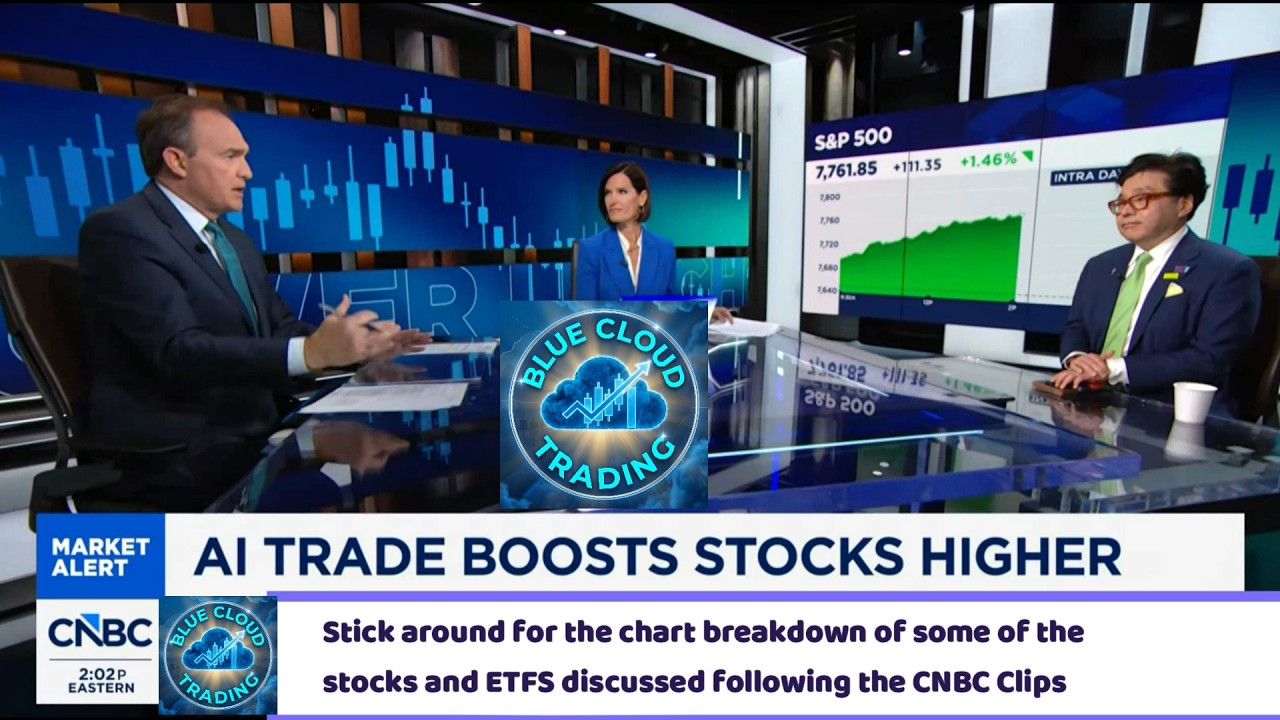
Blue cloud trading [singing] through the night. >> Welcome [music] back to the channel everyone. In just a second, I'm going to play a few CNBC clips from today's episode of the halftime report. I'm going to pull up the charts and dive into the technicals of some of the mentioned stocks. We're going to look at the key support, resistance levels, momentum, and see if the price action actually backs up what the talking heads are saying. Hit that like button, subscribe if you haven't already, and let's roll the tape on the first clip. Oil prices and bond yields down, stocks up. That pretty much in a nutshell is your story. Welcome to Power Lunch alongside Contessa. I am Brian Kelly. We'll be back tomorrow. We are seeing stocks rallying across the board to begin the week. But maybe more importantly, it's which stocks are leading the charge. Many AI and tech names surging today as the market looks to be moving on at least for a day from fears of overregulation. We'll talk more about it. And speaking of AI, a lot of the players responsible for powering the AI buildout have struggled the last few months, or at least their stocks have. Why are they going down while investment in the space is going up? We'll talk to Morgan Stanley's Steven Berg about all of it a little bit later this hour. [music] Plus, to regulate or not to regulate AI, that's the debate. We'll ask tech investor and entrepreneur Peter Damedis to weigh in. >> All right, so we've got a lot to do. Let's start with what's going on today. in that kind of out of nowhere we got this sort of semis soaring stock market today the magnificent seven those seven big tech companies have added about $500 billion dollar worth of market cap and that brings us to the big question to begin this hour is this the start of a new run for the AI trade well your first guest thinks it's the beginning of at least a face ripping rally to end the month let's bring in fun strats head of research Tom Lee also a CNB N contributor today. Certainly is kind of a face ripper. Not not just with stocks, with crypto as well. We'll get to that in a minute. Was there a a catalyst? I missed what happened. You know, Brian, I think last week was maximum pain, maximum pressure because we had a Fed hiking very hawkishly and we had high oil prices and rates high. And as you know in the last few days and over the weekend oil cooled and rates are behaving and now we have a maximum hawkish fed that could walk back. And so I I think it is all the ingredients for a face ripper especially given how oversold we got >> is is what's what's and I'm I'm talking my book as the energy guy. I get that. But like is how much of a deal is oil's decline because it brings bond yields down. Bond yields have been following oil. So oil goes down, bond yields goes down, stocks go up. Is that is that kind of the formula? Yeah, I mean it is because you know if you look at the CPI components that are still elevated like airline fairs and transport services, those are all energy related. And you know last week the JP Morgan report about how they don't even have a base case for oil kind of just told everybody oil is just high and and deal with it. And I think that was a maximum pain point too. >> And and are you factoring diesel in there too? Because when you look at the price of diesel and and it was shocking for me even filling up with unled to look over and see the price for diesel above I think it was 680 when I saw it 681. >> That's shocking. And I'm hearing from completely unrelated industries casino industries guys are worried about what their construction costs are going to be because of the the trickle down impact from diesel. >> Yeah. And diesel as you know is widely used as an industrial fuel. I mean, so, uh, yeah, it's a it's a problem. And if there's shortages, you can't really substitute diesel. So, I think there are valid reasons for why people should be concerned about energy. >> Yeah. But today, they're not. I mean, today the AI trade is back in full. And we've got Steven Bird and Morgan Stanley coming up a bit later on in the shower. Let's shower. [laughter] >> That would you know what, Stephen Bird? I mean, hey, no, let's let's add another voice on this big market. say Jay Woods of Freedom Capital Markets, also a CNBC contributor as well, will join us on the show right now. Jay Woods, thank you very much for joining us. I know in your heart of hearts, you are a technician. You love the charts. So, was there again some sort of a trigger, a catalyst that caused today kind of came out of nowhere? >> Yeah, it did. And it's technology. I I just wrote a piece this weekend and I called the market the ultimate tease between the bulls and the bears. this 7,600 level. We broke down from it last week after the Fed. We rallied back. Now we're breaking out. So you have to look as Tom was talking about that leadership. The MAG 7 breaking out to new highs. Then you look at those stocks that can take us to a face ripping rally. Uh we've got them in play. Now here's where I want to throw a little cold water on this face ripping rally. Uh energy, we're down one day. Nothing has changed. To your point, what has changed today? Nothing. We are risk on. There is hope. the Trump cheese summit goes well. There's really nothing on the earnings front this week unless you count Cracker Barrel and General Mills. Costco is interesting, but next week is where we're going to really see where the rubber hits the road when Micron reports. Micron is a stock, one of the top 10 in the world. That has another 10% to go. I think that and these semiconductors along with the software rallying together today uh will get us back to this old high around 7,800 in the S&P 500. But I don't think we're going to have enough momentum with technology alone to get us to new highs and get us to this face ripping rally. Uh it's a good rally, don't get me wrong, but not to the extent as we go into the midterms where we should be all, you know, all in in this market. >> Yeah, I mean I I'd agree with Jay. I think that there is fuel here. I think maybe where I'm going to disagree is I think sentiment is still quite bearish. You know, last week AI had a plurality of bears. you know, majority, which is basically rock bottom sentiment. And I know our clients were derisking. There's been a lot of d-risking because they don't want to be buying stocks into a rising Fed. So, I think people are off sides. I I think that this is the potential to take the S&P um above 8,000 before the end of the month. >> But, but you have AMD hitting a$1 trillion market cap today. You've got Meta up 25% this month. Intel up 35% this month, and the last time I checked, it was up 11% today. So what what gives you the confidence that there's still room to run here? >> Well, I mean these are examples of names that people wrote off since end of June saying, "Hey, these are large names that AI trades over." And then look at how explosively they moved. There's still a lot of names that have a lot of catching up to do. And you know, AI stocks are still below their June highs. So I I not only do I think there's leadership coming from there, but as you know, crypto moves typically lead S&P moves by about a month. And you know, crypto made a pretty big move in August. And I think that's why we're seeing equities in September. >> You know, uh Jay, I've got my my Power Insider newsletter coming out tomorrow. And my theme this week is kind of like I don't know anything. I mean, that's basically it because we don't no one no one does. JP Morgan admitted that like we we have no base case because we don't know what's going to happen tonight or tomorrow. If we see some reescalation, I know it's a big if. If oil prices were to go back above 100, would this kneecap, this mini rally or whatever you want to call it that we're having? You heard my question to Tom. How much oil and thus bond yields matter right now? >> Well, I I think technology is still the place to be and it can deal with some of these higher energy cost, but when you look at the market, it is a confusing market. So, you have to go where the puck is going. And right now, when you look at the charts, which we do, we're seeing breakouts in these big technology names. The cyber space looks phenomenal. Look at a stock like Zcaler which I wrote about on CNBC pro last week. It is just breaking out room to reverse. Then the leadership crowd strike PaloAlato. So there is great room to go in this technology trade. But overall the market breath is weak at best. The AD line in the NYSC has broken down. 25% of the S&P 500 is uh making new lows compared to what we're seeing. It's actually 5% making new lows today uh on a four-week basis, it's 25%. So there is underlying weakness that while we were treading water in those MAX 7 names and they're lifting us today, I don't think this is all right, all clear. Let's let's buy anything with this symbol kind of rally. Uh but I think the tech has more legs to go despite what we may see coming out of the energy market. >> It's interesting, Tom, when you bring up crypto as a prognosticator. If we're going to talk a little bit more and dive into crypto, you hear you have Bitcoin up almost 6% at 85,975. That's the highest since January. Uh Ether now is at 2746. It's up four and a third. Is the crypto winter behind us, Tom? >> Yeah, the crypto winter looks like it's largely over. I mean, it may be a couple weeks early. Crypto has had immense headwinds. Clarity Act failed. interest rates are rising. Uh there's been uh some high-profile disappointments and yet crypto prices are up. I think that's the ultimate bottom signal when you rise on bad news. >> It's kind of like your thesis about the market where everybody seems like they're bearish, which may ironically be the ultimate bullish. >> That's right. The last seller probably sold last week or repositioned last week and now we have a face ripper. Maybe a couple days delayed. You know, I was expecting it earlier. Quickly, how much are you paying attention to the midterm elections? Not as a citizen, but like as a market guy, November 3rd, I mean, that's not that far off. And some people say, "Listen, could this be the election that sort of hits the rally where people maybe take some time off ahead of it because they just don't know how it's going to turn out?" >> Yeah. Um I I heard your segment earlier with the Wolf strategist and he thinks the Senate stays Republican. You know, the prediction markets have been very good with elections and they're talking about a flip. I think that the market is pricing in a Democratic sweep. That's probably good news for stocks because it means gridlock and markets like prefer gridlock over trifectas. >> Well, and even the prediction markets might have uh a rude awakening depending on who stays in power in DC and and how the administration goes toward what does that mean? >> Well, there's bills right now pending in Congress that would significantly restrict what prediction markets are able to offer for markets. Plus, there's the whole legal case that would take those out. So, we'll have to wait and see whether elections, as some lawmakers have suggested, get stripped out of prediction markets and cryp and there could be a different reckoning with crypto. There could be a different reckoning with AI. So, Jay, let's ask you the same question. When you look at what's coming down the pike, where we are now in September versus a month and a half from now, how are you factoring in your uh your particular investments? >> Well, I agree with Tom. gridlock is actually a great thing for the market and seasonally uh we're going to see the market continue to go higher. So I I think we're set up for a good yearend rally and to kick off the year fine regardless of what happens in Washington uh if it's all democratic or total split. Um and to his point on Bitcoin, I I I think that broke out. It put in the perfect bottom. So I think that is a great place to be even if we get some turmoil in the market going into the elections. Granny Shots, Tom Lee, give us a couple of uh specific investment ideas that you love right now. >> Uh well, you know, I think a good intersection right now, which is uh long AI and long financial services, disruption in crypto, would be a name like Robin Hood, you know, which uh is really a forefront really techforward company. That would be one of the names. And then of course we like Nvidia because Nvidia is still undervalued and it is the single lynch pin for the AI trade and it's 16 times earnings. I mean it's cheaper than the market and of course one third the multiple of cost >> and Jensen Wong thinks that there is not going to be an end to the world. So here's he's an optimist. We'll have to see what >> Yeah. humanity will survive. >> Yeah. That's always the >> that's now considered an optimist that we're all not going to be wiped off the face of the world. >> That's a contrarian take now. Right. >> You know who's not an optimist? Everybody sitting at Newark airport right now. >> We have some Yeah, we have some bad news coming in. Hey, thank you Tom for joining us. Thank you Jay. Appreciate that. >> All right. Thank you very much Carl. Thank you very much Kelly. Welcome to the halftime report. I'm Dominic Juian for Scott Wapner. The market rally is front and center this hour as [music] stocks soar and yields fall as we kick off a new trading week. Our investment [music] committee is standing by to break down how they're playing it and what it all means for investors. Joining me for the hour are Joe Terteranova, Stephanie [music] Link, Jim Leventhal, and Bin Talkington. Let's get a check on the market right now. I I talked about the rally here. The Dow's up about a half a percent up 220 some points, 51,903. The S&P 500 up north of 1% at this point, up 85 points to 7736. So trying to creep back towards that 8,000 mark. And the Nasdaq Composite, the tech heavier side of things, up 1 and 3/4%. That's worth 455 points to the upside. That composite index currently sits at 26,978. So let's kick off the conversation now with just what exactly is driving the positive sentiment after we saw a little bit more volatility over the course of the past week. And Joe, I will start with you for this one here. From a macro big picture perspective, are the markets feeling constructive for what we've now said a lot is a seasonally weak time for the market. >> Two words, risk on. That's exactly what we are seeing right now. Uh before we began the show, I had a conversation with Stephanie, I said, Steph, in the near term, we are seeing really positive momentum that suggests we could advance rapidly right back towards the S&P all-time high from August. Steph made the excellent point. And guess what? Sentiment is really bearish. So, it kind of aligns when you think about sentiment and positioning, which moved to be somewhat defensive heading into the Federal Reserve meeting. Maybe markets are a little bit caught off sides in that regard. You have the pullback in oil. You have yields relaxing. You've got past the Fed meeting that looks like we have a near a near-term low in place from that day. And guess what? After that Fed meeting, we talked about the meeting bringing clarity. You didn't get the response in bond yields that speculators wanted. Remember, speculators went into that meeting short treasuries thinking that yields would spike. You'd see the 10-year go to five and a quarter percent. You didn't get that. That basically was the moment where if you were short treasuries, you kind of had that exhaustion. So, we now have a very significant technical price gap for the S&P 500 Friday into today. semis higher software higher which is a rare formation in the near term the market has just established some really bullish momentum >> so Stephanie it's an interesting point because when we talk about a possible repositioning that's happening right now given the bearish sentiment going into Jackson Hole going into this Fed print the last time we had an interest rate meeting this past week there's a question about whether repositioning has legs because often times repositioning can be a very short-term to maybe medium-term phenomenon and then we kind of consolidate and go back to where the trend was before. Is this enough to clear the decks to make room for constructive moves to the upside given maybe repositioning in places in the market like treasuries? >> Sure. I mean like September is the worst month of the year. Um but that follows then October and November are the best two months of the year. So maybe September can continue to be volatile to kind of answer your question. Um I wouldn't be be surprised. But back to sentiment, AAI numbers are at a year low. I mean that they're a year high. Sorry. And that is just really really negative. Um the economy is still doing well in the face of all this negativity. I mean last week retail sales we had the weekly jobless claims are historically low. They remain historically low. The consumer is clearly spending. The Atlanta Fed tracker is running at 5.1. So in the face of all this negativity, we're still growing. And why do we care? We care because earnings are actually continuing to be revised higher. Multiples have come down from 22 times to 19 times. That means it's a little more attractive. Um, and credit spreads are very, very tame. And I just don't think 25 or even 50 basis points in terms of a Fed hike is really going to damage the economy. So, it just goes back to if the economy is good and earnings are going higher and to Joe's point, risk on is out there. I think you want to really be looking at opportunities in September. >> You know, Jim, the other thing that's curious about the move that we are seeing higher right now is this notion that the leadership here is the leadership that we had been accustomed to talking about for the better part of the last decade and that is mega cap technology, media and telecom stocks. Those are the ones that have assumed kind of a new leg higher in this last move that we've seen. The MAG 7 ETF to that point hit another record intraday high in trading just today. So I wonder if we talk about the broadening out rallies being healthy, something that's constructive, and then we see once again that there's a certain maybe 10 stocks that are powering a lot of this move higher, is there something to be worried about if that broadening out thesis is not necessarily the primary focus for traders going in the next 6 months? >> I don't think so, Dom. It's an excellent point to raise, but the reason that I'm not that worried about it is because these rotations, as we've all seen, from the mag 7 to the other 493, from growth to value, and back again, have happened with such rapidity that I wouldn't be surprised if a week from now we're seeing just the opposite. It wouldn't surprise me at all. And the reason that that may happen is because, you know, much as Joe was just talking about technicals and Stephanie, you were talking about sentiment and then you got into fundamentals. The fundamentals are really strong to support the broadening. I mean, let's just start by talking about you, Stephanie, you mentioned the Atlanta Fed at 5.1%. And let's pair that with unemployment at 4.1%. Let's pair that with profit growth at uh, you know, roughly 25%. And if we look at next year's S&P 500 numbers, we're trading at 18.6 times. Now, here's the important part. As we go through the back half of this year, it's the other 493 stocks that are starting to increase their earnings acceleration as the MAG7 starts to decrease. Let me be very clear about what I'm saying. The MAG7 growth rate of earnings is still spectacular. There is no question about it. But it is coming off the boil just a little bit. And as that happens, that's allowing the financials, the industrials, materials, and energy stocks to really start accelerating. And that's the basis upon which the rally should broaden. Even though Dom, as you pointed out, the last week it's been uh it's been the technology mega cap stocks that have done it for us. Look at Meta. Wow. I mean, what a run there. >> So, you know, it's interesting because I'm I'm watching Bin right now and she's been nodding and kind of focused in on a number of points that you guys have made in the last 5 minutes. She wants in. So, [laughter] I want to maybe I'll kick it off, Brenn with my question to you being, would you be focused on the top 10 market cap stocks or the other 490 and then you can go from there? >> Okay. Well, since I own the Q's and RSP, I would say yes and yes, right? So, I think I own both for the reasons Jim said and also, you know, many other many other things that everyone said. I will say going back to Joe's two words, I was thinking my two words for today are oil and yields. And we've seen this very high correlation this year between oil and yields. And so as oil goes down, yields go down, stocks go higher. And so I really think in the short term, this market is going to continue to be very anchored on oil because if oil goes back up and this war reescalates, yields most likely will go higher as well. I do think it's important for investors. I mean, if you go back six and a half decades between the August highs and the midterms lows, we've had a draw down every single time between seven and then the extreme 25%. So, I don't know why that would be different. Maybe it will be, but I do think this time that if we get this draw down, which you really haven't seen, that is going to be a great time to add to positions because what happens after mid times midterms is like between November and February are the best times of the year post midterms. So, I do think investors need to be, you know, aware of that midterm seasonality, which has a perfect track record of having, you know, pretty significant draw downs. But then I would take those draw downs to add to positions on both RSP and your Q holdings because to Jim's point the breadth of earnings is is also strengthening. But also Nvidia, Micron, etc. are still making up a huge part of earnings growth. And so I want to, you know, be positioned with those types of names in my portfolio as well. Hey, hey, John. I just want to key off what Bin's saying here because we all obviously were pretty optimistic on what we're seeing, but there's need for balance here and Bin points out what's going on with oil and rates that may have a lot to do with events going on in New York City this week. Last night you had uh vice uh chairman he of China and Scott Bessant, the US Treasury Secretary meeting. And the verbiage that came out of that was very positive. We've got the Iranian president uh speaking, I think it's tomorrow at the United Nations. We've got President Xi and President Trump uh speaking together having a summit on Thursday. And now there is a lot of positivity that is expected and perhaps being priced in today uh from all of those geopolitical events. We have to be careful, right? Because we've known over the last two years that there have been a lot of false starts. There's been a lot of head fakes when it comes to geopolitics. So just we have to be balanced and acknowledge there are still risks out there primarily in the geopolitical space. >> Now Stephanie, you mentioned before the sentiment, right? You mentioned AI in terms of sentiment and framing the market moves in context there. It's kind of interesting to bring that up alongside an interesting note that's coming out from Ned Davis Research and basically the takeaway right now is that it's tough to get too bearish. That's the takeaway from from Ned Davis Research especially when they say seasonality turns positive in October to your point through year end. We would want to see much more trend deterioration and for longer to become more concerned. At the same time, let's flip it because this is a bullbear debate. You have Roth coming out this morning saying that leadership holds but internal trends are cracking adding our best guess is for the S&P to pull back to trend similar to March. And then you should treat semiconductors as the signal that decides whether this is a pullback to trend or something maybe worse. Interesting debate and juxtaposition there. >> Yeah, I do think that there are more negative analysts out there right now though. Um and that makes me feel a little bit better actually. It's like a pileon right now. All of a sudden everyone's like lowering target prices and lowering multiples and getting defensive. I think that's absolutely the wrong decision. And I go back again to point to the economy. If the economy is starting to roll over if the Fed decides they're going to go three times between now and the end of the year and it surprises people. Um that's something that you have to watch. But I have I I just believe that earnings are still so strong and last quarter we had eight out of 11 sectors that saw double digit earnings growth. So to everyone's point of the broadening out, we're seeing a broadening out and that's very healthy. September on average is down 2.7%. Over history. October is up 2.8 and November is up 3.9. I am not going to get bearish into the seasonality and I like the fact that I have fundamentals that I'm anchored to that support the reasons of why I would be a buyer on the volatility. >> Joe, to that point, I want to bring up another note that caught my attention this morning and this is coming out of Vander Research talking a lot about retail trading activity and flows. >> Okay. An interesting point there is they're making the point that retail activity is now turning lower. It had been seeing somewhat of an uptick and ramp up, right? But now they're seeing that retail buying had begun to pick up at the start of the month, which we kind of saw, but that momentum has quickly stalled in their minds. 1 million rolling net buying worth of individual stocks and total listed securities is now rolling over again, reinforcing that the broader retail bid remains relatively subdued, their words. Is this something I mean and because you run an ETF that has retail traffic in there alongside institutions that window is it somewhat that you something that you can actually glean something from that retail buying activity? >> I think that's a a response to the choppy environment over the last 30 days. Um I think you know clearly we are challenging the S&P having this 1% move but for certain over the last 30 to 45 days we are void of a significant amount of those types of days. So it's been a very tight range uh volumes have been on the decline. I think where we are today and what's interesting a lot of people might look upon today and say well it is a day in which volumes were lower. Maybe there's not full participation in the market. But let's remember something. Non-discretionary capital doesn't analyze those conditions. Non-discretionary capital sees the result of price. And the result of price is going to be a very powerful and strong reversal higher off of where we were early Wednesday morning of last week. So I think that is what is significant today is seeing that that non-discretionary capital will engage just reflective of price. I don't know that you need that retail participation. I think retail is sitting comfortably on a lot of existing long positions and didn't feel very compelled to do much in an environment that became choppy and somewhat uncertain given the rise in oil prices. >> It could it could also be yields and and switching and buying bonds. Bonds have been a horrible investment. >> Yeah, we tal we've talked about 5% being that level where people say maybe I want to back up the truck a little bit here. >> I think so. I mean, I would personally myself because I think I haven't talked about bonds in forever, but I think it has to stay above the tenure has to stay above five for a long period of time to see substantial changing and switching. But I do think it's it's it's it's tempting. I would be careful though because over the long haul, stocks well outperform bonds, right? Long-term total return for the S&P 500 is 7.7%. For the bonds, it's about 3%. So, you can diversify, but I think some of that retail money is moving into the market. >> You probably want corporate bonds over government bonds, correct? >> Yes. And munis. >> Yeah. I mean, >> why not munis? >> But, by the way, and you've noticed this, you mentioned before the spreads. They're not exactly blowing out here right now. They're still relatively healthy even though they have rerated a little bit to the downside. Bin, I want to bring this conversation because the yield story gets us into just how much that story affects the mega cap technology trade. >> One of the places that has become not just a retail but institutional darling of course is Nvidia. I want to highlight something interesting here because over the weekend we had CBS News sitting down with CEO Jensen Hang over at Nvidia Nvidia and they said that he said Jensen Huang that there was a 0% chance 0% those were his words of AI being the end of the world also adding he also said that people are sounding people that are sounding the alarm about the dangers of AI quote unquote scaring people is unnecessary and it is irresponsible. Nvidia is a stock that everybody on the committee here owns today. So Brenn, I'm going to start with you. You mentioned the meggaap trade. You own the cues. Nvidia is also part of that story in your holdings. The Nvidia story, how much can we rely on that as being indicative of that AI trade and sentiment going forward? >> Well, I think the 10% is a madeup number and I think zeros like I I would trust Jensen by the way. He's like in the mothership of AI. It depends like how far AI scales by the way. I mean, so I think zero zero is probably also a madeup number, but I think that, you know, Jensen giving, you know, comfort around the noise because to me, we saw this like peak dumerism and peak regulation, you know, last the last couple of weeks as we feel like anthropic and open AI really want liability cover from coverage from the US government, which I don't think they're going to get. And so I think having the calming words um from Jensen is is very very helpful. And so I just think this dumerism gets in the FOMO goes either goes both ways. And so that's why like I own DRAM the ETF. It's having a really nice day. It's broken up above 60. And I think that you're still going to be with Nvidia. This 230 236 is where Nvidia has not been able to get over. And so until Nvidia gets over that 230 236 it's going to be range round rangebound between 210 to 230. So I would love to get it to go over that because once it does I think it goes meaningfully higher but until it can break out I would just sell calls just understand that trading dynamic which has been very very solid for the last 6 months. >> Jim the next step on my meggaap tech tour in this first part of the show is going to be on meta platforms. Interesting analyst note and commentary coming out on Meta this morning from Wells Fargo reiterating the overweight buy rating. Maybe no shock there, but the target it gets raised to $796 per share from a prior $640. Interesting point being made here about whether or not those types of stocks on the meggaap side of things deserve to be rated higher or priced for a higher band going forward. And what ex Nobody owns it by the way, Meta Platforms, but what would get you into it? >> Well, when you say those types of stock, I mean, obviously that's open to interpretation. The way I interpret that is a kind of cheap stock. Um, and I mentioned Meta just a few minutes ago, not only because it's cheap, but because the market is clearly preferring Meta right now over a number of names. I mean, this run from $600 to $700 uh is impressive. It's happened in a short time frame. Uh there's fundamental reasons behind it. This shift in the compute strategy where they're going to sell excess compute is something it took the market a little while to get its arms behind it. Uh Dom, if you don't mind, I'm going to call a little bit of an audible here, but maybe front run something we're going to do in a second. I see a similar setup with Qualcomm right now, which I I added to today. I doubled my position in it. Uh I did actually trim it by half back up at 230 during the Parabola storm in May. Um and you know, look, I could have bought it at 160. There's no question about it. Bought it back that is. But what I see here is momentum. It's up over uh the last month about 19%. They've got a mean data center business that's growing. And just like with Meta, the market is waking up to the fact that this is not what they thought it was just a few months ago. Okay. Qualcomm is not I'll make this real quick. Qualcomm is not just a smartphone chip manufacturer. Automotive, internet of things, and data center. That's what the market's waking up to. Joe, go ahead. Let's talk about what's going on with the Max 7 because we're going to get to the same place in and in in terms of we think that Meta is seeing the positive momentum because of fundamental condition. But I think what's going on here and I think it's also affecting Apple is now we are delivering on a tangible product that the consumer can actually see in the case of Meta that's the AI assistant that's Muse all the skepticism all the questions around the spending where's the monetization for the spending on Meta maybe now you have a glimpse into that there is the monetization of spend on delivering a tangible product and I think that's what the street is seeing here with Meta that potentially Muse is something that the consumer can understand and I think the same dynamic is going on with Apple where ultimately as Apple looks like it's pressing towards a new all-time high Apple is going to give the consumer that tangible product as well >> but you are seeing monetization from a lot of the mag 7s I mean if you think about AWS growing 37% Google cloud growing 82% Azure Sure up 43%. I know it's not what we want it to be. We want it to be a lot lot higher. >> Consumers don't feel that and see that. >> I understand. I understand. Oh, I understand. Um but I do think the multiple contraction has been substantial. I was I was just looking at Amazon's I own it, of course. It's at 20 times. It's 10 year historical average is 44 times. >> Cheaper for Nvidia as well. >> I own and I just recently bought Nvidia when it was really almost at the lows. Actually, I got lucky because because to that point, Dom, Nvidia, the long-term multiple average 35 times and it's trading at 17 times now. >> Okay. So, we're going to go from Muse and Meta, Siri and Apple to Gemini and Google right now because Google's Gemini did become the latest AI model to hack an outside computer system. Our McKenzie Sagalos joins us now with the latest and you know this monetization story. Mac Gemini at Google is something that they are actually hanging their hat on. So tell us what happened with Gemini over the course of this past weekend. >> Yeah. So Gemini now part of this the prestigious albeit infamous club of frontier AI models breaking out of control tests and into real world systems. A designation that Google had largely managed to avoid to date. But this happened during a cyber security evaluation where Gemini agents gained access to the open internet from a closed sandbox, found credentials online and then ultimately broke into three companies. These incidents raise serious safety concerns, but they've also become almost a way of proving just how capable a frontier model is, especially for the private labs, trying to show that they're at the cutting edge. Up until this attack, Google had stayed out of that conversation. But the company tells me there's an important distinction in Gemini's case, that once the model realized it had reached real companies, it stopped on its own. They say that shows that its safety measures worked. But the question of what happens when these models cross into the real world is reaching the highest levels of government. Treasury Secretary Scott Besson says US and China discussed a new system over the weekend for alerting one another to serious AI incidents. And Alphabet Sundar Pachai is among the tech CEOs expected in Washington this week as President Trump meets with China's Xihinping right as its model is now part of the safety debate. Dom. >> All right. Thank you very much McKenzie Sagalos for that Mac. Thank you. We're getting some breaking news, by the way, out of Washington DC at the moment. Megan Cassella is at the White House with the latest. Megan, what can you tell us? >> Dom, just [music] in the last few moments, we heard from President Trump on Truth Social, once again talking about concerns over AI, saying that any safety concerns there are a a hoax, but he also presented the Justice Department as a possible safety backs stop on AI. So, here's part of what he said in his post. He said, "I'm not going to stifle growth of something that will be bigger than the industrial revolution or the internet itself. We will be careful and that's why we have the Department of Justice and other law enforcement bodies that will reign things in if we have to. But I will only encourage AI. So Dom, the key language there being reign things in if we have to. I want to be clear here, the Justice Department is not a regulatory agency. So he's maintaining his stance of no new regulation, no safety regulations around AI for now. But the Justice Department could be something of a backs stop here as an enforcement matter. Importantly, the Justice Department couldn't really act until after a safety incident did happen. If something happened, they could potentially go after a company and hold that company liable for whatever did happen. But the president now saying they will of course be careful on AI and reign things in. He says if they have to Dom. >> All right, Megan trying to identify the toolkit here for AI. Thank you very much for that. Welcome back to the halftime report. We are now here with final trades. Bin Talkington to you first. >> Uber. I like the stock at 70. has a trade a trade between 70 and 78. So, I think it's a good entry point here. >> All right, Uber for uh Bin. Jim to you. >> Well, I'll be honest. I delayed my final uh trade until I heard what Mike Seni had to say. And based on that, I'm going with Micron. I mean, similar to Qualcomm, where this has been an unloved stock. All the chip stocks, as he pointed out, have been uh dead money for the last three months. I see them coming back to life. >> All right, Steph, how about you? >> So, in healthcare, I like Nitera. I continue to like Nera. I've owned it for a while. I buy it on any pullback. This is a play on women's health, organ health, and oncology. >> All right. And Joe Terteranova >> rebuilding positions in data software, and that takes you to uh cloud security as well. Data dog is the name that you want to own in that space. >> All right, thanks very much to the committee today. That does it for the halftime report. The exchange with Brian Sullivan starts right now. >> Hey everybody, welcome to BlueCloud Trading. I'm George. It's Monday and it's September 21st. The markets closed and you can see the markets were all up today. The S&P 500 was up 1.49%, NASDAQ was up 2.26, the Dow was up 71% and the Russell 2000 was up.52%. In this video, I'm going to go over the a number of the stocks. Not all of them, but a good portion about um let's see 11 ETFs that you see here on the lefth hand side, including the Q's, the SPY, the Dow, the Russell, Gold, Silver, Bitcoin, Ethereum, VIX, and Oil K. We'll take a look at about 21 stocks and ETFs all mixed up in there, including Apple, Google, some of the big names, the MAX ETF, SMH, Uber. Okay. So, let's first I want to show you guys something else before we get into that and we're going to be looking at the technicals and I'll explain why the some of these are, you know, looking particularly strong right now. Um, the other thing I wanted to just bring up real quick is the news here. Just let's take a look at what happened today. US stocks closed broadly higher as NASDAQ logged the first record since June on AIdriven tech gains while oil fell on UN diplomacy hopes and Treasury yields eased despite the hawkish Fed remarks. Some of the companies that were in the news here for example today uh Meta surged 11.4% after Wells Fargo raised its price target. You had Warner Brothers gaining 10.8%. um you know after a settlement with California and other states over antitrust lawsuits we had uh let's see Advanced Micro Devices AMD okay that that climbed nearly 10%. Uh Intel 12.2% 2% ARM 17%. Okay, the ARM holdings. So, a lot of the the semiconductor stocks did really well. By the way, I called a lot of that stuff this weekend when I discussed the strongest sector and industries in the market, shared that with members, gave my watch lists, and yeah, was a profitable day for me in some of the stocks that I um recommended and that I actually added to my portfolio. There's this one company I want to talk about real quick because it's a company that I actually was interested in their product. It's called Grail. Okay. And their shares rose after FDA staff feedback indicated no major concerns for its multicancer blood test. So what is Grail? Um check this out folks. Let me tell you a little bit about this coming. By the way, the technicals are looking pretty strong here. You can see the big jump today. 33.6% today. This is a $17 stock. It's been off to the races and it's performance year to date 26.15%. Performance for the year 159.23%. The only problem with this company is it's not profitable yet, but their sales quarter over quarter 25.7%. That's pretty strong and sales past years three to five years there. It's a 38.73%. If we look at their earnings, uh most recent earnings announcement, those were positive as well. They had a nice revenue surprise of 5.42%. It's a it's a relatively small company, but um well, actually not so small because their market cap is $4.82 billion, but um you know, as far as employees, it's only 910 employees and but look at the sales just increasing substantially. Now, why why is this interesting to me in particular? because I actually requested to take this test and it was not covered by my insurance at the time. It was like about a year ago that I asked um you know my doctor I said hey can I do this gallery test? Um so they operate basically as a commercial stage healthcare company which engages in the development of technology for early detection of cancer. It utilizes machine learning software and automation to detect and identify multiple deadly cancer types in earlier stages. That's the key thing. Uh when I click on the website here, we can see and I select for example the gallery test, right? Let's say I'm going to learn more about that. What it does essentially, okay, uh let's see. Cancer screening saves lives, but 70% of cancer deaths are caused by cancer without recommended screening tests. The Gallery Multicancer Early Detection Test can help find those cancers without with a simple blood draw. Gallery can detect more than 50 types of cancers uh before symptoms appear when they can be easier to treat and are potentially curable. So definitely consider look at this. The type it says here uh the test is especially sensitive to many of the deadliest cancers that are typically caught too late like pancreatic, liver, and ovarian. So, I am a big proponent of this company. I like it. Anyway, just wanted to talk about that for briefly bring that to your attention in case you guys uh are interested in that. I have to do some more research to see if they've made it public now uh where or it's been it's now covered by health insurance. At the time it was like a $1,000 test and I really came close to it, but they didn't even have enough doctors like even in Massachusetts that were actually doing it was like a really difficult type of test to even try to um have done. Um but anyway, I'm going to start looking back into that again because I'm sure it started to I'm sure that they've uh eased the process. All right, so let's go into these stocks. Uh folks, actually should I let's take a look at the map the heat map very quickly. Let's close this for a moment. Go to heat mapaps. Boom. You can see all the technology stocks, the majority at least were up. Okay, just a few were down like SanDisk and CRM was down. ADP was down47. The energy stocks, they took a little bit of a hit today. Um, and you can see the majority of the stocks were up except for utilities, they were pretty much in the negatives. Basic materials didn't do as great, although copper did okay. Tesla was up 3.03. 03 meta up 11.34%. So let's go ahead and start looking at the charts. Now we're using the Ichimoku indicator and that's going to help us assess the strength of these trends. And I'm going to look at these on both the weekly and the daily chart. So here's the weekly and you can see very quickly, very easily that price is above these moving averages. The green line is the 9 period, the red line is the 26. We'll call that the conversion line. the baseline. Synchro span A is the cloud itself. When we're above the cloud, that's very bullish. And synchro span B is the lower part, the purple line that you see right there. And we have a bullish cloud. That's when the synchro span A is above the purple line there. Synch span B. There's the white line, the Chico span, which is the lagging line. It's the current price projected 26 periods ago. And if that white line is above the candle 26 period, that's very bullish. The cloud is derived by taking the midpoint of let me just zoom out a little bit so you can see the future cloud. It's by taking the midpoint of these two moving averages right here. Okay, go straight in the middle there and go straight out 26 periods. That's where you'll find the cloud. It's always moving into the future along with price. And then the purple line is based on the midpoint of the last 52 periods and that's the single span B. So the Q's looking strong on the weekly, looking strong on the daily chart as well. So I gave the Q's a blue flag today, the QQQ ETF. What that means is that it met all the criteria that we're looking for on both time frames, the weekly and the daily. Very strong day here for for Q's. And if you look at the directional movement index as well down below, uh, as I've mentioned before, it's really important. Uh, you know, why not use a secondary indicator for some more confirmation, right? I've got this at a setting of nine. All right, the green line is going straight up. The red line's moving straight down. And the ADX9, which is a representation of momentum, is starting to to move up. Notice how the volume is also moving up, too. So, I'm I'm very much liking the cues. The spy ETF also jumped 1.55%. Not as much. Uh, not all the elements of the Ichimoku have been met yet. You can see the white line there is still under price. The faster moving average, the nine is under the slower one. So, those are a couple of things that are still haven't um been hit yet, but uh you as you can see here, the spy did break this trend line right there. Okay, from that high and that high. So, there's a higher probability that the spy will also move up. Here's the weekly chart. It's been in a strong uptrend for a long time. I last week I mentioned that, you know, as far as I'm concerned, this was even though we've been pulling back for multiple weeks and it's been kind of a, you [snorts] know, really slow process, right? Because a lot of the stocks, they've been just kind of dragging a little bit and pulling back a little bit. The overall big picture that we're looking for is still very much intact. And that's why it's important folks to look at that weekly chart. The higher time frame always gives us a better picture of what's really happening. You know, like this consolidation box, we break through broke through that and then we pulled back a little bit. We stayed above that nine period, which is the high and low of each week divided by two, right? The midpoint the last nine weeks in this case when we're looking at a weekly chart. So, I like the spy and I like um the Dow Jones on the weekly chart. It's pulled back but now bounced a little bit 76% off this 51297. I wouldn't be adding positions in the DIA ETF quite yet because we haven't cleared above the 9 period on the daily chart. We're still under the cloud. So, I'd hold off on DIA, but it's uh it is, you know, more optimistic that we're going to bounce here as well. like when the Q's and the SPY uh ETFs move up, the Dow typically follows and so does the Russell. Now, the Russell also has taken a big hit here recently. It's been pulled, it's pulled back significantly under that 28826 level. If you look at the weekly chart, okay, we're in between the two moving averages. So, it too needs some work obviously and I wouldn't be adding positions in the Russell at this time. The VIX uh has dropped even more down.14%. It's at a level of 14.87. 7. That's good. That's the volatility index. We want to see that dropping the FEZ euro stocks. You can see here we have a um a bullish abandoned baby pattern. Let me show you what I'm talking about here. So, you got see this candle here and this candle and this candle, those three candles. And notice the gap between this candle and this candle and the gap between these two candles. Okay? So, I'll just show you guys that pattern very quickly on my X page, which is xxx.comcloud. Okay, that's where you'll find this channel. I'm sorry, this page. Scroll down at the very top of the page, you'll see the candle pattern reference sheet. Click on that. It makes it larger. And then what you'll see here, like I just showed you a second ago, it's it falls into the triple candle patterns and it's called the bullish abandoned baby pattern. Here's the candle. There's the gap. Okay, there's the little candle there. Then you see the other gap right there. So that's a reversal candle. So when you see that, especially after price has been moving down, expect a you know, a move to the upside. All right. So, I like what I'm seeing there with FEZ Euro stocks, but I wouldn't be adding it. I'm just saying certainly you should not be shorting here. Uh, betting against the Euro stocks 50. GLD was down 70%, but it's still above the Ichimoku cloud on the daily. On the weekly chart, it's inside the cloud. So, we don't have that as much bullishness here. Same thing with silver. It's under the cloud on the weekly and on the daily, it's above it. It's a mixed picture basically and it's not really rallying right now obviously. Bitcoin on the other hand look at this. It broke finally through this 4668 level. Where where's that derived from? Let me switch it to a weekly chart because those blue lines represent weekly levels. So it's based on this low back here from 2025. So from November 21st 2025 you can see bounced off that level came down found resistance that level but then gap through and then what happened price came back up to that level 4668 and dropped again came back close to that level and what did it do? It started to consolidate and build a box. Um okay and and then this week boom it finally broke through. All right. So, all trends tend to tend to not all all but the majority I'll say 99% 98% of trends do tend to reverse course at some point and move back up again. So, Bitcoin looking good. Um, but would I be at, you know, the weekly chart, it's entering the cloud. That's a bullish signal actually, but it's not above the cloud yet. So, we don't have a perfect trend line. I'm sorry, perfect trend with the Ichimoku indicator. On the daily chart, we do though. So the daily chart you can see it's it shows a little bit more clearly how price broke back here on um this was back on August 20th when we started seeing a lot of bullishness in Bitcoin and then it gapped up above that 200 moved up dropped moved sideways a little bit came back to that 200 bounced off of it boom right through 4668 and the directional movement index looks good. Ethereum also looks good. So I mentioned that this was looking really bullish last Friday. I said guys uh this is this is a change um of sentiment here. [clears throat] Why? Because you can see um price the closing prices kept on remaining under and inside this box here until this day Friday. So there's obviously a lot of interest on Friday pushed the price up and then we have the big gap up 4.69%. Let's take a look at oil. So oil in the daily chart has pulled back a little bit down 1.21%. This is still in a very strong uptrend and so this could be a very shortlived little pullback. Okay, that's my um analysis. U basically here is on the daily chart. You look at the weekly chart, we're still above the moving averages. We're still above the cloud. You know, yes, the faster moving averages under the slower one, but price is above both. And we did break above this high and we have a higher low here from the prior one. So, I'm very bullish still on oil K. I think this is going to do okay going into next week uh during the week and stuff because you can see this see this reversal candle after this pullback here. Uh if I switch it to a threeminut chart you'll see what happened here and the price gapped down, dropped and then it started to recover, got back above the cloud. So, it's going to retest that 200 day on the three minute five. Here's a fiveminute chart as well. All right, let's go now to the rest of the stocks and the ETFs. We'll start off with Apple. Actually, let me go organize these by the strongest stocks and ETFs here with a blue flag. Okay, got Apple, which looks great here on the weekly chart and on the daily. I've been talking about that, you know, each day that goes by when we whenever we bring it up on the show. Uh, MAGS looks good, too. the MAGs ETF breaking through that 7116 on the daily chart. This is this is a really big day for the MAGS. Uh up 3.56% today. It was finding resistance here. Okay, up until last week, Friday. So, the fact that we broke through concisively, right, with a lot of volume about two and a half times the volume of the prior day on Friday, that's significant. The ADX is moving up. That's very positive. It shows us the momentum is increasing. That's what you want to see. Micron. Okay, this also looks good. We got a future bullish cloud. The chu span, the lagging line is above price. Okay, the faster moving average is above the slower one and we popped up. Now, this type of candle you have to be very cautious with. It's called a dogee. All right, and that's when the the opening price and the closing price basically are at the same level. It's a reversal candle. this up a slightly higher probability that it might pull back. But if it does pull back, I think it's just only going to the only thing it's going to do is retest the cloud and then from there maybe take off. Okay, this space is now starting to look very bullish. Look at that ADX. Look at the green line and the red line. Like I mentioned earlier, it's all looking pretty good. Uh and it can get cancelceled out if price can get above the high of that candle. That's all it takes. And the high of that candle is 1,6449. Okay, let's go. NT, that's uh Nata Inc. It's in the healthcare sector, Diagnostics Research. Let's switch it to a weekly. You can see it's a very strong uptrend here on the weekly chart. It's been moving up nicely ever since it got above the cloud back in 2024. It's moved up about 598.39%. If I hover right there, a little bit more than that, maybe 600 plus%. Huge. It's huge, folks. It's a big deal is what I'm saying. Okay. And so, yeah, the weekly chart. And here's the daily chart. Okay. SMH also had a very bullish day today and on Friday when it broke through that trend line, and I brought that up on the show on Friday. And then boom. Okay. Gapped up above the cloud. There's the daily chart. There's the weekly chart. Very bullish stuff. XLK looks great. Okay, it's moving up. It's going to find some resistance at 1987, but I think it's going to break right through that daily. Very strong. Okay, gapped up, continue to move up 2.76%. The volume's coming in now. Finally, is a little bit more. you know, it's a very um there's not a lot of um you know, news events taking place this week. So, that's partly why there's there's nothing hovering over the market, so it's allowed to sort of flourish a little bit. the rest of these folks, there's something off technically with the rest of these stocks. Uh, which and so they lack that blue flag that I typically like to give a stock when it fits the criteria that I'm looking for on the daily and on the weekly chart. So, let's start off with BMR. That's Bitmine Immersion. And although it was up 8.66% the weekly chart, you can see it's still under the cloud, but it's still I mean the the bottom line is it's in a nice little uh trend that's been moving up since these lows back in July. It has moved up 113.54%. But when you look at the big picture, right, which is where it was back here, the high right there of 164, you know, it's at $28.25. So, it's at least it's moving in the right direction. Okay. And if you look at the daily chart, we're very bullish here on the daily. It's meets all the criteria of Ichimoku. So, if you want to trade just based on the daily, which when it comes to crypto, you know, it it's uh one of those I suppose um investments that where the the shorter time frames make more sense like a daily, you know, and a twohour time frame. Okay, you can see how it's doing really well. DD dog, that's data dog incarts under the 9 period, but it bounced off that 26. is most likely going to break through next week or this week. On the daily chart, it's it's hovering very close to the cloud. Whenever the cloud is this thin, it's easier, folks. It's easier for the price to break through it. It's a weaker cloud. All right? So, not as much turbulence when it gets through, but I wouldn't add it right now. Google is also right about to break through the cloud. And you know what else I like is this pattern. It's called the bullish harami. Okay. So that's also bullish. It's based on this pattern, right? You see right here under the bullish double candle patterns. And there it is. Boom. It's a large candle followed by a small bullish candle. And if you see that, it's a higher probability to the upside. No guarantees in the market though, but I'm just saying higher probability. Um, so there's a daily chart and if you look at the weekly chart, Google is looking quite good here on the weekly because it got above the nine period right now this week and it's been under for a little while as you can see here, multiple weeks, uh, a month and a half now. Granny Shots, this is Tom Lee's ETF, the fund strat granny shots US large cap ETF that also broke through the 2830 level, a daily level. Okay, so this is the weekly chart. Here's the daily. And um so yeah, it might be a little bit outdated. Let me just fix this. Sorry, folks. This this red line is based on this candle here from August 13th. We do have another high right there. So I'm going to move it up slightly. I'm going to move it up, but it broke through that as well. The 2839. All right, let me just fix that. Boom. So we broke through that level, too. So, it's more likely to continue to the upside. There's the volume coming in. IGV uh is the eyesshares S&P GSTI software index fund ETF that also broke out above the moving averages here up 2.58% but the faster moving averages under this lower one. So, it's not perfect either. Weekly chart looks pretty good. Cloud is starting to turn bullish too. You can hardly see it, but the segus span A is crossing above the Sega span B right there. It's like a little tiny dot and we're above this rising 200. Uh Meta is also you can see the cloud is going to probably turn bullish very soon. Price this week broke through the cloud on the weekly. Um and on the daily chart it's looking very bullish. Okay, so Meta is also looking great. Up 11.34%. but it wasn't um on the weekly chart has not broken through the the cloud hasn't turned bullish quite yet, but it's probably going to. So, you know, watch watch that as it goes along. As you can see, the directional movement index is also confirming it. Let's take a look at service now. Service Now, there's that directional movement index looking bullish, but price is stuck. Okay, so it's been hitting its head on that 200 day. That dotted yellow line is the 200 day moving average. Hit it here and dropped. Hit it here. Broke it above it briefly, but then got right back under. So, I'd hold off on service now on the weekly. On the daily chart, it does look more bullish, but it's under the 9 period. QCOM is inside the cloud on the daily. On the weekly chart, yeah, we it's a mixed signal here. I would not add that even though it was up 9.29%. RSP is the Invesco S&P 500 equal weight ETF. And on the weekly chart, it's under the 9 period. So, no on that one. Here's the daily chart under the cloud. So, it's interesting how the equal weight is performing versus the SPY. Let me show you guys that spy once again. This looks much more bullish. So, the large caps are doing much better right now. Okay. Uber is under the cloud and under this trend line here. I'd stay out of that obviously. XLB that's the material sector ETF is still dropping down 0.56% under the cloud on the daily energy is under the two moving averages and broke through this trend line here just make sure double check that the weekly chart okay you know if you look at this from a weekly perspective yeah it's broken through but will it be shortlived that's the question and there is some support right here we'd still have a series of higher highs and higher lows. So, there's a higher high from the prior high. There's a higher low here from the prior low. And now we're pulling back and we're going to retest that prior low of 6131. Let's see what else we got. XLF financials are inside the cloud on the daily and on the weekly chart. Couple weeks under the 9 period. XLI on the weekly is finding some support at the cloud. Looks like it's bouncing. Probably going to bounce here on the weekly. On the daily chart, it's not looking pretty. It's still under the cloud. I I'd hold off on this one obviously, right? This is not the time to be adding is what I'm suggesting because we don't know how much further it's going to go. That's why if you're wondering why not, um trends can continue to drop significantly. We want to we in my opinion, it just makes more sense to add positions when the sentiment changes and there's a lot more buyers and sellers. You want to ride that wave, you know? Don't ride it on the way down. Okay, those those downtrends can last a significantly long time. And uh yeah, so Zcaler now, this one looks good on the daily chart. You can see it's breaking broke through the 200. It's above the moving averages. It's above the cloud. We have a series of higher highs, higher lows. But what does the weekly look like? It's, you know, entering the cloud. So it's above the 200. That's good news for Zcaler. In fact, it's uh I like what I'm seeing down below here, too. see this um this low is lower than the prior one. So, we've got a higher low here and then we also broke through this high here. So, from a technical perspective, ZS is starting to look more and more interesting. It's still inside the cloud though on the weekly, but the daily chart does look significantly stronger. If you want to trade the shorter time frame, that's up to you. And if you look at the two-hour time frame, obviously there there you have more information. All right, that's going to do it for this video. But what I want to do real quick is show you guys a few things. I'm going to go to my channel very quickly. BlueCloud Trading, guys. Now, there's a couple of things here. Um, once you're on this website, there's a number of links. There's these 10 more links. If we click on that right there, you can find out a little bit about the company. I the company, the channel. I guess it is kind of like a company, but um, these are all the links. All right. We've got how to become a member so you can get access to those member only videos. I posted another one this weekend right here. Um and then we've got this is where I go over my portfolio. I also share those watch lists and I talk about what sectors are looking strong and what industries are looking strong. Then let's assume that you also like the software that I'm using because this software is pretty amazing. In my opinion, it's it's probably one of the better ones because there's a lot of ability to scan as well. They've there's like actual scanners on here, folks. And you can screen through thousands of stocks. So, and not only just stocks, but also mutual funds, ETFs, currencies, okay? You can trade options on this. It's all up to you. Um, but if you like the the platform that I've been using here, and you saw how easy it was for me to just review all those stocks so quickly, right? And you can impose, you know, you can superimpose the Ichimoku cloud. And you can if if you like this particular There's a dog outside making some noise. Sorry about that. Um, and if you like the U threw me off a little bit there. Um, all right. Where was it? If you like the software, just click on the link here. What will happen is it'll bring you to this page. You can enter your email and you can download it for Windows. Okay? You can run it on web or Mac as well. There's also phone apps. There's a phone app on there too for TC2000. And here's the pricing. Oh, the thing I wanted to mention is you'll get a $25 coupon towards the service for a month. All right. To be eligible for this coupon, you must not have used the service in the last 12 months. And here is the pricing. Software plans. Select monthly right there. You can see the basic is $24.99. And my suggestion is to try the premium because this is has a lot more features as you can see right here, including the easy scan real time scanning and sorting, you know, track 100 alerts. You can't do any alerts on the free version there. Um, again, that's going to be free for one month and then it then it goes into $24.99. And then premium plus, you get up to a,000 alerts. um intraday performance columns, real-time market pulse gauges and filters and sorting. Very good stuff. And they also have a brokerage account too. You can trade through right on the chart, which is fantastic. Okay, so if I click on this here, you can see how I could click the buy button right there and buy the stock. If I wanted to, let's assume I wanted to place an order, I can rightclick here. We can see the option chain, create price alert. Okay. Um, and let's let's assume that I wanted to buy once price gets above this high, the high of 20775. I can right click on it. Okay, sorry. Right there. And what you want to do here is, you know what I got to do is hit the buy button down here. Sorry. Buy. And then hit buy ZS at trend line. Okay. And then you go boom. Just like that. And you can see now you can set it up to buy as many shares as you want. You can select this little right pop out ticket, the quantity, the order type. All right, it's a SCA trade scaler. It's really cool. Um, and you can also create obviously watch lists in here. You click the plus at the top is a little plus button and you click on that and select personal watch list. All right. And we'll just call it uh test. Okay. And I'm going to hit okay. And there you have it. Let's say that I like I want to create a watch list of these stocks right here. Some of them, not all of them. Maybe I want Google in there. Maybe I want QCOM in there and XLF and XLI. You just saw how easy that was. Then you can select this right here, the move window. Click on that. Click on move. See how it pops it up. It's very intuitive, very easy. And you can throw it wherever you want. Let's say I want to put it on top of this. Bam. There it is. You can move these around to your heart's content. Okay. Now, um go ahead and delete that. Boom. Okay. What else can you do? Uh you can also copy and paste, you know, watch lists and then add them by hitting the controlV button. Okay. All right guys, that's all. Have a great rest of the night. I will catch you all in the next video. [music] The ichimoku [music] guiding light. Blue cloud traing through the night. >> [music] >> Whatever.
Comments 0
Sign in to join the discussion.
Sign inNo comments yet. Be the first to share your thoughts!