3 Stocks in Bottom Timing - Trade Ideas for Aggressive Traders

- Rendement de la vidéo
- -24,39%
- Appels
- 1
- Achat / Vente
- 1 0
- Publié
Recommandations
L'entrée est le cours de clôture de l'actif à la date de publication. Le cours actuel est la dernière clôture enregistrée.
-
Entrée $81,87 08 nov 2026Actuel $61,90 20 nov 2026Résultat −$19,97vs. indice −18,2% SPY −6,2% sur la même période
Citer cette recommandation Voir le segment source (647s) *
Contexte de la transcription source
…ght over here. This has turned green. This is uh a pair of um uh momentum of moving averages that has crossed over and turning positive. So I thought I'd show you the two-hour chart there and give you an idea that BU has already turned up. I want to buy you know days of weakness in here. If BU gets underneath this low right over here. So that is uh the low on that date is $75.80. It will negate this. all of what I just said to you about all of this positive stuff will be wrong or not yet and we will have to wait for a more…
I want to buy you know days of weakness in here.
Contexte extrait par IA This is uh a pair of um uh momentum of moving averages that has crossed over and turning positive. So I thought I'd show you the two-hour chart there and give you an idea that BU has already turned up. I want to buy you know days of weakness in here. If BU gets underneath this low right over here. So that is uh the low on that date is $75.80. It will negate this.
Transcription Complète
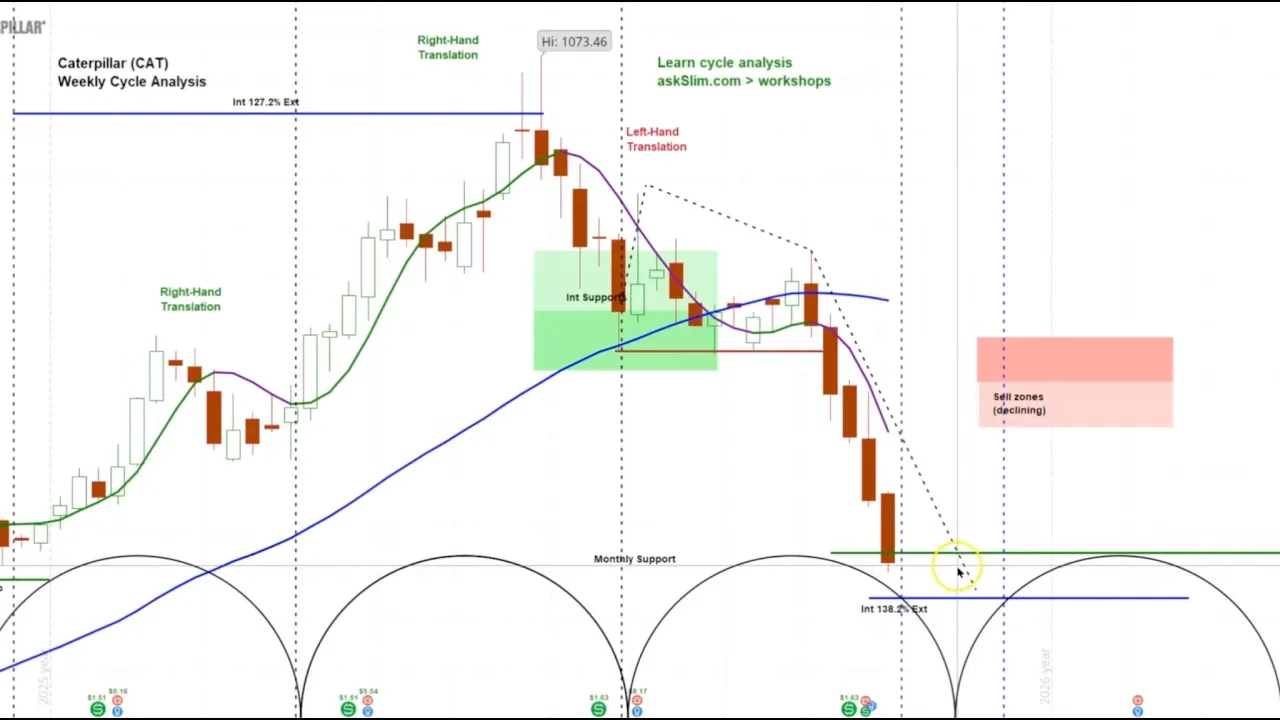
This is a look at three stocks that are in bottoming timing. Now, what does that mean? Well, what we do is we take most of the stocks that we look at and especially the widely helds and we rank them. Katie does an amazing job at this and our cycle low uh timing tracker and what it does is it helps us see what stocks are coming into important timing periods. [clears throat] Now, we know the stock market's gotten hammered uh late this week after the election. And what I wanted to look for since I know that there's a lot of traders out there that are saying, "Well, the market's going down. What can I buy?" Well, we're in a period that I think is very risky. And I'll talk more about that later in the show. However, there are times when aggressive traders can take counter trend trades, but we always suggest that they're very small. And I'm suggesting one quarter to 1/3 of the regular size, that's important because when there's a high probability that you could be wrong because you're trading against the market momentum, then you want to keep that size small. And when you're in line with the market momentum because there's a better chance of catching the larger impulses in the market, then you want to keep it bigger. So I want you to put these on your radar. That does not mean to buy them today. It means wait for opportunistic moments to do so. [clears throat] We're going to look at cat win and buy do. Caterpillar has gotten absolutely annihilated. That's along with AI because well they got blown to the upside with AI because of all the construction that they were going to be involved in on the data centers and we know there's a big push back on that right now. Win and BU are related. uh the Chinese market has done better because they are China is uh working to stabilize those markets and make it easier for banks to uh help corporations or uh people to invest in stocks. So they the Chinese market has done better. Now win is related because of Macau gambling. It often trades uh in line with China or with Chinese stocks and of course by do is a Chinese stock. These are three stocks that I think are in time frames that allow for the consideration of longside trades and that maybe have less risk to the downside than some of the other ones that you might choose to, you know, speculate on the long side. Uh, and they they've come down a long way and they're in cycle patterns. I'll show you that do suggest that they can soon [clears throat] bottom and make some upside. And probably the worst of the downside is seen in these stocks. [clears throat] Let's look at Caterpillar first. Here's the Caterpillar charts. For those of you that are brand new, this is cycle analysis. Now, what we do is we overlay the um market rhythms and this is just a drawing tool on the bottom. Uh onto our proprietary analysis. Uh what we look for is the market momentum. And this is the reversal scout right over here which tells us about the momentum which you can see tried to bounce but then turned negative again when it turned negative here. It signaled that top on the weekly chart. This is the daily chart that has also the reversal scout on it and the slim ribbon. The slim ribbon po right over here and the option bias indicator right over here. [clears throat] So when we look at Caterpillar on the weekly chart and I'll just expand this for you. [clears throat] What we see is that it's moving down and if you look at these rhythms in the market in here somewhere in here in these next several weeks there's likely to be a bottom. Now the stock has moved down from 1,073 down over here to 549. So basically lost like 48% of its value during this period and we know that June was the top for many stocks uh in this market especially in the high in the high cap AI technology category and Caterpillar is related to them because of the uh potential that it was going to do super well based on the the buildout of the um data centers. that [clears throat] could still happen and there could easily be a tone change uh where we start to see the Democrats say, "Okay, we're going to build out these data centers. We're just going to be a little bit more careful about it." And then you'll start to see these stocks rebound. So, you can see right in here is the timing window for a trough. Now, when I switch over and look at the daily chart, [clears throat] you can see in here what's happened is that well, momentum negative uh that you can see in here. Look at these signals here. This is the uh slim ribbon po and it gives you these signals of uh momentum to the downside resuming and you can see how great that was. This is a level four indicator. This is where the option bias indicator was telling you keep your bias to the short side on these option positions. It gave a little flip-flop in here and then turned negative again. And now uh all the way through midocctober through here into November, it said keep your positions on the short side. That's been great. So if we're looking for a low to occur, it it it's it looks like it could occur right over here in mid November. That would be an alignment here with uh the potential for a good size bounce here. And maybe you get a bounce from somewhere, you know, 550 to right up here. This is that resistance is the lowest resistance that I have there at 677. So you see it could be a very significant bounce in here once this low is established. I don't have any reason to say the low is in place yet. And if not the timing says to me that there is still downside risk. This is to go on the radar. What you want to be looking for is improvements in here and a sign that you're getting an upside turn. I'm going to show you some stocks that have already given you the upside turn, which [clears throat] is what's important that you, you know, just don't, you know, as they say, catch this falling safe, uh, or the falling knife and then get caught too soon. So, this is again to watch for signs that it's improving. You might get the first sign over here on the slim ribbon po or the reversal scout over here and then get some sign that it's improving. you might get it on the 2-hour chart and our market condition monitor can help you with that and even get notified when the 2-hour chart turns positive. So, that's a look at Caterpillar. The next one we're going to look at [clears throat] is win. Now, Win reported earnings this week and they weren't great. And when you look at the WIN chart, you can see well, it's done very poorly and uh this has come down very sharply. But now, when you look at that weekly chart, look what's happened. You can see the shape in here has changed and you can see even after the bad earnings the stock is going up and then you could see right over here there's an upturn in the weekly momentum. This is all indicative of a bottoming process right over here going on on the weekly chart. And when you look at the wind daily chart look at the cyclical patterns in here. Beautiful rhythm here. This is a very negative extreme lefthand translation and then it breaks down under there and then comes down right almost perfect to this cycle rhythm here and then turns up. And you can see in here what's happened is that the option bias indicator which was negative now has turned yellow which is neutral. The reversal scout has turned up and the slim ribbon PO has gone neutral after all of these negative signals that you saw in here and negative conditions. win looks to me like it's made a bottom. Now, uh what do you want to buy it here when it's at resistance and it's already come up here from 71 all the way up to 84? I don't. What I want to do is I want to wait for some opportunities where it pulls back. You could see the breakaway gap right over here where it had the downtrend but then had the upside gap then it had another gap on the upside. So, this is a very good-look chart. Now I'm just going to show you China before I show you by do because give you an idea you know this is China and you could see that significant upturn a little bit early but really strong that's based on the uh Chinese policy changes that we see and look at this upside gap over here and you see win is pretty much following this pattern so you know it's following China because of the gambling situation it often does but look at by do this might be the best opportunity right now of everything I'm showing you. Here's your huge decline in here because China had so much trouble. And look at this upturn right over here this week. Perfectly in this cycle rhythm. This is the bottoming timing right over here on the daily chart. There's your bottoming timing. Look at the beautiful rhythm in here. And now it's just started. You see the gap right over there. [clears throat] And here's some resistances. But I could see easily this getting here to 85. This is 87. This is the 78.6 right over here, which is right over here around 90. This to me looks like a stock with almost no downside risk. And I say almost because it can always change. You got the upward turn in momentum here. You get the upward turn not happening yet over here. So, we're waiting for that on the weekly chart. But this again, you can see it's a little premature. Here's the slim ribbon PO negative and giving you uh a little downside uh reversal there on momentum. Look at the option bias indicator. It's kept you short this whole way and it hasn't turned up yet. So timing is right, tape action is right, but the indicators have not turned up yet except for the reversal Scott right there which is the most sensitive on this daily and weekly chart of everything I'm showing you right now. So I'm sure that you know the 2-hour chart in BU is giving a much different reading in there and probably turning positive and it gives me the energy in here to look at this 2-hour chart and bring that over here in BU for you to see. So there's the 2-hour chart and you can see when I look at this that this has now turned up right over here. This has turned green. This is uh a pair of um uh momentum of moving averages that has crossed over and turning positive. So I thought I'd show you the two-hour chart there and give you an idea that BU has already turned up. I want to buy you know days of weakness in here. If BU gets underneath this low right over here. So that is uh the low on that date is $75.80. It will negate this. all of what I just said to you about all of this positive stuff will be wrong or not yet and we will have to wait for a more complex bottom to form. So I think extremely bullish under 7580 changes the picture and that's a look at the three stocks longside ideas aggressive traders only trade it small especially if you're trading against the momentum and look for opportunities to enter in a way that uh you don't have a high probability of hitting you in a psychological way where you don't want your emotions to say okay I was earlier this was wrong. You're trading against the momentum just about in all of these. However, I'm anticipating based on the sum of the evidence of the analysis. That's all of the indicators and the cyclical patterns and cyclical timing that these stocks could give you an upside play. Aggressive traders only. That's a look at three stocks in bottom timing.
Commentaires 0
Connectez-vous pour rejoindre la discussion.
Se connecterAucun commentaire pour l'instant. Soyez le premier à partager votre avis !