…closer on the weekly if basically anywhere in this range, I love it. Right. this you're coming into decades of support and on this right you could reasonably right taking a look at the stock let's say you've fallen what 79% from your highs you could reasonably buy and hold this for a significant portion of time and a move up you know 20 50% right even 50% to price where price was three months ago four months ago isn't totally unreasonable. Additionally, the stock does pay a dividend. So, holding it actually nets you an additional 1% every quarter…
you could reasonably buy and hold this for a significant portion of time
Contexte extrait par IA
And then plan C would be a longer term trade, long buy and hold. Now, what am I looking for when I'm looking at longterm holds? Well, I'm looking at stocks that have been beaten down significantly, that are at lows, multi-year lows. And this chart, I love this chart. This is possibly my favorite chart is Nike. Nike creating huge lows. And to find out where we're how low we're actually trading, guys, the last time this Nike was valued down here was what year? 2014. 12 years ago. About 12 and a half years ago. Absolutely incredible. So for me, zooming in a lot a little closer on the weekly if basically anywhere in this range, I love it. Right. this you're coming into decades of support and on this right you could reasonably right taking a look at the stock let's say you've fallen what 79% from your highs you could reasonably buy and hold this for a significant portion of time and a move up you know 20 50% right even 50% to price where price was three months ago four months ago isn't totally unreasonable.
Transcription Complète
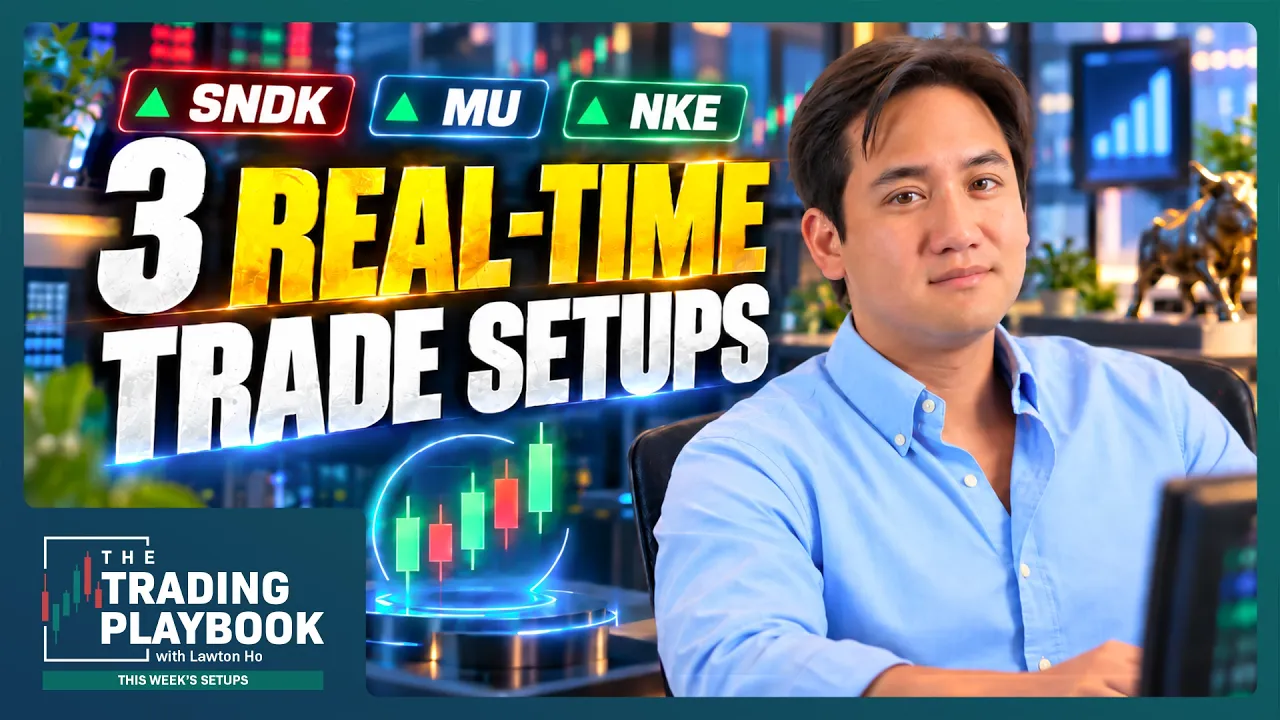
This is the trading playbook where the charts do the talking and every session makes you a better trader. Hey guys, Lton here with Verified Investing back with another episode of the trading playbook. Happy Sunday everybody and I hope you're doing well. Now I have a couple things to say. First of all, if you haven't already, please like this video and subscribe to the Verified Investing YouTube channel as it really helps us out to continue to make free content just like this. And if you haven't seen yesterday's episode, go ahead and watch yesterday's episode before I give you these three actionable trade setups. And this is one of my favorite um episodes that I've done so far just because we're going to go through the entire process and you're going to watch me in real time find out three actionable trade setups uh a day trade, a swing trade, and then a long-term hold um in uh in real time on these charts that you can potentially take this upcoming week. All right. So, with that being said, guys, let's hop into this week's plays. Now, this is all about putting everything together. So, everything from gap fills to trend lines to head and shoulders patterns to do to golden crosses, death crosses, there are so many different technical analysis uh indicators and strategies that you can use. But right, but the most important part is being able to put it together in order to find what works for you because what works for you may not work for me, right? So on and so forth. So let's hop into it. Let me go ahead and share my charts and we can start with plan A. So going into this, all I'm doing is just checking. You see on the right hand side of my screen, I have a watch list of things that are moving, right? And every single morning or night or afternoon, whenever I'm looking for a trade, I just put, you know, just sort through the list, like click through different stocks, right? And this list is just a list of stocks that I like to trade. Sandis, STX, Meta, uh, A, there's some crypto here, too. It's totally customizable and up to you. This is just things that I prefer to trade. And the very first thing I do every single morning when I'm looking to day trade, we're talking about day trades here, is I go here and just look at the sorting by percentage change, right? Just what's moving the most. And if this is pre-market, you can click here by EXT, right? Extended trading hours, right? So, I'll look, hey, Qualcomm, is there a potential trade here? It's coming down 5%. Where is the next level of support? And I'll go do something like this. Okay. Well, the next level support is somewhere down here. There's a nice gap fill um plus potentially a trend line, down sloping trend line, right? Okay. There's going to be support here around 169, right? But that's quite a ways away, about 5% lower. So, what I'll do is I'll go ahead and set an alert to remind me when it hits there and I'll go look at something else. But that's not quite close enough to be on my radar for today. Netflix fell about 5%. But I don't really love it for a trade until 65 bucks and that would be a longer term trade, right? All right. Well, what else are we looking at? And then maybe I'll look for what are some potential shorts. And here is my first trade. Plan a SanDisk. Now, SanDisk up 8% on Friday heading into the weekend. There's a couple key levels depending on where it opens up of resistance on Sandis for you all tomorrow. Okay, first level. Obviously, there's a gap here around 1764, but that is quite close. SanDisk is definitely a mover, and a move up into that level would only be a move up 1%. I'd likely look for something a little more conservative when tackling something like SanDisk. So, what are the next levels of resistance? 1827, nice pivot high, and then gap fill here around 1915. So, these are going into this week my two levels to short SanDisk at least for a day trade, right? At least for a day trade. And because it's a day trade, the way that I usually day trade is once we push up into these um resistance levels, I usually look for around 1%. Right? And for Sandis, that'd be about 20 bucks. So my plan going into tomorrow and the rest of this week, should Sandis push up into 1827 28 or 1915, I will short it and probably look for a move uh 20 bucks or so in my direction. 1% gain in a single day. Pretty solid, right? So, what I would do is I just set an alert and my motto is set it and forget it. Set these alerts and then forget about it, right? When they come into those levels, you'll see it. You can open up your brokerage and initiate a short depending on the price pattern, right? So, this is what I would look at for a day trade right now. The reason why I don't love this for a swing trade for a short is, yeah, we're up 74% from the lows. Yes, we're up 20% 26% from its recent fall, but we're still quite a ways away from its highs. About 26% down from its all-time highs. So, I just be careful there. Next one is Micron. Micron. Well, this is a stock that I've identified through looking, right, that hey, there's potentially a good swing trade opportunity here. And now, what's the difference between a swing trade and a day trade? Well, I'm looking for a little larger percentage, but I think that that pullback isn't necessarily just a small one or two or 3%. I'm looking at 10 plus 15 20% move in my direction potentially, right? Not that it's necessarily going to go all the way straight down, but will be a good level of resistance. Well, Micron gives us two good examples of this. First off, 1027, there is a beautiful gaffle up there. This will be a perfect level for a day trade. But for a longerterm trade, I love I love the high pivot here around 10:42 and this pivot this gap fill here around 11:15. And you can tell that these are 11% apart. Now, why do I do that? Well, first of all, I have to explain why I like this short. Micron has rebounded about a 15% move into this level, favoring a move down. But if you scroll back on the chart, prior to this great move up, Micron had accelerated violently up 300% in the matter of what, a couple months, right? Just a couple months. So, here would be my plan on Micron. Start a potential swing short here. And this would be my ad level, my secondary level of resistance. Because when we're swing trading, I'm not just looking for a quick move down. If it goes against me, that's fine. I have a plan. And I find the secondary level of resistance about 10% apart is where I like to spread out my ads. 10ish% apart. This is about 11 to 10 and a half% apart. So, this is a setup that I like for potentially swing trade, right? And in this case, I think that a fall back down just to, you know, this gap filled just from Wednesday, two days, you know, 3 4 days ago, like two trading days ago. I think that's very plausible, very easy, you know, very reasonable about 11% fall from that level. So, we'll ultimately see if Micron can do that. And then plan C would be a longer term trade, long buy and hold. Now, what am I looking for when I'm looking at longterm holds? Well, I'm looking at stocks that have been beaten down significantly, that are at lows, multi-year lows. And this chart, I love this chart. This is possibly my favorite chart is Nike. Nike creating huge lows. And to find out where we're how low we're actually trading, guys, the last time this Nike was valued down here was what year? 2014. 12 years ago. About 12 and a half years ago. Absolutely incredible. So for me, zooming in a lot a little closer on the weekly if basically anywhere in this range, I love it. Right. this you're coming into decades of support and on this right you could reasonably right taking a look at the stock let's say you've fallen what 79% from your highs you could reasonably buy and hold this for a significant portion of time and a move up you know 20 50% right even 50% to price where price was three months ago four months ago isn't totally unreasonable. Additionally, the stock does pay a dividend. So, holding it actually nets you an additional 1% every quarter, right? And this is a position that's safe, right? Whether you love Nike or you hate Nike, Nike is going to be here in 10 years. So, that's why I absolutely love this position for a long-term trade. All right? And you see how I use technicals to find that. I use decades of information and use the technical levels learned in this web series to um dictate how I'm go approaching long-term investing. But with that being said, that's all I have for you today. Thank you guys so much for tuning in. This is, you know, one of my favorite episodes I've done. My name again is Lenho here with Verified Investing. Please like this video and subscribe to the Verified Investing YouTube channel. And I hope you have a incredible and blessed weekend and I can't wait to talk to you next week. Please leave a comment down below if you made it this far and let me know what you want me to cover next. I hope you guys have a great rest of your day and I'll see you next time. Bye-bye. That's the trading playbook. If today's episode was your film study, the principle, the pattern, the framework, the application is waiting for you on Sunday. Real setups, real levels, ready before Monday opens. Subscribe to verified investing on YouTube. Saturday teaches, Sunday prepares, show up ready.

Commentaires 0
Connectez-vous pour rejoindre la discussion.
Se connecterAucun commentaire pour l'instant. Soyez le premier à partager votre avis !