…tantial amount of work. If we look at the lower case on the sensitivity table, 10% $668, only modestly above today's price. So if the recovery disappoints as well, this cushion can disappear faster than the central estimate suggests today. My verdict is a selective buy with the size of position reflecting this cash flow uncertainty. Strong ads earns it as a place on the short list. The spending means I'd build gradually and keep checking cash conversion. And before we get to Google, let's just look at the broader market. Technology is under pressure while parts of hea…
My verdict is a selective buy with the size of position reflecting this cash flow uncertainty.
Contexte extrait par IA
Estimated value comes to $814. We can see 32% upside. Margin of safety sitting at 24%. I would say overall it's enough to interest me, but also you need to recognize that the Castro recovery is doing a substantial amount of work. If we look at the lower case on the sensitivity table, 10% $668, only modestly above today's price. So if the recovery disappoints as well, this cushion can disappear faster than the central estimate suggests today. My verdict is a selective buy with the size of position reflecting this cash flow uncertainty. Strong ads earns it as a place on the short list. The spending means I'd build gradually and keep checking cash conversion.
…n if this later growth does actually hold up. My next decision would depend on results, whether spending follows the expected path and whether cash generation improves enough to support that recovery. That's how I'd earn confidence to add. My verdict is a possible small starter with more caution than the headline upside suggests. I want the cash flow path clarified before making it a massive position. Now, let's compare four chip stocks much more quickly. And before we do, just want to let you know that I release one weekly article covering severely undervalued sto…
My verdict is a possible small starter with more caution than the headline upside suggests.
Contexte extrait par IA
I get a value here of $312. That indicates 38% upside margin of safety of 28%. Attractive? Yes. But honestly as we have said for the majority of these stocks well in fact the recovery is what matters. The forecast we can see again based on analyst expectations 2030 175 billion. growth at the scale that we're seeing gives Amazon a route towards much stronger future cash generation. It does offer a real reason for optimism, but it doesn't exactly tell us when their spending is going to normalize. Even in the lower growth case, it still sits above today's price around 13% upside. But again, it does preserve the early recovery assumptions. So, it's not a downside test. A delayed recovery would challenge another part of the forecast even if this later growth does actually hold up. My next decision would depend on results, whether spending follows the expected path and whether cash generation improves enough to support that recovery. That's how I'd earn confidence to add. My verdict is a possible small starter with more caution than the headline upside suggests. I want the cash flow path clarified before making it a massive position.
Transcription Complète
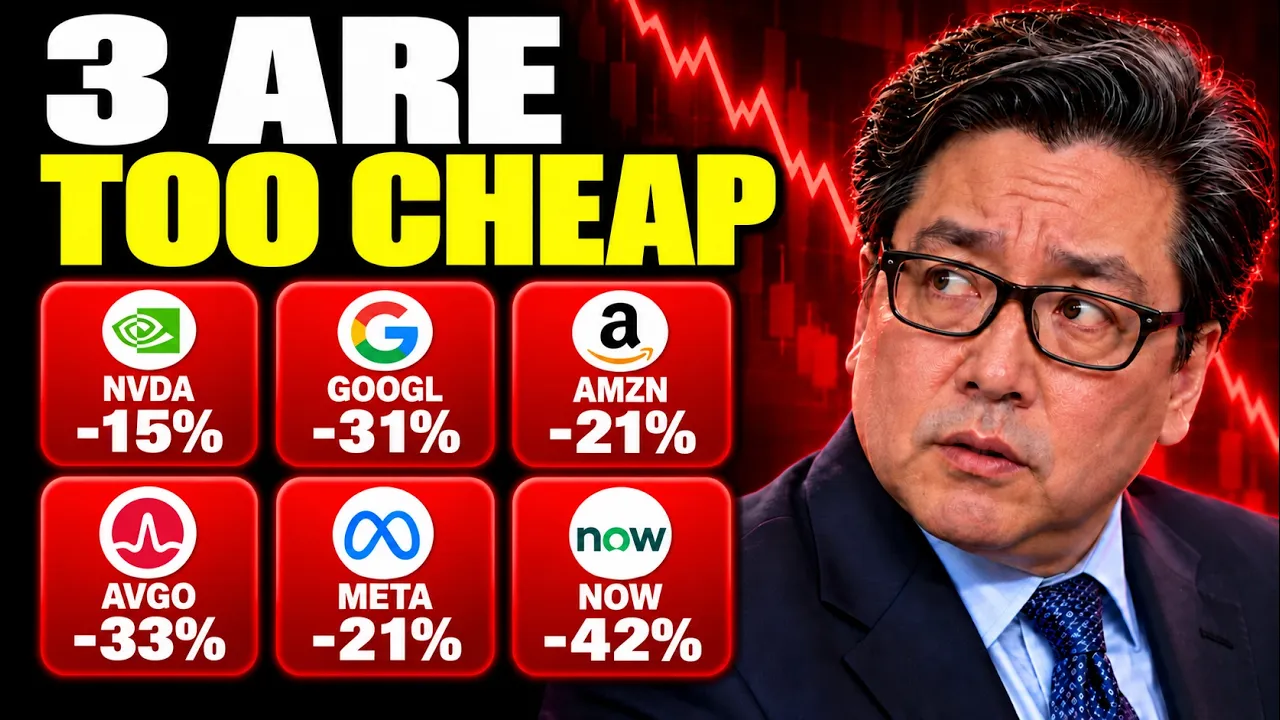
Google is down around 31% from its high. Broadcom that's down more than 33%. Micron more than 30. These are massive moves, but the biggest discount it doesn't mean it's the best stock that you should be buying today. And if we look at the performance right now, well, today AMD, it's down more than 9%, Amazon more than seven. Many companies, especially in the NASDAQ, are getting hit very, very hard. But here's the surprise. Even after these drops, AMD is still almost exactly at my estimated fair value. A stock it can fall very sharply like we're seeing today, but still give us very little room for something to go wrong. Broadcom, as I've shown recently, it gives a very different result. My model puts it well above today's price. The question is whether the cash flow underneath the valuation is believable today. That's really what we're testing. and Amazon. They've got a cash flow problem that we need to take very seriously. I'm going to show you why two bullish forecasts actually disagree and why that disagreement matters more than just another analyst putting a buy rating on the stock. So today we're going to go through Service Now, Meta, Google, and Amazon in depth. Then we're going to give Nvidia, Brocom, Micron, and AMD a quick evaluation check. Let's dive into Service Now because the sell-off needs more explanation than just a missed earnings number. And look, Service Now, just after releasing their earnings, they were down around 27%. That is an incredibly large reset. At this point, I honestly just want to know whether earnings power has changed enough to justify losing that much value. More than a quarter of their market cap in just one day has completely vanished. I mean, it's down 28% in 2026 over the last year, down 40%, moving once again towards 52- week lows. Yet, we do notice Wall Street with the strong buy. Seek Alpha sitting on the weaker buy side. Now, we can see revenue actually came in slightly above expectations at $4.1 billion. Adjusted earnings, it missed by 2 cents. So, if we're explaining this whole move with the headline miss, honestly, I think we're missing the bigger concern. And well, the concern for Service Now is in the forward-looking numbers. Current remaining performance obligations. They grew, as we can see here, 21% in constant currency. That's contracted business expected to become revenue over the coming 12 months and that gives us visibility. But the next quarter guide, it slows that growth to 18.5%. That's really the part that I care about here. And we've got another concern, gross profit growth. That slowed substantially. Now, the line falling, it doesn't mean gross profit's disappearing. It just means the business is adding it more slowly. And honestly, it matters for a company like Service Now when investors based on the valuation they've been paying for speed. And when we look at this measure here, GAP operating income, it actually fell while revenue rose is why I don't want to wave the quarter away. Investors, they look at the quality of growth alongside the actual amount of growth. Now, listen to CEO Bill Mcderman explain that two cent earnings miss. It's useful context for management. And then we're going to come back to the cash flow numbers because an explanation is it still needs to show up in the business. >> Listen, there there are estimates out there. It missed the earnings estimates by two cents. They're not looking at the revenue growth which was really strong, the RPO which is strific. They're not ruling the at what we look at growth in margin. They're saying no, he missed by two cents and that's just not excusable with this eye market multiple. >> Well, let me offset that a little bit. First of all, the two cents has to do with the interest on the companies we just bought. And the companies we just bought that impact EPS, but we now in this quarter and we just bought them in April announced 150 basis point improvement in operating margin. >> That's his explanation. Financing costs affected earnings while he points to operating margin improvement. Fine, but the gap picture on here, it still matters. different profit measures. They can tell different stories about the exact same quarter. And the encouraging part is this AI disclosure. Net new AI contract value grew 65% and the annual target rose to $1.7 billion. There is commercial activity here beyond just a presentation around AI. And we can also see contracted business continuing to build. It helps explain why I'm interested after the selloff. But a growing backlog, it doesn't remove the slowdown in the growth rate. So that is why we need to watch both measures. Now cash generation, that's another positive. Historical bars, they're showing a business already producing substantial free cash flow. The estimates, they look good, but I want to see the expected improvement arrive rather than just sitting here mentally banking it today. And Wall Street, well, you can see their expectations for service now sits around $155. That does imply nice upside after the selloff, 41%. But just look at this incredible range. At the low end, $72 below 52-W week lows. And at the upper end, I believe that's all-time highs at 266. And if we look at near-term estimates, will they go from around $4 for 2026 to almost $6 by 2028? Is the earnings recovery investors are underwriting? I'd concentrate on these as always, just to flag, because the later ones, they have a lot less coverage. And when we look at their growth, it helps put the sell-off into perspective. This is still a growing company. The debate is how quickly it can grow and how much of that growth ultimately belongs to shareholders as a cash. I mean, revenue was up 22% year-over-year, expected to climb 21% moving forwards. EPS 20%, longerterm EPS to compound at a faster rate 24. So, these are still very impressive numbers. Although we can see there is slowdown on both the historical numbers and that is probably where the question of valuation comes in. And here's my forecast aligning with analyst expectations. Free cash flow goes from 5.4 billion in 2026 and then rises to 8.2 billion in 2028, 10% growth that we have here. It comes after the increases. So obviously for this to come to fruition these next few years they need to happen. Produces a value today of $169. Bear in mind we are as always using a 9% discount rate moving forwards and that comes to 55% upside a margin of safety today of around 36%. Now what I like about this in general is when we look at the range even the lower case at 5% it comes to $130 that's still above today's price but again provided the early cash flow forecast hold. So I would say it does give this thesis a bit of breathing room. Now the other thing here is the reverse DCF 1.6% 6%. I don't want to overstate it. The low growth number, it keeps the early recovery forecast in place. So, just something to factor in, although in isolation 1.6, it looks very achievable for a company that over the last 5 years has been compounding free cash flow at 26%. My overall view for Service Now, it deserves a place near the top of today's buy list with purchases spread out. The valuation gives room. The next check is where the contract growth stabilizes and that the expected cash flow improvements they continue to arrive. Now the next stock we're looking at is meta bit of a different setup here. We can see yesterday it was up around 2% but pretty much given away those gains in the early morning session down around 2% so far. The advertising business is strong. The uncomfortable part is how much cash the investment program is consuming. Now year to date they're down 5% over the last year down 17 trading towards 52- week lows. Weak buy from Seek Alpha, strong buy from Wall Street. And let's start with this comparison. Meta's advertising revenue grew around 26% against roughly 11% for the other two businesses. On this measure, the demand story looks healthy. But for Meta, the pressure is coming from elsewhere. And it isn't just one quarter of relative strength for the company. Met has been growing advertising revenue faster across this period in comparison to Google. Now, obviously, it doesn't tell us every advertiser's decision, but it does show meaningful outperformance in revenue growth, and the scale is striking. Meta's total advertising revenue is almost level with Google searches advertising revenue. Now, we're comparing Meta's whole advertising business with one Google category here. But even with that distinction, Meta's progress, it is fairly substantial. And this chart it makes the distinction clearer against Google's entire advertising business. Meta is around 77% of the size. Now the ratio it has risen substantially is another way of seeing the gap closing over time. And we've got the individual Google categories search. It's still growing just much more slowly than Meta's advertising business. For me it strengthens Meta's operating case but it doesn't by itself tell us what price to pay today. and their revenue per employee that's also moving higher. It's encouraging for productivity. Obviously, one ratio doesn't make an investment thesis, but it's fitting the picture here. A business generating more revenue from the workforce as it continues to grow. Now, Wall Street after their earnings, they do still see respectful upside 36%, average target price around $850. The more bullish sit still over $1,000 today. Whether forward revenue growth is also another encouraging sign expectations of 24% is suggesting the business can keep expanding from an already large base. What I want alongside this growth is better cash conversion as the investment cycle develops. In terms of EPS expected to grow 12% over the next 12 months near 20 in fact over the longer term and now we have to get to the cost. Cabal expenditure reach roughly $14 billion on a trading basis. Spending at this scale, it can swallow the cash generated by an otherwise strong quarter. That's the problem investors are weighing today. And that's visible here. The latest quarter's free cash flow is negative. It's telling us why investors are asking harder questions. And earnings expectation for this year is around $30. We're looking around 3536 by 2027 and then 42 by 2028. the shares they look more interesting against the future earnings cash conversion that decides how much weight I'd give to the argument today and in terms of valuation well we can see forward multiple 19.4 for below the 5-year average of 21.7. Now, I'd say this is supportive. It's not really decisive because the historical average is not promising us a rebound, especially when the future spending profile is looking very different from Meta's past. And my model is including the pain zero free cash flow initially, then $20 billion outflow, and by 2030, $110 billion of free cash flow. Obviously, that's a huge recovery where the CAPEX chart tells us what has to change for the model to work. Cash generated by the business, it needs to grow faster than the investment bill. That's the improvement I'll be looking for in their upcoming earnings as they go on. Now, after the recovery, the model here still assumes 15% annual growth for the remaining forecasted years. Strong operations help support this, but the valuation obviously is really going to depend on the company delivering these numbers. Estimated value comes to $814. We can see 32% upside. Margin of safety sitting at 24%. I would say overall it's enough to interest me, but also you need to recognize that the Castro recovery is doing a substantial amount of work. If we look at the lower case on the sensitivity table, 10% $668, only modestly above today's price. So if the recovery disappoints as well, this cushion can disappear faster than the central estimate suggests today. My verdict is a selective buy with the size of position reflecting this cash flow uncertainty. Strong ads earns it as a place on the short list. The spending means I'd build gradually and keep checking cash conversion. And before we get to Google, let's just look at the broader market. Technology is under pressure while parts of healthcare, financials, and defensive sectors today are green. It suggests rotation as well as selling. And this is the distinction that's incredibly important for today's episode. And the headline, it makes the same point here from the New York Times. The broad index has held up better than some individual AI names. So for those investors who have a portfolio concentrated in some of these names, it can feel like quite a significant crash. Even when the wide index itself looks relatively calm and at the same time, we've got the report describing investors moving into government bonds. There's a more cautious mood. Obviously, it doesn't tell us the market's next move, but it's helping explain to us why expensive growth assumptions, they're really being challenged. And we've got data from last week, client flow figures telling us a lot of selling in communication, services, and technology. So, it is a bit of useful evidence here around positioning, although bear in mind this is just from one firm client's data set where we've actually got a separate point here from JP Morgan and actually points the other way. Some investors, they're actually buying the weakness. So different investors, different samples, different periods. Neither chart really proves that the bottom is in or the selling is finished. But it can just tell you where sentiment is. There's no one direction that every investor is going. Now the spending debate, it links these stocks. Investors want to know who eventually earns a return. Steve Eisman raises a tougher question. How durable are the businesses supporting this investment chain? We're going to listen to his argument, including his qualification. the end of the day, you know, when you when you think about how, you know, from Nvidia to the hyperscalers to enthropic and open AI, the whole chain depends upon the health of enthropic and open AI, at least at this point. And and they have business models that I am quite convinced have no >> and you say they beg for regulation and then they use that regulation >> to create modes >> to keep the Chinese out, >> correct? which I don't think is going to happen. >> If you don't think that's going to happen, you think the entire market is coming down pretty substantially. >> I I'm not willing to make that bet just yet. >> Notice his qualification. He isn't making the market crash bet there. His investment chain argument is an opinion, not proof that every business depends equally on two customers. We still need to examine each company's own evidence. And that brings us to Google. We can see it's trading around $280 in the morning session. Now, the sell-off, it reflects a difficult combination for the company. Worries about search economics alongside a much bigger cash commitment to the cloud opportunity. Now, they've gone negative year to date, minus 9% over the last year, nearly flat over the last 5 years. They are up around 92%, trading very close to 52- week low. Sounds incredible to say that out loud, but here we are. In terms of Wall Street, strong buy rating seek alpha weak buy and we can see their total revenue grew around 25%. So this wasn't a quarter where the whole business just stopped growing. The question is what that growth cost and whether the most valuable parts they can keep producing attractive returns. And look the revenue mix it helps explain a bit of the tension. Search remains huge while cloud is now a much bigger part of the company. Investors have to value both the established cash engine and the investment behind the newer one. And we've also got search that's sitting around half of total revenue. Obviously, a falling share doesn't mean search revenue is falling, but other divisions can simply grow faster. Just keep that distinction in mind when we're going to listen to this bearish argument. >> Right. Alphabet has been Google has been generating most of its profits from Google search ads for the longest time. It's been one of the best businesses ever constructed. And over the last few years, we've had this fear of what happens when we stop searching and we start using chats. And for the last couple of years, Google's actually been fine and investors have become complacent. But this is the quarter that we've feared. This is a quarter where all of a sudden, hey, wait a second, maybe the change in behavior to AI is is ruining this goose that lays the golden eggs for Google. >> That's the risk argument. But search revenue still grew 12%. Slower growth is a concern, but it isn't evidence that revenue is collapsing. So I wouldn't turn a possible future outcome into a fact about today. And on the other side, cloud revenue that more than doubled up 103%. This is a substantial business now. So the growth it deserves attention. The investment debate becomes harder when the company is seeing demand rather than spending without revenue growth. Now, we have some annualized run rate calculated from a quarter rather than fullear revenue, but Google Cloud has become much larger on that basis. It's still smaller than AWS here, which matters when we're comparing their growth rates. Google is also growing faster. It shows the strongest momentum. And look at the margin improvement. Cloud has moved from heavy operating losses to a substantial operating profit margin. It's a real change in the business. The next challenge is turning that profitability into cash after infrastructure spending. And this is the cash problem. Two negative quarters with the latest around $9 billion negative. Now analysts they still believe in the company on average 44% price target $48 range 3 to500 at the upper end where the earnings table also shows why lowook multiple needs context estimates they drop next year before recovering. Bear in mind they do have some investment gain. So that does distort this slightly if you're looking on a comparative basis where they're currently trading on a forward valuation below the 5-year 19.6 versus 21.6 is why Google deserves attention here. Now I'd be more interested again if search holds up and the cloud investment starts producing more cash alongside the operating profit. Look closely at my forecast. It moves from very little free cash flow to 137 billion in 2029 to 200 billion by 2030. These are huge changes. The results depend heavily on that recovery arriving. Estimated fair value though. Today we get to $327% projected upside and margin of safety around 14%. You could argue here there's limited cushion against such a large change in the forecasted cash flow. And if we go to the sensitivity table, while the lower growth scenario comes to $272, roughly around today's price, a little bit in fact below, it's useful discipline. Google can remain a successful business without this particular purchase producing the return that I'm ultimately as an investor hoping for. So, I'd want a lower entry or more evidence behind the recovery. A 20% discount on my estimate would be around $260. My verdict? interesting but less urgent than some alternatives today. I'd keep watching cloud profitability and search performance. The combination can improve the case. The share price fall alone. It doesn't give me enough reason to rush out today and buy. Then we move on to Amazon where we did a deeper dive yesterday. So check that out if you want to take a look. It's currently trading around $227 down in fact around 7%. And year to date that's going to end up being negative. It'll also be trading around the lower end of the 52- week range. Yet, I don't believe these are really going to change. Wall Street Qu want still heavy strong buy. Seek Alpha 4 out of five buy where AWS revenue grew more than 39% is a strong number from a very large business. Yet, the shares are selling off. This is where the difference between good performance and high expectations become especially important. We're talking about annualized revenue run rate coming approaching $184 billion. We're going to listen to Brent Dal on why impressive growth can disappoint. Then we'll look at the profit and cash flow ourselves >> brought up. So I I think what you're seeing is good growth. It's not meeting a bar that investors want. You know, don't don't hate the play or hate the game. The game right now that I'm watching is everyone wants a higher level of execution. We're not seeing that and we're not seeing that across many of the tech companies support stocks at current levels. That helps explain the reaction. AWS has an operating margin close to 39%. It slipped from the previous quarter, so this isn't an uninterrupted margin expansion. Nevertheless, it's substantial profitability from a growing business. Now, the wider the company, well, that's produced nearly $800 billion of trading revenue. Amazon has plenty of scale to work with. What investors want now is a better answer on how that scale translates into cash after investment. and their trading capital expendure. Well, that's around $215 billion is a trailing measure. Fullear guidance use a calendar year period. Either way, the investment bill absorbs an enormous amount of cash and training free cash flow is more than $42 billion negative. Is very different from an operating margin discussion. A profitable operating business can still consume cash when investment spending is large enough. and management, they still expect around $220 billion of annual cash capital expenditure. Mark Mahini argues the timing of that spending explains part of the disappointment. Here's his case, including his own very bullish conclusion. The the negative record free cash flow, well, that's because the capex got pulled forward. They didn't change the capex for the full year. It's just that it was a lot heavier in Q3 than the street had expected, which actually means Q4 is going to have positive free cash flow. So, you know, look, this company is still going through a major investment cycle, but I I I look at this as an overreaction. >> I like Amazon as a stock. >> Yeah, it's our number one pick and it's my number one buy even here off the correction. I didn't I don't like corrections on my top picks, but you know, it's happened and I understand why. I just think there are answers to all three of those main major concerns. That's his interpretation. Official guidance separately expects advertising growth in the high teens next quarter. His positive quarterly cash flow quote, that's an analyst forecast. management. They've not promised that results in terms of the guidance they've released. And this headline captures the tension. Stronger cloud growth, but disappointment elsewhere in the outlook. I think that deserves a balanced response. AWS can be doing well while the overall quarter stills falls short of what investors were expecting. Now, a bit of a mismatch. My model does assume positive 20 billion free cash flow in 2027. Late in that interview, Mahenny expects around 50 billion negative. So slightly different pass but is optimism. It doesn't validate my forecast. I get a value here of $312. That indicates 38% upside margin of safety of 28%. Attractive? Yes. But honestly as we have said for the majority of these stocks well in fact the recovery is what matters. The forecast we can see again based on analyst expectations 2030 175 billion. growth at the scale that we're seeing gives Amazon a route towards much stronger future cash generation. It does offer a real reason for optimism, but it doesn't exactly tell us when their spending is going to normalize. Even in the lower growth case, it still sits above today's price around 13% upside. But again, it does preserve the early recovery assumptions. So, it's not a downside test. A delayed recovery would challenge another part of the forecast even if this later growth does actually hold up. My next decision would depend on results, whether spending follows the expected path and whether cash generation improves enough to support that recovery. That's how I'd earn confidence to add. My verdict is a possible small starter with more caution than the headline upside suggests. I want the cash flow path clarified before making it a massive position. Now, let's compare four chip stocks much more quickly. And before we do, just want to let you know that I release one weekly article covering severely undervalued stocks as well as what's gone in the market. You can click below on the pin comments, sign up, read all of these straight away. Nvidia, that's the first one I'm looking at, is down around 3% today. The decline smaller than several other names, but it doesn't automatically make it less attractive. We can see year-to- date up around 15% midpoint of the 52- week range. Double strong buy from Wall Street Quant weaker buy from Seik Alpha Wall Street they're expecting around 54% upside over the shorter term and this is really why people are interested forecast goes from $9.31 per share to almost $16 by Jan 28. My model it starts with $150 billion of free cash flow followed by quite substantial increases. This is again analyst expectations where we've got a middle rate of around 15%. That comes to $255, a margin of safety of 19% upside potentially around the 23% level. The lower growth case, well that's at 10%. That's coming in pretty much at today's value indicating fair price. So I'd probably be a bit more selective with Nvidia. Again, factor in we're using a 9% discount rate. If you changed it lower, it would be more attractive. Higher, less attractive. So I'd be less selective. The pullback doesn't look like obvious mispricing the early cash forecast. These really do need to hold for the actual central valuation to keep Broadcom that's more compelling on my figures. We can see it's down around 4% today in terms of where it's sitting around 52- week lows. Double strong by Wall Street and quant four out of five from seeing Alpha where Wall Street are expecting around 60% upside in just the next 12 months. Now look at the earnings increase expected next year. It brings a forward multiple down substantially to around 17.7 is the opportunity investors are looking at buying before the forecast profits arrive. Execution decides whether that works. My forecast starting at $48 billion of free cash flow growing 20% annually. Obviously, it's ambitious over a decade. The attractions the valuation still offers room with lower growth rate 15% 12% upside. Central fair value $516. That implies right now a 36% margin of safety. One of today's strongest gaps provided the cash flow growth ends up being durable. Then we move on to Micron. This one's down around 5%. We can see gets your attention because it has been a very strong stock year to date up 211% trading around the midpoint of the 52- week range. We can see strong by Wall Street, strong by Quant, weak by Seek Alpha. We do need to look though beyond the multiple which is sitting around five today before calling the company a bargain. Wall Street though they love it. They see 77% upside on a short-term basis. The early earnings estimates well they're enormous but then the table does show a decline. And here's the assumption that matters. 75 billion of starting free cash flow. 5% growth. That's what we've used. It does sound restrained but only if the starting cash flow actually lasts over the longer term. The low growth rate. It doesn't fix an inflated starting point. This then gives us $1,300 indicating 47% upside, a margin of safety of 32% today. Attractive mathematically, but how much cash can Micron produce through both stronger and weaker periods. All three scenarios, while they grow from the large sting forecast, none test a cash flow downturn. It makes Micron, for me at least, more specive. I'd want a tougher test before giving it the same confidence as some of my favorites today. Finally, we get to AMD with a massive drop nearly 10% so far. But remember, a big decline. It can still leave a stock fairly valued up significantly year to date, trading around its upper end, still the 52- week range. Hold from C alpha. Wall Street again holding hands with a strong buy for which Wall Street today see around 24% upside with the bullish argument being right here. Earnings are expected to more than double next year. AMD has a real growth story. My concern is the price we pay for that story. Even after this massive drop, my model grows free cash flow from 7.6 billion to 42 billion by 2030. Again, analyst estimates that's before the growth assumption of 15% kicks in. That comes around $529, only 2% upside margin of safety of 2.2%. For me, that's nowhere near enough for a strong cushion because look, just a low case today. That's below today's price. I'd wait for a larger cushion or stronger evidence around $425. That would offer roughly 20% discount to my current central estimate. Where would I focus first? Broadcom right there at the top. The discount is substantial. I'd spread purchase out though because a forecast with this much growth still needs to earn our confidence as results come through. Service Now, that's alongside it with a different risk. The share price reset gives room, but contract growth needs watching. I'd be comfortable starting gradually, then judging the next results against the cash flow path. Meta, that's my selective candidate. Advertising performance gives me a clear reason to be interested. The fair value estimate depends on future cash arriving. I keep the position size sensible until we see more of it. And AMD, well, that's the clearest weight on today's figures. It could rally tomorrow. My estimate simply gives too little room for error at this price. I'd be happy to miss a bounce rather than force a purchase. That's my approach. Check what the business can earn. Check what the price assumes. And then decide. Let me know in the comments below which of these eight you would buy first and why. And if you enjoyed the episode, smash the like button, hit the subscribe and bell so you're aware of future episodes, and click on the pin comment where you can sign up. Read all of these articles. Fresh copy coming very soon as well. More importantly, have a great day. I'll see you all on the next

Commentaires 0
Connectez-vous pour rejoindre la discussion.
Se connecterAucun commentaire pour l'instant. Soyez le premier à partager votre avis !