…y as we look ahead through the midterms into the final end of the year. I think the market's going to do terrific as we look into January and we want to make sure that we're able to lean into things that we really really like. And for now, Meta is uh is is a sacrifice here that that you know, we don't like the story behind it. Did not follow through on the on the Muse news uh post earnings and uh we have to trim it. >> Listen, I also think all of these MAG7 companies, they're benefiting from the mood of the market very quickly, reversing from being incredibly pessimistic last Thursday and Friday to now being more optimistic. And a lot of that is roote…
Meta is uh is is a sacrifice here that that you know, we don't like the story behind it. Did not follow through on the on the Muse news uh post earnings and uh we have to trim it.
Contexte extrait par IA
This is such a headwind is in that negative free cash flow. Meta's there and um I mean the stock is telling us too. We got to listen listening to what the market is telling us. The $700 um it got back above it's now surrendered that there's a tremendous amount of resistance there. We are trying to raise cash to have some flexibility as we look ahead through the midterms into the final end of the year. I think the market's going to do terrific as we look into January and we want to make sure that we're able to lean into things that we really really like. And for now, Meta is uh is is a sacrifice here that that you know, we don't like the story behind it. Did not follow through on the on the Muse news uh post earnings and uh we have to trim it.
Transcription Complète
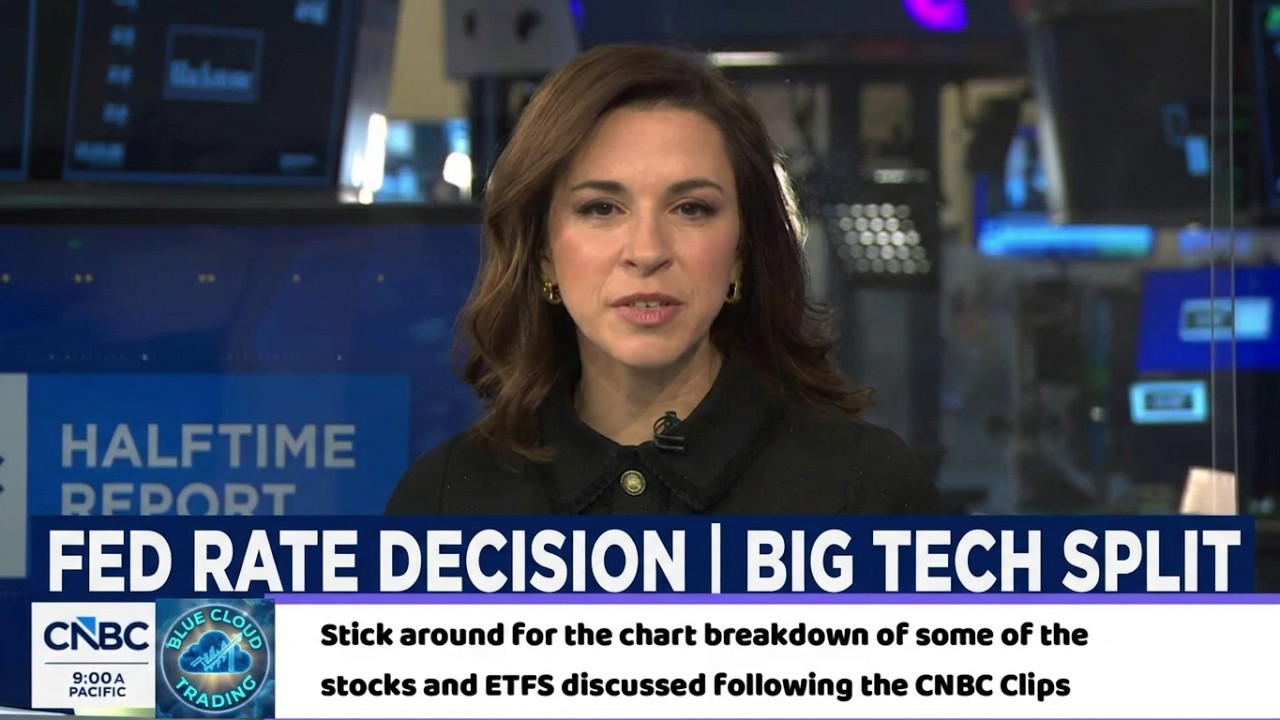
Blue cloud trading [singing] through the night. >> Welcome [music] back to the channel everyone. In just a second, I'm going to play a few CNBC clips. I'm going to pull up the charts and [music] dive into the technicals and see if the price action actually backs up what the talking heads are saying. Subscribe if you haven't already and let's roll the tape on the first clip. >> Thank you. And Carl, Carl and Sarah, welcome to the halftime report. I'm Lesie Picker in for Scott Wapner today front and center this hour. A critical day for your money with a Fed rate decision and key tech earnings on deck. [music] We're trading it all with the investment committee. With me for the hour, Joe Teranova, Brenn Talkington, and Bill Baroo. Let's Joe, we'll start with you. So, obviously the market is expecting a hold. In terms of commentary though, what do you think the bond market is looking for? Do they want more of a a hawkish tone from today's conference? It's it's interesting because we have had a significant fall in yields over the last two weeks and that's had a positive effect on the momentum factor and the AI investment theme. Um I think it's going to offer the Federal Reserve and Kevin Walsh a bit of relief seeing that pullback in yields. I think the market has clearly accepted that they will be on hold for this meeting. I think the market is also anticipating that there is one more hike somewhere down the road here. If you were to tell me we're going to go into 27 with an extended hiking cycle, then I think the market has to recalibrate and to begin to price that in. But I think the evidence in front of us right now suggests that market participants are comfortable that maybe we have one more and from there we're on hold. >> Steve, how do you think the markets should interpret some sort of disscent here? Um, you know, historically the markets have liked everybody to somewhat be on the same page, but if we do see dissents, what do you expect the reaction to be there? >> I've got a little poem that I wrote, which is that dissents can lead you astray or they can lead the way. Last time they led the way, Leslie, the there were a couple descents and then the Fed followed up with rate hikes after that. So, it's worth noting. It's worth thinking about uh what the reasons are for the descents. It's also worth thinking about what chair wars has said which is that if the if he does not have confidence that inflation is heading back towards target then the Fed has work to do. Those are those were his comments. So I I guess there are reasons to skip now reasons to give it more time. I think one of the things that happened during the interme period is you had people like Fed Vice Chair Jefferson uh and and John Williams step forward and say the Fed could take its time here. uh and that was clawing back the flexibility to decide either way. The market went and decided the Fed is not hiking this time around. Um Joe is right. There is a another hike priced in. But it's also worth pointing out the market has more than that priced in for 27. As many as two rate hikes priced in. You take a look at the 2-year yield at uh 474 and change. I guess the last minute I looked at it, there it is 477 now. You know that's almost 90 basis points, 100 basis points over the Fed funds rate. So, the market thinks the Fed has more work to do here, >> right? I I had no idea you were such a poet, Steve. Uh, keep it coming, Bren. The Fed hike, you know, it hasn't done much to slow energy induced inflation. How do you think about today's meeting in the context of the broader macro backdrop where you do still have inflation above target, unemployment is still below 5%, financial conditions don't appear to be tight and given what we've seen with yields more recently, perhaps even less so than maybe a month ago. Um, you know, h how do you square the case to hold at this meeting against that backdrop? >> I think that's a great question. So, just like first principles, the Fed has one blunt instrument. Um, unless they're going to mess with the balance sheet, which I don't think they will anymore. They have one blunt instrument, and that's moving around Fed funds rates. And when you have inflation that is created from too much credit, that blunt instrument is very effective, although there's long lags of actually slowing the economy and we'll say slowing inflationary pressures. But right now, that blunt instrument of moving interest rates higher will have zero impact on the drivers of inflation. And so I think that you could say maybe we'll get a one rate hike in December. But to me, they're going to be on pause outside of that because those drivers are just not going to be affected by what the Fed does. At the same time, the real economy, if you look at real estate, you look at like commercial real estate, look at housing, these higher rates are just killing those sectors just because we haven't had those rates in so long. And so I think that the the the the slower move is going to be the right move. Also, Leslie, I think it's very important about 8 trillion, Steve can correct me, about 8 trillion of US debt gets refinanced on a one-year basis. And so the interest that we pay on our debt is incredibly sensitive to short-term rates. And so while that's not a key driver, I think of a move in December or early next year, it's definitely going to be impactful. And so for those two reasons, I don't think we'll get much more rate hikes just like looking at this year or next year. >> Steve, uh, what is the the number one priority you hope to hear from Chair Wars this afternoon? Well, my objective today is to ask a question that doesn't result in the answer. There's a task force for that because that is how the uh chairman has parried a lot of the questions coming his way. Um, look, all you can hope for is some attempt to get a sense of the framework that the Fed chairman is using to uh think about policy. Nobody wants him to tell us exactly what he's going to do at the next meeting. All we want is a a framework. Let let me just throw out Leslie this idea of of maybe a caution of a little bit too much wishful thinking. Uh the idea that the rate cuts the rate hikes go away for next year. The idea that the Fed shouldn't hike because it will have no effect. Um, the way the Fed has an effect is to raise rates to the point that it brings economic demand below potential and it only has the one tool and Fed Chairman Worsh has been very clear about the idea that inflation is the Fed's responsibility and is going to deal with it. So, I would just be a little careful about about dismissing the potential for the Fed to be more extreme or more aggressive than people expect if this inflation problem doesn't go away on its own. >> Right. Good point. Well, hopefully uh you know, we can look forward to a question in the form of a poem. I don't know if that's on your radar, but um >> there'll be a song about that. >> It's worth tuning in. It's worth tuning in. Uh Steve, thank you. Appreciate it. Steve Leeman, busy day today. Let's turn to the other big story coming our way. It's earnings. We get results from Alphabet and Microsoft after the bell today. Um Brenn, let's start with Microsoft because there's a lot out there on the whisper number for Azure 47 48% for the quarter. How critical is that for the expected aftermarket activity for Microsoft today? last quarter really turned the stock for Microsoft around um Alphabet as well. But I mean both of these numbers are going to be blowout. I think that there is a definite correlation between Azure numbers and compute and I think that Microsoft is finally getting their co-work to work. We use it all the time. I think usage numbers are going to be great. They've talked about Amy Hood's talked about free cash flow positive. And so I think enterprise is going to be strong. Co-work's going to be strong. Cloud's going to be great. And what's important about that is unlike Meta, which Muse is so popular and is very it's very effective. But unlike Meta that doesn't have a cloud, I think the market's going to be very comfortable with the spend that Microsoft has because they have this huge cloud platform. And the same goes for Google as well. And so I think both are going to do just like fantastic. We'll see how the market reacts, but these cloud numbers I think are going to be um all-time all-time highs, all-time high growth as well year-over-year. >> Yeah, Bill, that's essentially what Dan Ives was talking about as well, where he said Microsoft's double-digit operating income growth uh helps it fund its AI buildout, whereas peers have to sell equity or debt to to finance it. So, you know, how how critical is that in this point in the AI cycle, especially given the jitters we've seen in recent weeks? >> Yeah, I mean, the capex over 50 billion for the quarter and they've uh committed uh to positive free cash flow for the year. The the quarter 2 guide and any changes to the 2026 envelope is what we're what's going to move this. I'm looking at the chart and I'm looking at how this price action has been over the past uh maybe couple months. I mean it I think the the elevation that we've seen the market is looking very positive. I I expect this stock to really break out get out above 550 in the coming weeks on the heels of this report. The Azure dollars is going to be reported and uh $34.5 billion. So it is the guessing game behind that the the guide I think we could see something above 45% with that beating that consensus some whispers above there. I I think that we're going to see strong numbers. If you look back to Meta's report last week, you know, the stock acted pretty strong initially and then it's been selling off since. I think we're going to see a story where where Meta and their capex and their free cash flow really set the bar on on, you know, how bad it could be. And then I think we see something here that is less bad or even better than expectations from from the whisper side of it. And that's going to be a tailwind to this stock as well as Alphabet. So, Microsoft at 550 then you you already own Microsoft. Are you buying then in anticipation of that? >> No, it is one of our top five holdings and we're going to sit tight here and watch this thing try to uh extend higher. I think if there's um some serious breakout and we like the momentum behind the market that maybe Microsoft is a is a place to lean into, but there could be some other opportunities as well. >> You don't own Microsoft. You own Alphabet though. >> Expectations. Yes. Expectations, sentiment, and positioning. Those are the three words that you always have to think about. Um, on July 22nd, you had the report from Alphabet that reversed everything that Alphabet had done from June 1st of the prior year through June 1st of 2026. Stock was up 116%. Subsequent to that, since July 22nd, Alphabet is down 5%. Why? Because the street got uncomfortable. Street knows that what you're going to hear tonight is two great examples of companies that are able to tell you how they're monetizing the spend. You have a proof point. You could see it in Azure. You could see it in Google Cloud. But the concern that the market had was the turn in free cash flow to being negative for Alphabet and the significant elevated spend at $200 billion. So what you're looking at tonight is the expectations that are embedded. Microsoft and Alphabet have both underperformed the S&P so far year to date. So, who's in the better position from that standpoint of expectations, positioning, and sentiment? I would argue it is Alphabet because it has already priced in that bearish activity since its earnings report on the elevated spend. As it relates to Microsoft this evening, I think you have to see the report exceed all of the expectations to continue to carry forward this 36 plus% gain that we have seen since the end of July. Um I think that's the important way to think about these mag seven companies is where they are coming from, how is the market positioned and ultimately what is the expectation as you move forward. In the case of Meta, just look at what Meta has done. It has reversed all of the gains that had it is it enjoyed from the September announcement from Muse. 6 and a quarter was the level. It had the significant spike and it's reversed everything right there. And it did so because it had such high expectations. It had extreme bullishness and it had extreme bullish positioning >> and it's out there raising nearly hundred billion dollars in equity. And that is a a a a awful combination when you have that time of extreme bullishness embedded into a stock. You don't have that tonight going in with Alphabet. And to a certain extent, it's lesser with Microsoft. >> Uh Bill, you recently trimmed Meta. >> We did trim Meta. To add to Joe's point real quick on on Alphabet, it's trading at support. I mean, it's it's right there trading at support. And I I I do agree that we're going to see a very strong report from from Alphabet. Um you know yeah we we did trim meta and that kind of that's on the heels of of my comments too last uh in this last uh Microsoft was it was a two and a half percent position uh meta was and we brought it down to one and a half%. We were looking post Muse, we were looking for excitement behind this earnings report. Um I the capex story is just a complete headwind right now. 135 billion to 145 billion is what they're looking at for 2026 capex. And then some of the estimates for 2027 are up towards $200 billion and the negative free cash flow. Joe talked about that too. This is such a headwind is in that negative free cash flow. Meta's there and um I mean the stock is telling us too. We got to listen listening to what the market is telling us. The $700 um it got back above it's now surrendered that there's a tremendous amount of resistance there. We are trying to raise cash to have some flexibility as we look ahead through the midterms into the final end of the year. I think the market's going to do terrific as we look into January and we want to make sure that we're able to lean into things that we really really like. And for now, Meta is uh is is a sacrifice here that that you know, we don't like the story behind it. Did not follow through on the on the Muse news uh post earnings and uh we have to trim it. >> Listen, I also think all of these MAG7 companies, they're benefiting from the mood of the market very quickly, reversing from being incredibly pessimistic last Thursday and Friday to now being more optimistic. And a lot of that is rooted in two earnings reports today. I think there's two two companies that are driving the continued appreciation we've seen this week. Number one, SKH Highix. Yep. >> SKH Highix. It is lifting all of the memory stocks. Western Digital reported last Thursday had great earnings. What was the price action? It was negative. We heard from Seagate, great earnings. The price action this morning was negative. If you pull up uh Seagate, it's now higher on the day. And I think that's attributable to SKHEX. In addition to that, look at Vertive. It's up 13% today. That is giving confidence to the industrial sector as it relates to the relationship between AI, the spend, and the ability to drive revenue growth. Vertive, that is a blowout quarter. It's giving confidence. It's restoring optimism. So given given what you've just shown there and what you talked about with regard to sentiment then this earnings season for the the broader AI trade is it less about what we're seeing from the numbers and more about the the market reaction and the trend. I think it's always about reaction and I think it is about sentiment and I like the fact that over the last several days in particular today I think those two reports are incredibly powerful catalyst for extending the optimism through [snorts] the end of October into the month of November and I think it lends itself well as we begin to hear more and more from the mag 7 companies and some of other semi- equipment names. Lamb Research, they reported on October 21st bad price action after a good earnings report. Guess what? That happened to be an earnings bottom. That's now moving higher. We'll hear from KLA Corp. So, I like the fact that we are reversing some of that pessimism that we carried into this weekend and we've done it very quickly so far this week. Hopefully the Fed doesn't take it away tonight. [laughter] >> Bren, do you agree with that? that uh memory is kind of this key read for semis and tech and just the overall trade. >> I mean absolutely and especially South Korean memory. You know I I bought DRAM before SK had their their IPO in the US because Samsung and Samsung and SKHEX are like 45% of the DRAM ETF and I mean the the numbers from SKHEX were insane. So quarter over quarter their revenue was up 32%. Quarter over quarter operating profits up what 38%. So that's quarter over quarter. I mean they are booked out. Half of their bookings are already contracted out through 2028. They're booked also with long-term contracts to 2030. And I think when you look at the the price action of SK or DRAM or or Samsung, there's just peak skepticism. And if you think about what we hear from Microsoft or Google, there's the spenders still. They're still the spenders. The recipients are all of those companies that Joe just mentioned. And that this to me, this skepticism is actually quite healthy because it's really dampening animal spirits because you have to, you know, kind of like just like hold your nose and buy some of these names just because the trading action has been so terrible. But at the same time, the numbers totally contradict the price action. So, it's nice to see the price action and the numbers finally coming together for at least today. >> Yeah. >> Leslie, can we show GE Verova intraday because the bears will say, "Okay, what about GE Vernova's price action today?" They did a $9 billion acquisition of a German company, Trench. Um, look at that price action today though. It is recovering alongside of what we're seeing with Verdiff. Verdiff 74% growth in the Americas in terms of their revenue. Staggering numbers. The best report they've put forward in 5 years and the last one is Pterodine that reported semi-equipment today. Don't look at terodine and say okay that is a referendum on semi-equipment. It's idiosyncratic to terodine their outlook clearly was less exciting than the street anticipated. So, this is kind of emblematic of a a stat that Goldman had this morning, their trading desk, where they said with two months left in 2026, Flagship Momentum, their flagship momentum basket has already recorded 39 distinct one-day moves of 5% or more, other than the 42 occurrences in in 2020, which is possible that we get there in 2026. That's higher than any year they've seen since at least 1999, just showing the price swings that we've seen. And I I know you study this stuff closely. Yeah. Then then you wonder why the NASDAQ is recording a 52- week high in the last several days and I own personally SIBO which has had a a spectacular bounce here over the last 4 days. I think the exchanges come back into play here as we move through the end of of uh 2026 because we're going to see that elevated volatility and who knows maybe it benefits the trading revenue for some of the banks. which it but it softened in the last quarter relative >> the fixed side softened but the equity side was very strong >> relative to what we saw earlier in the year though those were those were some tough numbers to to kind of comp against >> yeah it's been a a remarkable 2026 for the equity trading desks uh at least here in the US up next our halftime headliner city head of wealth Andy Sie is standing by will talk the state of the markets and the financials ahead [music] of today's Fed decision halftime is back in two minutes welcome back joining us now is our halftime headliner, city's head of wealth, Andy Sie. Andy, it's good to have you here at Post 9. >> Great. No, thank you. >> Thank you. Um, so city reported earnings a couple weeks ago. Wealth revenue increased 15% in the quarter. Net new investment assets doubling year-over-year. Reports say you were hired personally by CEO Jane Frasier three years ago to turn around this wealth business. And I'm curious where you are on that journey and how much of the recent growth do you ascribe to market and asset related tailwinds versus the strategic changes you've been making at the firm? >> Well, um you know, first of all, the business is rocking. We've had 10 quarters of revenue growth and so this has been sustained performance. We just had uh not only strong flows, these were all-time record flows for us. Over 38 billion of net investment flows in the quarter. We got returns up. We still have work to [music] do on that, but we're definitely at a different phase around the business. There was a lot of change necessary over the last few years. We've made the changes. We got a very strong team in place across the board and at this point there's real organic growth happening and markets have been helpful. But what we look for are flows and uh that rate of organic flows um is very strong. It's over 10% rate of organic flows growth. So this is arguably the fastest growing wealth business in the world right now. You recently announced premium boost, which aims at essentially giving eligible clients savings rates based on their relationship with the bank, better savings rates and so forth. How should we think of that program in the context of some of the broader concerns and angst around AI agents pulling money out of people's checking accounts and putting them into higher yielding assets and therefore deteriorating the the margins at banks? I mean, how is this essentially a product that can combat those types of concerns? Well, I mean this type of program, a relationshipbased pricing program, uh it's the right thing for do for clients. It's also actually the right thing for this moment because when you think about what agents are doing, you know, agents are going to help clients be smarter about where is there value in the marketplace. This is a value offering and so we're seeing tremendous response. We've only been in the market for two days. We've had over 25,000 clients already across the country um you know contact us and begin the process of uh subscribing for premium boost. I think you'll see a lot of banks move in this direction and again you know it's rewarding people for making us their primary bank and doing it in a really transparent way increasing the rate on their savings account and uh so it's simple it's powerful it's an attacker move for us because our retail bank it's not a national brand we're in six markets around the country um we've got uh we've got great clients but we can do a lot more with them and so an offer like this is designed to deepen those relationships and have people bring more of what they do to city. >> Interesting. Speaking of relationships, about 6 months ago, you launched an AI client tool called City Sky, which I know has been rolled out over the summer. Um, how has it been going and how what has been kind of the response from your financial adviserss who wonder how much of their job could be replaced by an AI financial adviser in the future? >> Well, you know, it's interesting. I think our our financial adviserss see this um in many ways the way we framed it which is a new AIdriven team member for them. Uh so it gives them you know more bandwidth on their team the ability to be more productive. Clients get it. They kind of know you know when they're going to want to talk to a human and when they might want to use a tool like this. We have been proceeding a little slower than expected with the roll out because we want to make sure this has to be a very trusted um resource for clients. There's a lot of agents out there in the world. You know, this is a a version of AI that clients can understand. It's secure. It has access to your information at city. It knows you from prior interactions. And you know, they can uh we think feel confident kind of opening up around questions on their mind around uh offers like premium boost, but also questions like, you know, like am I saving sufficiently for retirement? And so again, we're in the very early days, but I think we can we can see this type of tool. It's going to be um you know, all across the banking landscape and city wanted to be first. Andy, it's great to have you here today so we could talk a little bit about asset allocation and the messaging surrounding it most importantly, not exactly uh what the waitings are. Let's talk about private credit and private equity. What is the messaging to clients as it relates to those two asset classes that have had extreme volatility in 2016? >> I mean, hey, I I I think we need to take a step back. The broad messaging is the markets today are very different than the markets in the 1980s or the 1990s. There is so much activity that's happening in the private markets. If you just have a public market allocation, you're missing out on a lot of action, a lot of opportunity in the marketplace. So, um, you know, you started with the phrase asset allocation. You know, the second thing I want to say, this is about discipline. It's about making sure that you've thoughtfully, you know, set an asset allocation consistent with long-term goals. Our clients tend to not be timing the market. They're in the market for 10 or 20 or 30 years. And so, we still see private credit and private equity as, you know, key parts, key key building blocks for asset allocation. You know, the question is, do you have a diligence team that can help make sure that uh this this is a it's a strong asset management firm? we understand how they operate and that clients again are not looking at this as a trade. They're looking at it as a long-term uh allocation. I think from that standpoint um you know clients have been happy with the returns that they've had and u and you know we continue to recommend this as a part of portfolios. >> And how do you get a younger generation that has grown up on generous equity returns to realize the value in fixed income? >> Hey, it's tough. That's the role for an adviser though when you think about what advisers do. It's not reinforcing things that are easy. It's helping clients kind of step up to things that are hard for them to do on their own and you know and take the time to think about risk time horizon boil that to an asset allocation and then think about how do you manage those assets uh very well. Um again you know it seems like it would be simple but we're all human. We're kind of drawn to the hot dot. You know we're fearful at the wrong time. We probably read the headlines a little bit too much. No offense. and um you know but that's uh when our when our advisers are doing their job well it's anchored right there in asset allocation. >> Andy Sie, thank you very much. Appreciate your time today. >> Thanks so much for being here. >> Good to see you. >> Thank you. >> Bren, uh you own Bug Cyber ETF. >> Yeah, longtime owner. I mean I think that obviously Bill crushed it owning Crowd Strike, you know, in a singular name. I like the diversification. It's still concentrated. I like that diversification. So, I can just own it over a cycle because, you know, this, you know, all of these cyber stocks just ripped it. You know, earlier this year when we all came to the realization, we're going to need more cyber security, not less from all of these AI hacks that are seem to be upon us. And so, I'm a long-term holder. Don't need to trim it. I have it sized right. But kudos to kudos to Bill for having Micron at 70 and Crowd Strike uh at equal prices uh well below where they are today. Credit where credit's due. Uh, Bill, you also sold the Q uh CQQ China Tech ETF and Bespoke is flagging that China is one of the four countries in a a bare market right now. The rest in bull markets. >> Yeah, this was a we have a tactical ETF uh model that we run in diversified portfolios along with our stock model. It this this tactical ETF covers a 10% of the entire portfolio. We looked at CQQ as a little bit of a hedge to our significant overweight in semis, you know, as as China may have been and brought some competition in the memory space. That did not turn out to be true. This thing has been a dog all year all all year long. It's uh it has not worked out. We're going to we're going to admit that and and it's okay to be wrong. Um for us, we we're going to cut it and move on and uh and what we've done is put the money elsewhere in that and buying XTN. Uh we love the transports. We think the transports are in a secular bull market. Transports have pulled back from the highs. They're retesting their prior year highs for the last two years. Um, now we chose XTN and that's an equal weight transport index compared to going with IYT which is extremely heavy on the rails and Uber up top. But I think this equal weight is the way to play it. Um, and I mean the growth in the United States has been tremendous and I think we're going to continue that trajectory. I I I like having transport exposure in the portfolio or as an ETF in a in a tactical manner. >> Interesting. In a in an equal weight manner at that final trades, Bill >> RTX with the cash that we raised, we're putting half of that to RTX. High quality defense name. It's back above the 200 moving average this week. >> Bin Tesla and you can sell the February 450 strikes and get $20. September 1st, I bought Nutrient at 7567. It's gone nowhere. It's a losing trade. I'm selling out of it. >> All right, that does it for halftime. >> On the employment side of the Fed's dual mandate, conditions are quite positive. And yet, Americans, of course, are still dealing with inflation that has been running above the committee's objective for close to six years. It's our responsibility to get inflation down. That's the reason the FOMC's discussion over the last couple of days focused mainly on the price stability side of our remitt. So Scott, I just it's pretty easy to do the math tomorrow. We get the uh PCE if it comes in at expectations, you're going to be up at 3.1 core PCE. If the Cleveland Fed now casting inflation number is right for October, that's another tick higher in inflation. So, I think it was Jeff who said we're headed to 4% inflation. I'm looking at the core uh still going in the same direction. So, I think that the Fed is going to have to address this through rates. Uh but that's not what the chairman said today. >> I can't I can't help but think either if he hears any part of this conversation where he may hear you say, "I don't know where we're going from here," he's like, "Yes, it's working. I don't want them to know where we're going from here. >> I I I I would push back, Scott. What is working? Why is it better to go into a meeting with a higher probability of the opposite happening? Who benefits from that? What is the benefit? Maybe Jeff has an idea. I'll leave it to him on that one. But but uh I I don't know that anybody is is better off that the markets are better off, the economy is better off with that kind of uncertainty. Now, uh, you know, it was like a 10% uncertainty going into this one. I look back at, uh, many of the meetings of Powell in the last several years. It was like 1.2%. >> Steve, I appreciate it as always. Uh, that's Steve Leeman just coming out of the room, our senior economics correspondent. Jeffrey, I'll I'll come back to you. I mean, how about that? This He's not given guidance, forward guidance. He said he's just not going to do it. So, we know that is the case. But what do you make of what uh, Steve has said? Well, yeah. I I think that uh Kevin Worsh was uh a little bit uh a little bit testy today. You know, I think he he reprimanded Steve for saying, you know, you asked two questions and somebody else asked two questions and he wouldn't answer one of the questions. But I basically I I just feel like the the Fed is a little bit behind the curve right now and I think that they need to hike interest rates at the next meeting. think they're going to given if you look at the probabilities in the market. But basically, I'm in the same mindset investment wise that I've been in uh at our last visit at the at the last meeting. I'm really looking at about a 30% allocation to equities. And in my current state of mind, I only want the equities to be in equal weighted S&P. I don't like the cap weighted S&P. I don't want all this exposure to the epicenter of the blast radius of the AI uh uh problems or developing problems. So I like equal weighted S&P and interestingly it's it's outperformed or slightly outperformed the market cap weighted S&P recently and also year to date. So that's a relatively low equity waiting that I'm recommending simply because the valuations are very high and the spreads are starting to widen out on the bonds. I also continue to recommend 30% in bonds uh with a barbell approach half in a very safe portfolio. one that has virtually no corporate credit exposure whatsoever that's completely domestic and in a highly investment grade largely non-corporate bonds which happens to be exactly what my how not surprisingly my flagship bond fund is positioned and I also still like half of the 30% bond allocation in local currency emerging market debt where we continue to have the strongest performance although it's been a little bit rockier at points during the year, but I think the dollar still goes lower and because of that, I think you're going to continue to make money on the currency translation and you're getting a decent yield out of those emerging market bonds. So, that's something I've been in increasingly since a year ago June. I still like 20% in commodities. Uh right now, I would have 15% in simply the Bloomberg Commodity Index and 5% in gold. But at this point, what I would do is every time gold drops $100, I would switch 1% from the broad commodity index into gold. So ultimately, if the spot price of gold gets to 3500, you would be 10% commodities broadly and 10% gold. And that leaves 20% for dry powder, which I've been recommending for a while now, which also doesn't mean tea bills or cash. It means like a two-year duration well-managed low-risisk bond portfolio where uh you can get yields of about six 6 and a half% with a duration of two which means that you have what we call the Sherman ratio the yield divided by the duration of over three which means you're not going to lose money on a total return basis in that type of strategy. Even if interest rates rise by over 200 basis points you're still going to be positive and you're getting real rate of return above the inflation rate. So, it's sort of Go ahead. >> I want to make sure I saw this correctly, too. Uh, when I was doing some some research ahead of this, the Doubleline Commodity Strategy ETF, the DCMT, >> has a year-to- date return of 44 to 50%. >> Yeah, the last time I looked at it, earlier this week, it was up 48%. >> So, that's better than the commodity index, but it's a it's a rules-based strategy that has has it's been it's been good. We've had energy and obviously that's what's driven the commodity complex and uh yeah it's up a lot. It's been it's been kind of sideways for the past couple of months, but uh certainly it's been a phenomenal return here today. >> Hello everybody. Welcome to BlueCloud Trading. I'm George. It's Wednesday, October 28th and it's 6:53 p.m. Eastern time as I'm recording this video. As you can see, the markets were all up today just slightly. The S&P 500 was up 28, NASDAQ up 27, the Dow was up.19, and the Russell was up 04. So, not a big move, but you can see the majority of the day the markets were pretty flat. Uh, what we're going to do in this video, folks, is take a look at this aftermarket performance heat map, uh, as well as the closing heat map. We'll also take a look at the following about 11 ETFs that you see here on the lefth hand side including the SPY, QQQ, Dow, Russell 2000 Gold Silver Bitcoin Ethereum the Euro stocks. We'll take a look at another 26 stocks and ETFs that were discussed on the halftime report and closing bell um that we just saw. And we will also take a look at two of our members requests, CINF and HO. So, let's why don't we do this? Let's go ahead and um get started. And we're going to first start off. Let's take a look at the news real quick, too. So, Fed came out today around 2 PM. And let's see. Let's get the information right here. Fed leaves rates unchanged as it awaits accumulation of more information. So, the market seem to be and that's why I think the market is also unchanged. Um, Microsoft came out with earnings, Alphabet. We're going to look at those charts in a few moments. Right now after hours, Google is down 10% but Microsoft is up. Um, so let's take a look at the heat map first. Here we go. We're using Finn Viz Elite. There's a link for this, by the way, in the description area. All right, guys. So, check this out. Let me zoom out for a moment. Um, okay, that's good. That's not bad. All right. So, we've got what we're looking at here is today's um S&P 500. What the heat map looks like. As you can see, it's very, very mixed, right? Um at the end of the day, Nvidia was down, Apple was down, Micron AMD was up, Google was actually up, okay, at 4 p.m., but they came out with their earnings after hours, and you'll see what happened. Uh Amazon, Tesla, you can see Microsoft was actually down 06% at 4 p.m. when the market closed. But let's do this. Let's go ahead and switch this heat map real quick. And we're going to change it to aftermarket performance. And do you see what's going on with Google is down 9.64%. While Microsoft is up 2.8. All right. And it looks like the healthcare stocks are doing pretty well. Consumer defenses are doing well. Energy stocks are doing well after hours. So that's a good sign. Let's take a look at the groups. We haven't done that for a little bit. We're going to zoom in for a moment. The one day performance you can see technology, energy, healthcare at in the top three, right? Utilities, real estate, consumer defensive bottom three oneweek performance, technology, healthcare, utilities, real estate, and energy. And uh communication services is down the most, down point, I'm sorry, 4.76%. Here's the one month performance with energy the leader up 9.8%. The technology down 1.97. Communication services down 7.09. Very interesting. So, all right, let's get into the charts. And so, we've got the oil KH here, the ProShares K1 free crude oil. Just a quick little summary of what we're looking at is the Ichimoku indicator. I already went over how to, you know, all the details of this indicator in yesterday's video, so check out that video. But just real briefly, we want price to be above the green line, which is the nine period. We want it to be above the red line, above the 26 period. We wanted to be above the cloud the single span A and single span B. We want Chico span the current price to be okay which is projected 26 periods ago to be above price 26 periods ago. When we have all of that that's a very bullish chart obviously and you can see just by looking at it we've got a series of higher lows right and we've got a series of higher highs which is very important and that of course leads us to a upward channel. So, oil K doing really well right now on the daily chart and it also looks great on the weekly. Okay, price above those moving averages. They're in the correct order with the faster moving average, of course, above the slower one. That's important, too. Looking at that directional movement index down over on the bottom here, we've got the green line above the red line. That's the positive DI9 above the negative DI9. That's very positive, too. and the ADX9 which is also superimposed here. The white line which represents momentum is also increasing well. So you can see that here as well. So this is what we're looking for and this is this is why this particular ETF gets that blue flag. I give it the blue flag. So I like it. What about the rest of these ETFs though? Well, there might be something wrong on one of the time frames, either the weekly or the daily chart. And so they got disqualified from getting that blue flag. Let's look at the spy. Here it is on the weekly chart. It looks fine. Nothing pro no problems here. We're still basically inside these consolidation boxes basically, right? We've been moving sideways on the daily chart. Um, you know, it's just a sideways action. We've moved up four days in a row here in the SPY, but the faster moving average is into the slower one. And the cheapest band, remember that white line that I mentioned? That's under the candle. So, that's also not bullish yet. But otherwise, I like the spy. I'm not um you know I don't I'm I'm more neutral right now about it. The QQQ ETF all right also has a few issues with a faster moving average under this lower one and price under the the 26. So the QQQ is not looking particularly great here in the daily chart and the future cloud is also bearish. That's when the same span a the light color blue line gets under the purple line. So I'd hold off on that. Now if you look at this of course on a higher time frame like the weekly we're still in an upward uh channel. Okay. And uh price is above the 26 period when it's under the 9 period currently. This is a good sign though the fact that we're we're looking more and more bullish this week. This candle is forming nicely. And here's again four days in a row where price has been moving up. And today price actually did break and close above the cloud. And that's also a bullish sign as well. Um but you know it's just not perfect yet. We've got the chica spin under price here in the daily. The red line is above the green line with the directional movement index. So I'd hold off. Okay, DIA ETF has also been showing some strength. You know, since the lows down here October 1st, it's moved up a little bit, but it's inside the cloud. It's neutral territory on the daily chart. So, I'd hold off on that one. Here's the weekly chart. Looking very bullish still with price above all the moving averages. Russell 2000 is under these moving averages on the weekly. And on the daily chart, it's under the cloud. It's been showing some strength also since these lows here. Uh it's moved up about almost 4%, but I would hold off on the Russell at this time as it's in a decline still. Okay, it's I mean it has broken through a trend line. If you draw a trend line from that high there and you superimpose it all the way through, you'll see that for a couple of days now on this daily chart, we broke through that trend line, but we still have all this resistance above and I'd hold off. We haven't even taken out this prior high. So, you know, just we haven't even established a higher low yet. You know, right now we've got a series of lower lows. So no on the Russell the VIX dropped up some more down 3.94%. That's that's very positive. We want to see that dropping. That's the volatility index. Uh represents fear in the markets and that's dropping too. So let's look at some more ETFs. FEZ Euro stocks. Now um interestingly enough the Euro stocks here it was up 0.24%. Okay. um at the close, but I noticed something earlier when I just switched the um time frame up here to show to also expose what's happening after hours. And check this out. Okay, down 5.4%. So, I haven't really done any research to find out, but I'm sure if you do a Google search to find out why is FEZ Euro stocks dropping right now and is it, you know, it's dropping quite a bit, you could probably find out some more information about that. Um, all right. So, just put it back. So, boom. This is what it looked like though at the close, which is interesting. Gold is still in the downward channel. Okay, GLD on the daily chart. I'd hold off on that one. Obviously, it's still under the cloud. Silver is also under the cloud. Bitcoin is above the cloud, but under the moving averages, so it's it hasn't it's been dropping since uh October 2nd. It's dropped about 6.6%. Ethereum also inside the cloud right now. So, that's neutral on the daily chart. We're still We basically dropped from these highs over here in October 2nd down 15%. Okay, at least last three days it's moved up a little bit. Nothing major. Okay, let's get into the stocks that they talked about on the show and ETFs. Out of 26 that we're going to run through very quickly, just three of them qualify and get that blue flag. DCMT, which is a double line commodity strategy ETF. As you can see here on the daily chart, price is above the moving averages. Cloud is very bullish. Same thing on the weekly chart. Okay, Microsoft. Now, Microsoft came out with their earnings, right? So, this is where it was at at 400 p.m. at 5:31. Let's go ahead and click that button to show us what it looks like post market. Boom. Moved up a little bit. It's at 54545 right now. Um, see that long wick at the at the top here? That represents a little bit of selling that's also happening after hours. If I switch it to a shorter time frame, like a five minute. Here's a big jump that happened at 4 right after 4 p.m. after the earnings announcement. And right now, I think what's happening is, you know, basically it's just moving sideways. It's inside this little box here. Uh, tomorrow will be an interesting day to see what happens with Microsoft, but right now, uh, it's just kind of moving sideways. Okay. Okay. But it was positive positive news. They they came out with good earnings and it was rewarded. Uh let's take a look at the I'm going to switch it back to regular hours. Let's go to the UUP the US dollar index bullish fund. Now this is uh down 21% but if you look at the daily chart here price is above the moving averages above the cloud. Same thing on the weekly chart. I've already previewed all these on both time frames. So that's why I can, you know, tell you that these are the three that are looking the most bullish right now. Price is also above the 200 over here. Um it's in a series of higher highs, higher lows on the weekly. And on the daily chart, same thing. We've got a reversal candle. Okay. Uh we got a bearish uh candle pattern called bearish engulfing right there. So that's when you have a small bullish candle followed by a large red candle and it represents the selling that took place. What happened was price moved up slightly and then dropped and it not only did it drop and close um below the uh closing price, the prior day's closing price, but also below the opening price for the prior day. That's what makes it bearish. Okay. Um and there's a um a cheat sheet that I have that you guys can use if you want. I'll just show you guys that real quick. It's on my X page. So, you can find this cheat sheet here under x.com/ SLBCcloud trader. Okay, that's the website. There's a link for that too. If and you can if you want to you can follow me. I do post other things as well on here including there's the most recent video members only video right there and articles and stuff that of that nature. Okay. Um but yeah, if you click on the candle pattern reference sheet, click on that. Boom. You can see here there is the bullish harami. Okay. And we're looking at this is the bullish engulfing right here. This is the bullish version. And this is the bear. I'm going to go to under bearish. And there's a bearish engulfing. Okay. Small candle followed by a large red candle that engulfs it. Okay. That's basically what we've got here. And it's just larger. All it needs to be is just larger than the prior candle. Doesn't have to be extremely big. Okay. So, is it still very bullish? It is. Okay. Um but I would just be watching this tomorrow to see where what happens uh in the morning. The rest of these guys, there's something off technically. Let's take a look at Bug for example, which is actually one of the stock I'm sorry, ETFs that I had in the blue cloud portfolio. I added it back on September 15th and closed out of it today, this morning, actually. And I shared that uh trade with members uh legend level members. So if you guys become a legend level member, okay, to do that, you just click the join button. It's next to the subscribe button. Free to subscribe. Click the join button if you want to get access to the member only videos and the posts. So when you become a BlueCloud Legend level member, this level here, you will also get access to posts. And once you click on that and you become a member, there'll be a new tab that pops up right next to posts. It'll be right over here and it'll look like this. It'll say membership. Okay, that's where you'll be able to access those posts or at the other post right here as well. All right, so let's get back and let's talk about this for a second. You can see here um Bug on the weekly chart. Very bullish trend, right? Very bullish trend. Everything has been looking great. It still looks great. There's nothing particularly uh bad about this because it it still technically meets all the criteria that we're looking for. The only problem that I had and why I closed out of the position here was because of this reversal candle basically and I just wanted to take profits and sometimes that's what I do. All right, let's take a look at the next one. Cityroup, it's in a decline. It's under the the uh Ichimoku cloud. It's uh was up 1.16% but uh this thing that's stay out of this this uh stock at this particular time. Look at the weekly chart. It's still above the cloud, but under the moving averages. It's been declining now since um June. It's dropped about 17% or so almost. CBOE is the CBOE global markets in the financial data and stock exchanges. And here's the weekly chart. Got a bearish harami on the weekly that's forming on the daily chart. It just closed today under the um right under the 9 period. So, it was down 1.2%. I'd hold obviously wouldn't be adding positions in that CQQ. Look at this Invesco China Technology ETF, guys. Look at this. It's It's been um it's been hammered. Uh now, if we look the last time that we were above the cloud, above the moving averages was right over here on this candle, July 10th of 2026. Since then, it's dropped 28.42%. That's a huge drop. And you can see how the this indicator would have kept you out of that trade at least, right? So again, you never want to be adding positions when price is under these moving averages or under the cloud because we're in an established downtrend. It's hard to predict when it's going to end is my point. Okay? So when people say, "Oh, I want to buy it uh I'm going to average down, you know, average into it as it's dropping." Personally, I don't think that's a great idea because it can be not just days, but it can be weeks and it can be months. So, you know, yeah. I mean, the the ultimate high was back here in 2025, it looks like, right? Am I correct about that? No, no, no. I take that back. Wow. All right. So, that we'd have to go back to 2021 when it was at $19 per share. And since 2021, this ETF has dropped 63.35%. It's had its ups, its downs. Right now, it's in a declining stage. Okay, Crowd Strike. Here it is on the daily chart and you can see that price is above the moving averages but currently we've got the faster moving average under the slower one. I would hold off on that one. Okay. And here's the weekly chart. Still looking pretty pretty bullish on the weekly. I the daily chart is just not perfect yet. Dr. This is round memory ETF under the cloud. Okay. Four days in a row it's been moving up but it's hitting its head right there. I wouldn't be adding here. Here's a weekly chart under the moving averages. There's not enough data here for the cloud to fully form because, you know, it went public back on April 2nd, 2026, this ETF. And so, but yeah, I'd hold off on that one. GEVOVA or GE Vernova is in the utility sector. And this one here, we're getting it was down 1.84% today. Let's look at this is a weekly chart we're looking at right now. It has developed a bullish harami pattern. That's when you have a large red candle followed by a small little baby candle. Okay, that is within the body within the body of the other one. And harami stands for pregnant. So it's easy to distinguish that. It's in the patterns that I just showed you guys a second ago. So um I although that's looks good on the weekly, it's still neutral territory because we're price is inside the cloud and under these moving averages on the daily chart. Let's take a look at the daily chart. We are in a decline still. We're in a downward trend. Okay, stay out of that one, Google. All right, so they also came out with earnings today. Now, what's interesting about Google is, you know, just looking at where price was in relation to the cloud and the moving averages prior to the earnings announcement, which was today. It really didn't make a whole lot of sense to be adding positions. I mean, a position in this stock. And guess what? They didn't come out with great earnings, right? So, let's let's hit that button and find out what's going on post market. Bam. Down 8.1. As you can see, it's still dropping. So, this is not good. Uh there's the daily chart and here's a 3minut chart that kind of shows you the decline here that's happening after hours from Google. This big drop and now it seems to be stabilizing around 5:30 p.m. it started to move up these last on this 3 minute chart. So, it's moved up 2% or so, but uh a big drop. A big drop for Google. We'll see how it looks tomorrow, right? Because there is a wick that's developing on the bottom, which means a little bit of buying is happening. Um maybe it got a little bit too oversold and some some buying is happening. We'll see what happens in the morning. All right, let's switch it back now to the regular C. This is what it looked like at the end of the day. IYT is the Dow Jones Transportation Average Index Fund. It's under the cloud, under the 200. No thanks on that one. KAC is also under the cloud. Uh, and under the the 9 period. Uh, it closed it up 3.33% and their earnings were positive. And so, let's click on the button to see what that looks like post market. Right now, it moved up. So, it's up 8.03% after hours. Here's the 3minut chart. You can see what's going on. 4 p.m. to now. Uh, it's moved up a bit. That's nice. All right. is would I be adding a position in this stock? Uh the answer is no. Why? Because it's still under the cloud. And that's just one of my rules. On the weekly chart, we're u breaking back above the cloud, which is positive. LRCX is above the cloud, but it's on the moving averages on the weekly. And on the daily chart, we're under. So, no one LRCX. The MAGS ETF is above the cloud, but under the moving average here, no on that. NTR is under the cloud. So, no on Nutri Limited. RSP is above the cloud, above the moving averages in the on the daily chart, but the future cloud is bearish. That's when stable spin A is under stable spin B. So, it does not get a blue flag. But if you switch it to a weekly chart, it looks good. I like the Invesco S&P 500 equal weight. Um, but again, the daily chart needs a little that has to transform. Um, it's telling us to hold off at this point. RTX is uh under the cloud. No on that. skhy uh um basically gapped up. You can see that it gapped up uh yesterday like over or pre-market and it moved up even more. It's up 13.3% here, but it's inside the cloud. It's neutral on the daily and on the weekly chart. We don't have enough data to really review this because it's just a recently public company. All right, let's go to STX. And this one here is looking pretty good here on the at least for today up 4.5%. But looking at this daily chart, it's under the cloud. I would hold off on that as well. It is a good sign when you see volume coming in and price breaking above that 200 as well. That's good. It's just not enough for me to consider it at this point. I'd stay out of Seagate Technology. Teer Pterodine Inc. is inside the cloud on the weekly and on the daily chart it's under. know on that Tesla um okay they came out with uh well the next journey is on June 27th but we can see a hammer I'm sorry I take that back um we're looking at a hanging man pattern that red small body and long wick at the bottom I'll just show you guys that hanging man pattern real quick again looking at this candle pattern reference sheet it is right here under this right there. Price moving up, small red body, long wick at the bottom. That tends to lead to a decline. Not always, higher probability. Okay, that's all. Higher probability it's going to pull back tomorrow. Here's a weekly chart. Looking pretty good uh with price breaking through the cloud this week, but the future cloud is still bearish for Tesla. I' I'd stay out of that. VRT is inside the cloud. neutral on the weekly and on the daily chart it's under. No on that even though it gapped up 16.6%. WDC is under the cloud. So no on Western Digital Corp. XLF is under the cloud. No on that as well. Even though it has moved up quite a bit 5.9% uh as a se the sector the financial sector has moved up a bit is still under that cloud. XTN which is the spider transportation ETF under the cloud. No on that as well. All right, let's take a look at our members request. CINF. Start off with the weekly chart. So the weekly chart, you can see the future cloud is the single spin A and S span B are right very very close to each other. Maybe it's slightly under but not that much. And if you look here at price, it's above the moving averages and the cloud. Cheapest spin is above price on the weekly chart. The fast moving average is under the slower one. Okay, that's the only negative that I see. uh on the weekly on the daily chart we have a future bullish cloud that's turning bullish here and um everything looks okay here on the daily chart actually I like it so I'm going to give that a blue flag I like CIFF like again on the weekly um I take that back folks I'm sorry I forgot with the nine period under the 26 we got to remove that but it's overall it's pretty positive it looks pretty good because it's been moving up for the last four weeks remember it takes a while on on the weekly chart for all of this stuff to um to basically confirm to make confirmation. All right, that that this is going to be an um is a actual um buy signal from the Ichimoku indicator. So, it's going to take a little longer, but you'll have extra confidence when that is the case when the 9 period is above the 26. Um I do like the directional movement index that looks good. You can see the green line is above the red line and ADX is moving up. So yeah, daily chart, you know, we got we also have a bearish harami here that's forming today. So just, you know, it's had a nice run here. It's moved up about 12.6% from since September 30th. That's a pretty big move. Uh but I do like the fact that it's popping through here. And remember, it's in the financial services sector insurance property casualty which is although it has been strengthening, it's not quite as strong as a few other ETFs that and I'm sorry, other sectors that I um personally like and that I share with members. Halo Halo Therapeutics Inc. here it is on start off the weekly chart. Very bullish. It's in the biotech industry. It's been doing really well. Um, you can see here, I mean, just since it broke through the cloud back here, this is back in 2024 on the weekly chart, June 7th of 2024, it's moved up 183.9%. Big move. And notice how the cloud has kept it in check this whole time on the weekly chart. Price remained above the cloud or inside the cloud. See how it kept on coming in. All right. And bouncing through it. And so now we are still in a nice uptrend. I like it on the weekly. And here's the daily chart. Very bullish as well. It's It's a great looking chart. I like Halo. That's going to get a blue flag, too. All right, so guys, that's going to do it for this video. Thanks for watching. Appreciate all of you. Um, if you liked the content, please don't forget to hit the subscribe button. If you're on your computer, there might be a subscribe button in the bottom right hand corner. You can click on that little button and that will automatically help you subscribe. Uh, and if you want to get access to those member onlyly videos and member content, just uh go to my YouTube channel, BlinkCloud Trading, and click on the join button. And if you want the links, click here where it says 10 more links. Everybody loves links. We love the links. And you can see the member link right there. TC2000 charting software, Finn Viz Elite link. Okay. My Twitter page link is right here, too. Some other links you can check out if you'd like. And um yeah, we got over 4,678,737 views right now and 33,800 subscribers. Thank you all. We're getting closer and closer to 34. And uh guys, have a good great rest of the evening. I'll catch you all in the next video. The ichimoku [music] guiding light. Blue cloud [singing] trading [music] through the night. >> [music]

Commentaires 0
Connectez-vous pour rejoindre la discussion.
Se connecterAucun commentaire pour l'instant. Soyez le premier à partager votre avis !