…in. Apple as a whole it's had a great run and you can see the quality here at this price though it means paying up for that quality after a very strong year over the last 10 years they have been phenomenal but valuation is a very big issue Apple for me it goes into the sale bracket I get interested again as the price moves closer to the valuation the next one trades below its own historical multiple and I still found the decision closer than I expected Microsoft trading around $522 This one did recover. It was below …
Apple for me it goes into the sale bracket
Contexte extrait par IA
Apple as a whole it's had a great run and you can see the quality here at this price though it means paying up for that quality after a very strong year over the last 10 years they have been phenomenal but valuation is a very big issue Apple for me it goes into the sale bracket I get interested again as the price moves closer to the valuation the next one trades below its own historical multiple and I still found the decision closer than I expected
…here I see the best combination of price and upside in my scenarios. Meta gets my strong buy and my number one spot with that cash flow recovery as the condition I keep revisiting. So here's the order that I use for fresh money. Meta first Amazon that comes in second in terms of a buy. For Amazon the discount it is narrower and the cash left after spending that's the number that I'd be tracking and Nvidia it is third. Also a buy just about I can make the case for it. the first earnings call under the interim co tomorrow.…
Amazon that comes in second in terms of a buy.
Contexte extrait par IA
So here's the order that I use for fresh money. Meta first Amazon that comes in second in terms of a buy. For Amazon the discount it is narrower and the cash left after spending that's the number that I'd be tracking and Nvidia it is third.
…es. At the moment, the business is earning a modest margin. And even with the stock down double digit on the year, the share price here is a long way above the upper end of my model. It's the reason this one goes below Apple in my ranking. Tesla, well, it's a strong sell on the board. Now, let's go to the one I put at the top. The cash flow chart for the next stock. It makes it a much more interesting decision. Met is trading towards 52- week lows at 630. Although still quite some way to get to the actual low at 520, al…
Tesla, well, it's a strong sell on the board.
Contexte extrait par IA
It's the reason this one goes below Apple in my ranking. Tesla, well, it's a strong sell on the board. Now, let's go to the one I put at the top.
… yellow line to come back towards the revenue line over time while the business is still growing. That would give me more confidence in my estimate of the seven. This is where I see the best combination of price and upside in my scenarios. Meta gets my strong buy and my number one spot with that cash flow recovery as the condition I keep revisiting. So here's the order that I use for fresh money. Meta first Amazon that comes in second in terms of a buy. For Amazon the discount it is narrower and the cash left after spending that's the number that I'd be tracking and Nvidia it is third…
Meta gets my strong buy and my number one spot with that cash flow recovery as the condition I keep revisiting.
Contexte extrait par IA
This is where I see the best combination of price and upside in my scenarios. Meta gets my strong buy and my number one spot with that cash flow recovery as the condition I keep revisiting. So here's the order that I use for fresh money.
Transcription Complète
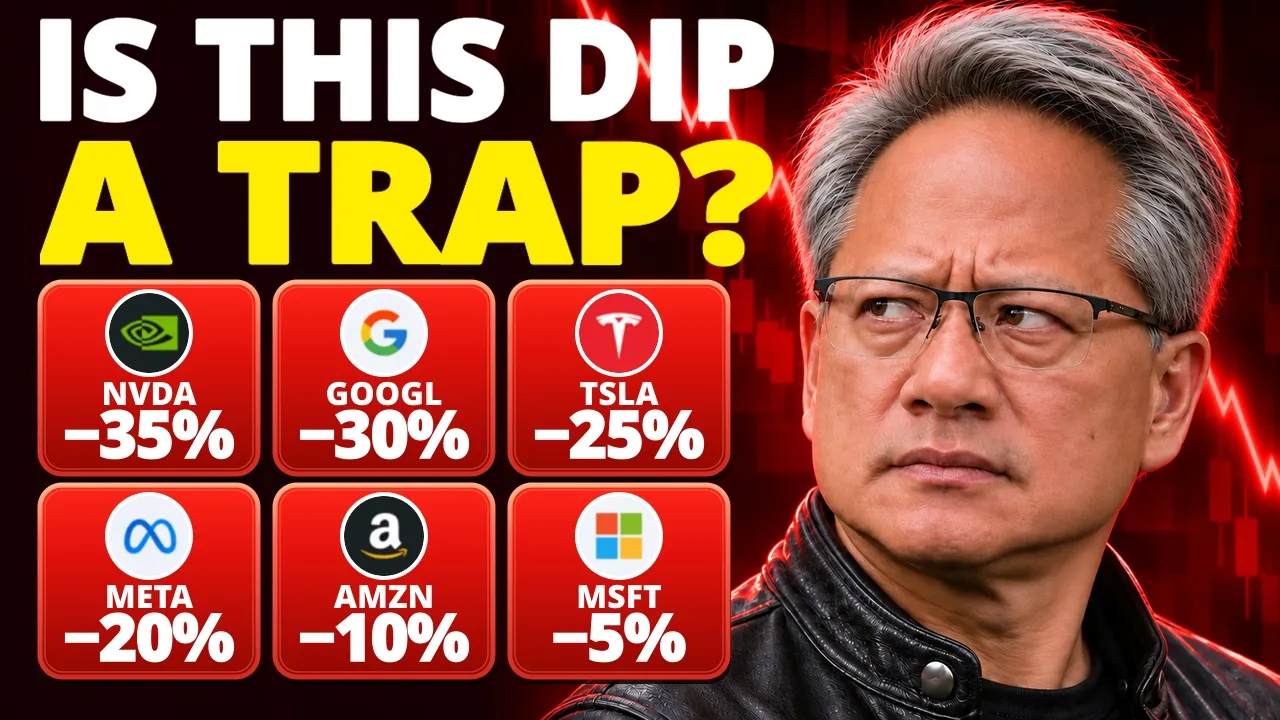
Look at the market today. We've got Nvidia down another 4%. AMD and Micron, they're down around 5 to 6%. And right in the middle of it, we've got Apple, that's barely green. And here's what just broke. The US Commerce Department, it issued a rule targeting the way that Chinese companies rent access to advanced AI chips through data centers in other countries. where Goldman Sachs, they're highlighting that the five biggest names, they're trading much closer to the rest of the market. So today, I'm ranking the Mag 7 from strong buy all the way down to a strong sell. And look, the risk is right here in the earnings season. The three Mag Seven names that missed earnings, well, they fell nearly 8% on average around their reports. Nvidia is the only one of the seven still to report. So, let's deal with Nvidia first. two investors, they've looked at the same sell-off and they've gone in completely opposite directions. First, we're going to listen to Jim Lebanthol. He's saying he's actually putting fresh money and he's buying the Nvidia dip. >> Yeah. Well, it's been a shocking week and it uh it got worse as the week went on. Um I think what we're going to see from Nvidia, the stock for the foreseeable future, is this tugof-war between the bulls and the bears. The bulls, like myself, are going to point to the strong order book, the growth that's projected. We'll get an update on that with next week's earnings. I'm not expecting a major change. We're going to talk about things like free cash flow over 300 billion, the forward multiple of 10, uh, and say, "Wait a second. How can we be selling this here?" And I'm not. I'm not selling it here. And new money that comes into account, I am putting into Nvidia. Jim's bet is that demand holds up. And you can see why from their latest sales. Wall Street is at about $109 billion for this quarter. That's up from 96 billion in just the previous quarter. Then we've got this headline. The Treasury Secretary is publicly urging Nvidia to hire an outside CEO. So, we have a lot of information surrounding Nvidia right now. Stephanie Link, she's on the other side of the coin from what we just heard from Jim. She believes there is earning strength, but listen to what she actually did with her own position. >> It is a stunning turn of events, especially because the fundamentals are incredible. They're going to blow it away on Tuesday. And the valuation is trading at nine times fiscal 28 numbers. They're going to generate so much cash, almost 50 billion in cash in the quarter alone and 300 billion next year. But throw all of that out the window because the overhang from this whole saga is just going to dominate the headlines for the next many months. And so I sold it. >> So Jim is adding and Stephanie sold in my own DCF model. Well, I get to $179. That means a 13% margin of safety. We're going to talk a little bit more about Nvidia, but as of right now, it goes into the buy section. Now, here's why it's very close. On a historical basis, although it will depend on which earnings estimate you use, the company's trading around 13 14 times forward earnings against a fiveyear average of almost 35 for which when we look at the blue tunnel from simply safe dividends highlighting the intrinsic fair value, there's a massive disconnect which only seems to be getting larger and larger. As we always say for Nvidia, at least in the last few weeks, this one is trading closer to zero than its own fair value. where CNBC they've reported that there's a petition for Jensen to return and it's reached around 180,000 signatures some big shelders they've also asked the board to consider bring him back that's a lot of support where the financial times they say he's discussed the comeback with allies that's where the reporting stands but for my valuation I need something I can put into the spreadsheet like how much cash the business produces and the next thing I can put a date on that's Tuesday after the US close. Nvidia is the report that I'm watching and the timing matters because the whole chip group, they're already trading at a massive discount. We've got this chart from Citadel. It's got semiconductors at 13.8 times Ford earnings against 18.3 for the S&P. That's roughly a quarter cheaper on the snapshot. So, you can see how far the ratios fallen. And look at what's happened to tech this year. Earnings growth, that's the big blue bar. The purple bar, it shows that investors are paying a much smaller multiple. Both of these, they can happen at the same time, and that is exactly what we're witnessing today. But here's the comparison that I found most interesting. Tech is 32% below its own 5-year average multiple. Staples, well, when we take a look, they're 16% above theirs. I'd start digging where prices have reset the most. And then on Goldman's global chart, hardware, that's around 14 times. Hypers scale is near 20 and Staples at 21. So even within tech the discount it depends on which companies you put into the comparison. And you can see that split again in today's market. Chip stocks they're deep in the red. While we've got Microsoft and Apple, they are up but very slightly. So a single call on big tech. It would hide a lot of what you're seeing here. And the hyperscalers multiple relative to the market that's also down well below its historical median. We've got Sylvia Jablonsky on CNBC. She calls this a repricing of the AI trade. Here's the case that she made on CNBC this morning. But longer term for investors with 5 to 10 year time horizons, all of this stuff is on sale. You know, Nvidia now is 17 versus the S&P 181 19 forward multiples. I think all of the hyperscaler stocks have fallen. You know, none of this is going away. So, the AI infrastructure trade isn't broken. It's just essentially getting repriced. The question I have for that argument is what comes back from all this spending. We've got this five company chart with annual capex going from 379 billion last year to an estimated $732 this year. And you can see the squeeze here. Of these five companies, Microsoft was the only one with positive free cash flow. This is from the latest quarter. That for me, it changes how I read the lower multiples. So, as I said earlier, I'm going to rank the seven. We're going to start with the biggest draw down on this board among the seven, and that's Nvidia down 35% from its highs. Now, before I open the spreadsheet, there's a reason I still want to own the business at the right price. We've got the data here for the end of last year. Is highlighting here Nvidia's got 76% of global server GPU revenue. And look where quarterly revenue was 2 years ago, 35 billion, give or take. The yellow bar, that's the latest consensus at 108.7 billion. That's real growth here. Even if the stock's having a horrible month, horrible two horrible three months. Now, compare these two last quarters. Net profit, it went from 58 to almost 60 billion. Operating cash flow that went from 50 billion to 24. That's the figure I want to hear more about tomorrow. Now, friend Nvidia, if you've been watching our previous episodes in just the last week, given Jensen has now left and at the moment there are no signs that he's about to return, what we've done is we've taken a 30% haircut from analyst projections. This was prejensen being fired from 2027 to 2030. So, this is 70% of analyst expectations. Maybe conservative, maybe optimistic. This is what we've modeled and will very, very likely change after the earnings. We've then used 15% growth moving forwards. Bear in mind it is starting from a very large base which takes 2036 to 405 billion of free cash flow. It gives us a value of $179 indicating 15% upside. Also a margin of safety coming in around 13%. Now, it's obviously a lot less dramatic than what we've seen from Wall Street, who just continue day after day to cut their price targets now at $269, but still very respectable, 72% upside. But here's also the detail behind my caution. Receivables, they went from around 41 to $63 billion in just one quarter. It means more cash is tied up in money that's owed to Nvidia. The pace of collections, that's very important. And in my low scenario, I get to $145. The higher case around $220. It gives you some room in both directions. Ultimately, depending on what you think cash flow can do after the build out. And this is what I want to hear from Colette Crest on Tuesday if the rule makes it harder to rent out that computing power. Could it change how many chips those overseas data centers order? At $156, Nvidia for me is a buy just about. margin of safety coming around 13% below the 15% that I like to usually look for. Now, let's go to the stock that was green this morning. Now, Apple's been one of the strongest of the seven this year. We can see it's up 31% year to date and is very close to all-time highs at $361. Let's see what investors are paying for that. The black line is Apple. The green one is Nvidia. And look at the crossover at the right. Apple is sits at 5.2 2 trillion and Microsoft Nvidia, they're both around 3.9. And there's a decent reason people like what they see. Revenue, that was 115 billion in their latest quarter, up 12% year-over-year. The iPhone, it was a big part of that. Sales were up 17%. But now look at the margin line. The September quarter set a revenue record and Apple's guiding to a gross margin of 45 to 46%. That's the bit that I put beside the revenue number. and services. Well, they're a big counterweight. They did almost 32 billion in sales and the gross margin for this stream is 76%. The mix very important because Apple keeps a lot more of each services dollar. And there's another reason why the market might pay a premium for Apple. Look at the gray bar on this chart. It's capex is down on the comparison while the four cloud and advertising names, they just continue to ramp up. But how much of a premium am I being asked to pay? We can see they're sitting 37 38 times forward earnings against a 5-year average of 29. The yield also lower than its history too.3 versus.5 with the blue tunnel that's signaling to us an overvaluation signal sitting above in fact the upper end. Again, very important to note for Apple. It is one investors for such a long time have been more than happy to pay a premium. Now I'm using a 10% growth rate moving forwards for the company slightly below the 10-year KGA at 11%. Now the middle rate it does come to $272. As always discount rate is 9% for each stock to keep it consistent. It gives us downside of 24%. Also means there's no margin of safety. In fact today a premium of 31%. Now Wall Street while they're still bullish on the company they see no upside over the next year. downside of three price targets $346 and in fact very interesting to see even using the higher rate of 12% where it comes to $317 below today's market price and still downside so no upside whether use 8 10 or 12%. Now what would make me revisit the company? Well, I'd want to see higher revenue turn into stronger margins again. Look at the last two points on the chart. The near-term guidance still points to a lower margin. Apple as a whole it's had a great run and you can see the quality here at this price though it means paying up for that quality after a very strong year over the last 10 years they have been phenomenal but valuation is a very big issue Apple for me it goes into the sale bracket I get interested again as the price moves closer to the valuation the next one trades below its own historical multiple and I still found the decision closer than I expected Microsoft trading around $522 This one did recover. It was below $400. Doesn't even feel like that long ago. We got 52- week high $559. Strong buy rating from Wall Street where the company still sitting below its 5-year average on forward earnings of 30. Today it's sitting at 25.3. So yes, cheaper than its own history, but I want to see what's changed on the cash side. Now Azour is the obvious place to start. That's the large blue stream at the top. It did about 33 billion of quarterly revenue. Add Microsoft 365 cloud and those two streams alone they're over 60 billion. And look at the three lines here. Everybody's accelerating from a different starting point. Azour's latest figure here. It's around 48%. Google Cloud is growing faster and AWS that's up around 39%. Now look at the actual scale using annualized quarterly sales. AWS is around 184 billion. Azour is at 133 ahead of Google Cloud at 123. But Microsoft their appeal it goes beyond Azour. Look at Microsoft 365 and the rest of these products. In total the company generated almost 46 billion operating profit on 92 billion of revenue. That's a 50% operating margin. Now bring it back to what's left over. Microsoft that's the bar on the left as positive 18.6 billion. The chart shows it's still generating cash after capex this quarter while the other four Meta Oracle, Alpha, and Amazon. They're all negative. But look at Microsoft segment in the spending bars. It's part of a much bigger investment cycle and the bars on the right. Yes, their estimates a lower earnings multiple. It can coexist with a huge bill for new capacity. Now, here's what analysts are expecting. Free cash flow last year was 67 billion. They're expecting it to dip to 50 billion 2027 and then accelerate to 180 billion by 2030. That's where the model requires the payoff to start showing up. At 9% discount rate using the mid rate of 15, we get a value of $566. That's around 7% upside and a margin of safety sitting at the same level of 7. Now, the range is also useful here. At the low case, we get $452. High case 705. But look how far apart these numbers are. Even with the same discount rate, it's why I can look at the multiple and say it has reset and still want more room on my entry. What matters at this price is how much cash Microsoft keeps once it pays for the expansion. Azour and Microsoft 365 make it one of the easier businesses here for me to understand. The harder bit is working out what the next wave of infrastructure does to the amount of cash that shelders actually get. Microsoft for me, well, it goes into the hold bucket. It's a solid business and I want a bigger discount to what we're seeing today. Now, let's go to the name growing much faster on the cloud chart. Alphabet, well, it's trading below $290. You can see, I mean, look at the 52- week all-time high $49, is fallen sharply from that figure. Wall Street, while they still maintain a strong buy, where it's now down year to date around 6%. Now, I would be very careful about using the word cheap for Alphabet. On the historical screen, we can see it's trading 21 times forward earnings. His own 5year average is not that far off. So, this is quite a normal multiple for the company. What's different is the mix underneath it. Search advertising that was 63 billion in the quarter up 12%. Google Cloud over 30 billion and that roughly doubled. It's hard to look at that chart and just see one business. Now the mix chart, it also shows that search is down to about half of Alphabet's total revenue. That's a share of the total. Remember the search dollar figure was up. The rest of Alphabet has been growing faster, especially recently. And here's the longer view. The cloud business is at around 93 billion in revenue over the last 12 months. 2 years ago, it was sitting at 43. It gives it real weight inside the broader company today. And on the growth chart, you can see just how steep the last few points have been for Google Cloud, over 100% at the latest point. That's the pace I'd stress test just before assuming it can continue to carry on. And I like to check this chart straight after on annualized quarterly sales. Google Cloud is closing in on Azour and AWS is still the largest. It shows why both the growth rate and the dollar base matter. Now, don't get me wrong, search is still plays a big part of the bill. It brings in more than twice what cloud does in the quarter. If you're buying Alphabet for Cloud, search is still one of the numbers you need to follow. Now, look at where Alphabet lands on the latest quarterly cash flow chart. It's negative 9.1 billion. It's why you can get excited about those cloud numbers and still have reservations about the price. Now, analysts are expecting free cash flow from 2025, 73 billion to drop to 2 billion in 2026, negative in 2027, and then to pick up to around 200 billion by 2030. And the CABEX chart helps explain a little bit of that. Look at the purple section for Alphabet as the total bars rise. The numbers on the far right whilst being forecast, we can see that a longer spending cycle, it would push the cash recovery further and further away. Now, after all of this, using the 15% growth rate, we get to a price of $326. That indicates 11% upside with a margin of safety sitting pretty much bang on 10%. If we look at the lower case, well, that's at 10%, $272. Higher case at 20% growth, $392. So, Alphabet, it goes into the whole category ahead of Microsoft on the valuation. I like what cloud is doing at this price. I'd want more room for that spending forecast to be wrong. Now, let's go ahead and compare it with Amazon. Now, Amazon's trading around $260. The stock is up around 134% year-to date, which is already a different setup from Alphabet. In terms of where it sits at the upper end of the 52- week range, where we get a double buy from both Wall Street and Quan, let's look at what's driving the profits. Well, AWS, it did 46 billion of revenue in the quarter. That's less than a quarter of Amazon's total sales. Then look at the little box for the operating profit, AWS. You can see here it contributed $17.8 of the 28 billion. That works out to be $35 million of operating profit a day in the latest quarterly pace. Look at the change since 2022. This is a different Amazon on operating profitability. On the annualized cloud chart here, AWS, it's still the biggest. Google's closing the gap and ASU is growing quickly too. For my Amazon valuation, the 184 billion run rate, it helps put the growth in context. You can also see AWS accelerating from around 17% a year ago to 39% in the latest quarter. On a revenue base that large, even a smaller percentage than Google, it adds a lot of new business. Now, we can see it's trading around 28 times forward adjusted earnings. The gap number, well, we can see that's sitting low around 21. I'd pick one measure and stick with it when comparing Amazon against another stock. And here's the problem with just stopping at earnings. Look at Amazon is on the far right. Negative 35 billion of free cash flow for the quarter. The spending is already hitting the cash in quite a significant way. And the Amazon part of these bars, well, it gets much bigger. So, the question for me is how long it takes to earn back that investment. cash flow gets better in my model as the spending starts to pay off. There's also the anthropic stake. We can see here it's got an estimate around 272 billion. That's for Amazon including convertible notes. That's an illustrative stake valued at $78 a share. Now back to cash flow. They reported 11 billion in 2025 and that's projecting it to drop 5 billion in 2026 to recover all the way to 175 billion by 2030. Getting from the first number here to the last, that is exactly the bet for Amazon. I can see why it'd underwrite some recovery. AWS has a lot of operating profit already and the rest of Amazon. It made over 10 billion operating profit this quarter. There are multiple businesses contributing here. My base case comes to $312. That's around a 15% margin of safety. In terms of implied upside, that's coming to around 18%. I mean if the growth after recovery is weaker at the low end I get $256 the reverse DCF at 11% bear in mind again very important note that is still assuming that the recovery up until 2030 actually executes the first sign that I'd look for Amazon is a smaller cash outflow after capex that would tell me more about the part of my valuation than just one more headline about record demand for cloud capacity so Amazon for me today it goes into the high. It's a narrow pass on the buy price and I put it ahead of Nvidia today. Up next is a stock where even my high case it just comes up short and that's Tesla trading around $380. Now it's down 13% year to date. And you can see also towards the mid to low end of the 52- week range. 52- week high $500. Just one buy rating weak from Wall Street 3.7. The question is what is the market still paying for the company? Let's start with what the company actually sold. Roughly 21 of 28 billion in quarterly revenue came from automotive services they grew 33%. The total was roughly flat and operating margin it was only around 3%. Now there's a real reason bulls are looking past the income statement. We've got the chart for Tesla at 438,000 driverless miles in Austin. This is just for one week and it's a big step up. Then I come back to the business today. Nearly all the revenue here, it comes from products and services that Tesla already sells. The big question is how autonomy eventually changes the profit that it actually gets to keep. And at this price, the adjusted forward multiple, well, it's over 200 times. Even Tesla's own five average is a lot lower at 122. That's already a very high comparison. Now, one thing to watch with the chart here is that Tesla's October week is being compared with Whimo's second quarter weekly average. The growth in Tesla's line, it is interesting, but I'd want to see a like forl like period as it scales. Now, the market is attached a value of $1.5 trillion to Tesla. At that size, the businesses have to generate a lot of actual cash to eventually move the needle. Now, I've given it 30% annual free cash flow growth in the base case. It takes the cash flow from just over 8 billion in 2026 to almost 86 billion by 2035. It works out to be $212. The gap between the intrinsic price and the market value. Well, we're talking about 45%. Now, you could look at the earnings multiple and say the current profits understate what the business can become. That's a fair argument. The price already gives you a pretty good idea of how much success people actually expect. So, I ran 35% annual growth for the high case, and I get just shy of $300. That's still 23% below today's price. The near-term numbers I keep checking are operating profit and margin. As new services scale up, I want to see that progress make it through to these lines. At the moment, the business is earning a modest margin. And even with the stock down double digit on the year, the share price here is a long way above the upper end of my model. It's the reason this one goes below Apple in my ranking. Tesla, well, it's a strong sell on the board. Now, let's go to the one I put at the top. The cash flow chart for the next stock. It makes it a much more interesting decision. Met is trading towards 52- week lows at 630. Although still quite some way to get to the actual low at 520, all-time high sitting at 780 where we get just one strong buy is also down here today for 5%. But for the company, I think the upside that's worth a closer look. Now, if we start with the big blue stream, the advertising business, it brought in 63 billion in one quarter and grew 26%. The operating profit figure though, it also includes about 10 billion of legal charges. Now look at the yellow line. Cash purchase of property and equipment. They were up about 80% year-over-year in the latest quarter. Revenue only up 26. Spending growth has been running ahead for 10 quarters on the chart. And that leads us right to this chart. Operating cash flow was nearly 33 billion. Cash capital spending was slightly above that. When you also count finance lease payments reported free cash flow that was negative just over 2 billion. And then when I look at the historical multiple 19.7 against 21.6 is a discount to the usual level on its own. The difference it wouldn't have put met at the top for me which when we look at the blue tunnel it's sitting right there on the low end indicating potential undervaluation. But important to note med is not one that's shy. In fact, in being in this severely undervalued level, we've seen it for most of the last 10 years. But for me, I keep coming back to the ad business. Look at how much of the total 64 1.5 billion sales comes through that one stream. For the model to work, that engine, it has to keep on growing. And here's the part of the model that I want you to see. I've got zero free cash flow in 2026 and 20 billion the following year. Now, this is pretty much what analysts are expecting. So, we can see I'm giving the spending time to feed through. Now, the latest two bars, they're a good way to keep that assumption honest. Both are near record levels on the chart, and the company still came out negative after capital spending. I want to see that gap start to reverse. Now, the forecast, it goes from 40 billion in 2029 to 110 billion by 2030. That recovery is the reason this model gives me room to buy, and it's the part that I'm watching most closely on my path. the value gets to $814. That indicates 28% upside with a margin of safety of 22%. Wall Street, they do sit a little bit higher, $851, indicating 34% upside. Now, if we look at the low case, we get $668. There is still upside. We're talking just 5% and at the more bullish case of 20% while the value sits near the $1,000 mark. All of these cases again they follow the exact same recovery pattern with free cash flow at 110 billion at 2030. The change that I like to see from the company is pretty straightforward. I like the yellow line to come back towards the revenue line over time while the business is still growing. That would give me more confidence in my estimate of the seven. This is where I see the best combination of price and upside in my scenarios. Meta gets my strong buy and my number one spot with that cash flow recovery as the condition I keep revisiting. So here's the order that I use for fresh money. Meta first Amazon that comes in second in terms of a buy. For Amazon the discount it is narrower and the cash left after spending that's the number that I'd be tracking and Nvidia it is third. Also a buy just about I can make the case for it. the first earnings call under the interim co tomorrow. That could change how much I'm willing to pay. Alphabet is fourth and Microsoft fifth. Both in hold. Their cloud business are growing and I've already got a decent cash flow recovery in both models. I need a better price or a better cash outlook to move them up. And Apple number six in cell. The price would need to come a fair bit closer before I look at a new position. And Tesla, that's last and my strong sell. Even the faster growth case I ran coming below the share price. If you think Autonomy can cover that gap, I'd love to know what cash flow number you're using. So, let me know which of the seven would you buy at today's price. Put the stock in your buy price in the comments. And if you enjoy today's episode, smash the like button, smash the like button. Don't forget to subscribe and hit the notification so you're aware of future episodes. And we've also, as we do every week, just released our latest copy of our undervalued stocks and a brief market update. You can click on the pin comment, read all of these straight away. More importantly though, have a great day. I'll see you all on the next one.

Commentaires 0
Connectez-vous pour rejoindre la discussion.
Se connecterAucun commentaire pour l'instant. Soyez le premier à partager votre avis !