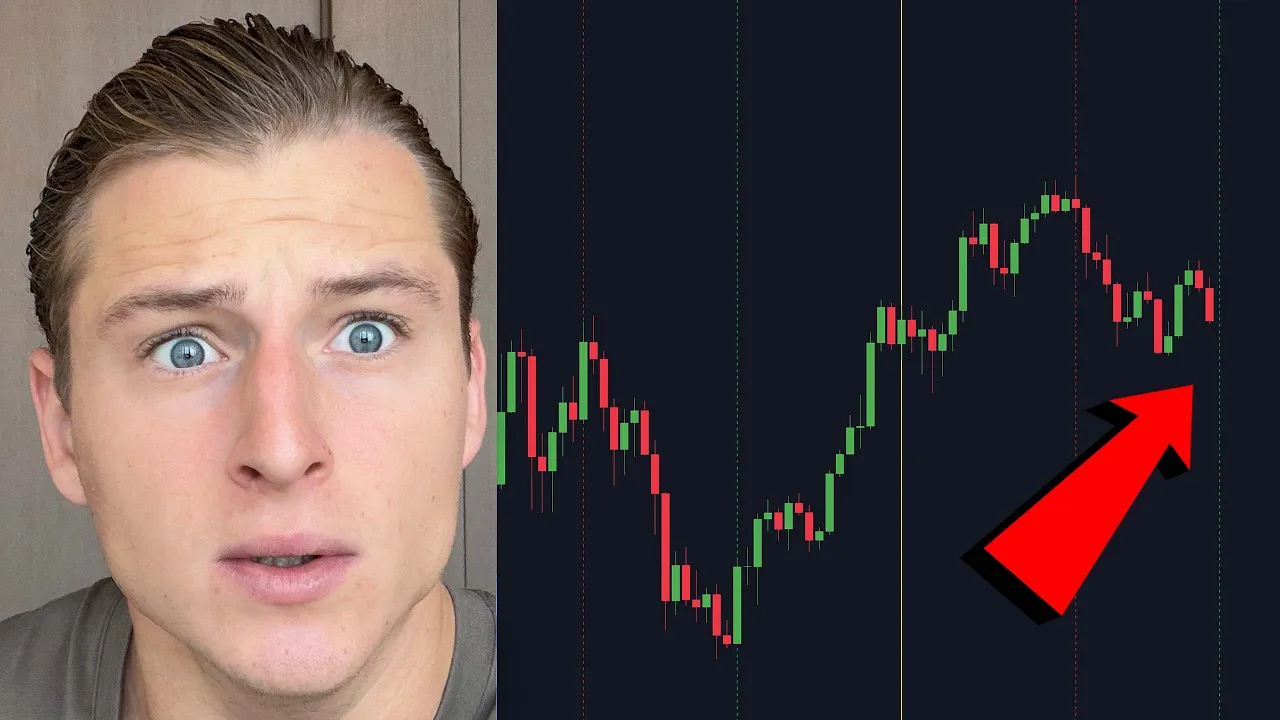

- Rendement de la vidéo
- -6,30%
- Appels
- 1
- Achat / Vente
- 1 0
- Publié
Recommandations
L'entrée est le cours de clôture de l'actif à la date de publication. Le cours actuel est la dernière clôture enregistrée.
-
Entrée $64 290,00 14 nov 2026Actuel $60 237,00 22 nov 2026Résultat −$4 053,00vs. indice — BTC est l'indice de référence — il n'y a pas d'excédent à mesurer
Citer cette recommandation Voir le segment source (420s) *
Contexte de la transcription source
… looking quite bad here but basically what I always view it as is that the 200 200 weekly moving average is the 4-year average price for Bitcoin, right? So, always if you buy around the 4-year average price, you are doing a great job here. So, for me, this is again a great time to dollar cost average. I mean, still, I didn't thought this was a bad time here because in the bigger things of it all here, it is in my opinion not a bad time to dollar cost average. And really, what I'm going to be looking at is that Bitcoin maybe created this…
So, for me, this is again a great time to dollar cost average.
Contexte extrait par IA So, for me, this is again a great time to dollar cost average. I mean, still, I didn't thought this was a bad time here because in the bigger things of it all here, it is in my opinion not a bad time to dollar cost average.
Transcription Complète
According to this indicator that so far has predicted every single Bitcoin bare market bottom almost perfectly, we are now two weeks out before we're entering this exact window. And on today's update video, I will be speaking about how I'm approaching this big signal as Bitcoin is obviously right now seeing a major dump towards the downside. It is crashing towards the downside and potentially is looking to make a new lower low in the market right now. On today's update video, obviously I'm going to be speaking about the biggest levels of support. I'm going to be looking at next for Bitcoin. Are we going to hold up exactly towards this 200 weekly moving average or are we going to be just straight away break through it and break towards new lows here? That is exactly what I will be discussing and so much more on today's update video including my big Bitcoin trade I am currently still sitting in and I will be basically discuss all the orders I have set up for this exact trade what I'm planning to do next. So don't forget to straight away stumble that like but I'm back above 800 likes. It will be highly appreciated and let me jump straight away in today's update video. And first of all, this weekly candle in terms of the liquidations we've been seeing across the week are now even bigger than the liquidations we saw during the 1010 correction in crypto. And that was of course a week where we saw a major liquidation event. And now this week is actually even bigger than the 1010 correction in the market, which is obviously quite insane if you would ask me here. So again, we're seeing a lot of liquidations coming back into the towards the market. Especially if I'm zooming in towards the lower time frame in this most recent correction towards the downside. More and more liquidations have been coming in. And if I'm going to be looking at Bitcoin right now, yeah, we are rapidly approaching the big level of support, which is exactly this order block over here for Bitcoin. But I have said this numerous times already for Bitcoin as well. I personally believe the moment Bitcoin is going to come back towards this order block, the people that are probably going to be filled up over here are probably going to get fooled out here. And I have said this repeatedly because if more people can get a such a great entry on Bitcoin, then maybe it is going to be necessary to of course squeeze them all out towards the downside. So, so basically what I am doing in terms of my risk management with my major Bitcoin trade I have open with copy trading. If Bitcoin does dump towards the downside and comes towards the $62,000 US level, I will be taking my profits on my Bitcoin long trade because if we come towards that level over there, I personally think there's going to be a big chance that we're then going to create a new low and then I'm just going to set up a new order on 58K, a new order on $54,000 and new orders on 51 50 etc etc. But of course, I will be sharing all these orders whenever this is exactly going to be happening. So if Bitcoin does come down towards that level, hitting my stop loss is going to be my target. And of course looking to then get a new entry for the upcoming Bitcoin bull run. And I have said this numerous times as well already before, but the best prediction indicator to predict Bitcoin bare market bottoms has always been to buy Bitcoin 500 days prior of the haling and just sell it 500 days after. I mean last cycle 500 days after the halting wasn't exactly the top but it did mark one of the best levels to get out of Bitcoin before the bare market started. Then 500 days prior of the haling marked the exact Bitcoin bare market bottom. Then again the cycle before that 500 days after the halting it was almost exactly the top and the 500 days before it it again marked the exact Bitcoin bare market bottom region etc. And this has been the case for every single time this signal is flashed and according to timing. So this is nothing to do what Bitcoin is going to be doing if it's going to hold on towards the 200 weekly moving average. This is purely timings and basically thinking about the economics of Bitcoin because in 500 days after this signal flashes Bitcoin its production basically get uh cut in half and that means there's even more scarcity and that is of course ultimately the reason why Bitcoin continues to grow towards the upside because the inflation gets less right. So, this signal is about to flash in two weeks from now on. And it is literally been the most reliable signal ever before in crypto. And actually, as of for now, as we're seeing Bitcoin dropping towards the downside, we're coming back into extreme fear territorium again. Uh we're hitting 13 on the index right now, which is of course quite a low level, but if you're going to compare it is just back towards the levels of the bare market low back in June and July 2026 here. So we're just back towards that 58k region which is yeah of course quite unfortunate but yeah it is what it is exactly right now here then the liquidation heat map clearly shows me there's of course some liquidity laying above us but there's almost no liquidity anymore laying below us and this is actually quite insane because Bitcoin is order book is right now completely imbalance and you can see this also from the open interest chart if I'm looking for example at the 4hourly time frame I mean before look at this the open interest has been continuing to be rising and rising while Bitcoin continues to dumping. The reason why this is happening is because everyone who opened short positions, they didn't got stopped out and all everyone who opened long positions, they got wrecked. They got of course squeezed out of the market. So, this is exactly what is happening. The order book is currently in balance. And if we're looking towards the downside, there's approximately only 7 to $800 million in Bitcoin long liquidations laying all the way down to 59K. Well, if we're going to be looking above us, it is almost $15 billion in Bitcoin short liquidations laying all the way up to $83,000 US, which is only like 15k higher than we're currently trading at. So, that is obviously quite insane here. If I'm going to talk about where the big walls are laying for Bitcoin support, I mean, this is clearly what I'm looking at right here. It's going to be this $63,000 level. There are multiple big orders on spot and perpetual setup on Bitcoin. Then you've got $65,000 and that 61k level is also a major level here. And then of course it's going to be the bare market low where approximately $50 million in buy orders are also set up here. But until at least that 64k region, there's not a lot of support laying for Bitcoin. But also in terms of resistance, there's almost no resistance laying above us as well here. So there is quite thin liquidity right now in the market in terms of how many people want to get in and how many people want to get out. I mean the 2023 and 2026 scenario they did looked quite uh similar but it looks to be that the 2026 one looks to be coming down much more aggressively and continues to be coming down here and for me what is going to be very important in about what is it 48 hours or 36 hours from now on we're going to be closing the uh Bitcoin weekly candle if we're going to be breaking below the 200 weekly moving average in my opinion it's going to be looking quite bad here but basically what I always view it as is that the 200 200 weekly moving average is the 4-year average price for Bitcoin, right? So, always if you buy around the 4-year average price, you are doing a great job here. So, for me, this is again a great time to dollar cost average. I mean, still, I didn't thought this was a bad time here because in the bigger things of it all here, it is in my opinion not a bad time to dollar cost average. And really, what I'm going to be looking at is that Bitcoin maybe created this lower side of the range and the top side of the range fake out. This is going to be the level where Bitcoin needs to be finding support. If it doesn't, I think we're going to be most likely create a new lower low in the market. And yeah, those are just the realistic levels to be looking at for Bitcoin right now here. And I mean, also, if I'm looking at Bitcoin, I mean, yeah, if I'm comparing it back to 2022 to 2023, I do see a lot of similarities with this consolidation phase and the one over there. But we just have to wait and see how it is going to be unfolding because yeah, we could be creating somewhat of an inverse head and shoulders, right? So left bottom, then a deeper bottom, and then a higher low, and then we go up here. This is a typical reversal/bottom pattern to be creating, especially on these high time frames. If this happens, it's going to be looking super great. The pattern is going to be looking good here. The structure is going to be looking good. And if Bitcoin does this, wow, then we're just going to be looking super bullish in my opinion. But if we then of course come to down to here and we do this, then it's going to be looking a little bit more tough obviously. But if we are going to be doing this scenario that I just written down here, it is exactly the same what we did over here. So low lower low higher low and then boom you go. And of course the point we break above this middle line that is of course the confirmation in the market. But yeah, this could be still a bullish scenario that can be playing out here. But obviously it seems to be that now Bitcoin cannot find anywhere support because it's continuing to be falling towards the downside and everyone is panicking. And really, if you're also looking to potentially open up trades or maybe benefit from the volatility that we're currently seeing in the market or even want to copy trade me on my next trade, I'm going to be opening because if I get stopped out here, I will be doing another copy trade. Don't forget to right now straight away go to the first link in today's video description to sign up account to WEX because now for the coming six days only you can you you are currently able to claim a VIP 6 status which means that you're getting a 44% fee rebate on the WEX exchange here which is by far the best campaign of any other cryptocurrency exchange out there. It's only available for 300 the first 300 users. So make sure to be quick, make sure to grab it. But for sure this 44% fee rebate you're not going to find anywhere. So if you are interested in trading in the upcoming bullin and of course trade with some cheaper fees check it right now out in the first link below. It's a very exclusive campaign. No one can get it and I got it for you guys out there. So make sure to check it out in the first link below. It would be highly appreciated. Then of course yeah this is the structure I'm looking at. Hopefully it can play out. of of course this is going to be taking quite a lot of time but also I see a lot of people saying that they want to be opening up a trade or that they want to rush into a trade but really if you look at Bitcoin usually around bottoms like you can see over here you always have enough time to enter you always have enough time to enter in positions because um yeah Bitcoin always needs to create a consolidation I mean you can see of course back in 2023 it didn't give you any time in this correction but historically usually you have enough time to accumulate and get a good entry in here. So yeah, now what I'm really doing is waiting to see how the structure is going to be unfolding on Bitcoin so I can make my next decisions of course on the market. Then of course as well on Ethereum, it is right now already back in this order block. It is creating a very similar structure like Bitcoin, but where I'm more or less looking and paying my most attention towards if I'm looking at Ethereum right now is the Eve BTC chart. Are we going to create a higher low right here or are we going to create a lower low? And if we come low lower, this is going to be a level where I would be interested in accumulating again Eve BTC because this is that major zone, that major order block where we got rejected and I would be expecting this is going to be a big level of support for Eve next time around if we do touch it touch it. So this is it for me in today's update video. If you did enjoy it, don't forget to subscribe to the channel. Would be highly appreciated. Enjoy your weekend. Hopefully, Bitcoin is going to be having some excitement, price action over the course of the weekend. And I will be back, of course, tomorrow again with another update video. So, peace out.
Commentaires 0
Connectez-vous pour rejoindre la discussion.
Se connecterAucun commentaire pour l'instant. Soyez le premier à partager votre avis !