…netize the infrastructure. If we look at the lower case here, 10% will value comes to $272 near today's price. It's just a reminder that the base case still leaves less room for error of the meta even after Alphabet's bigger draw down. So, Alphabet for me is the second core buy around $280. I'd probably start buying gradually around $260 to $270. I'd look to add if search and cloud, they're still earning their investment. Now, for a quick recap in fifth, that would be Microsoft. The model we can see gives around 5% margin of safety. Even with a steep cash flow recovery, I like the …
Alphabet for me is the second core buy around $280. I'd probably start buying gradually around $260 to $270.
Contexto extraído por IA
If we look at the lower case here, 10% will value comes to $272 near today's price. It's just a reminder that the base case still leaves less room for error of the meta even after Alphabet's bigger draw down. So, Alphabet for me is the second core buy around $280. I'd probably start buying gradually around $260 to $270. I'd look to add if search and cloud, they're still earning their investment. Now, for a quick recap in fifth, that would be Microsoft.
…pared to give Meta more time today. Now the low growth case that sits at $668 again keeping the early recovery. So the position size it has to account for the possibility that cash comes through more slowly than all three cases assume. Now Meta for me it's a core buy in stages around $600 under $580. I'd look to add if the ad trend holds a bigger decline will it gets me back into the numbers. Where Wall Street with their strong buy, they see around 40% upside in the shorter term. Although analysts still very bullish, still keeping a $1,000 target. Now Amazon closed yesterday $260. The shares actually when we take a look they're…
Meta for me it's a core buy in stages around $600 under $580. I'd look to add if the ad trend holds a bigger decline will it gets me back into the numbers.
Contexto extraído por IA
Now the low growth case that sits at $668 again keeping the early recovery. So the position size it has to account for the possibility that cash comes through more slowly than all three cases assume. Now Meta for me it's a core buy in stages around $600 under $580. I'd look to add if the ad trend holds a bigger decline will it gets me back into the numbers. Where Wall Street with their strong buy, they see around 40% upside in the shorter term.
Transcrição Completa
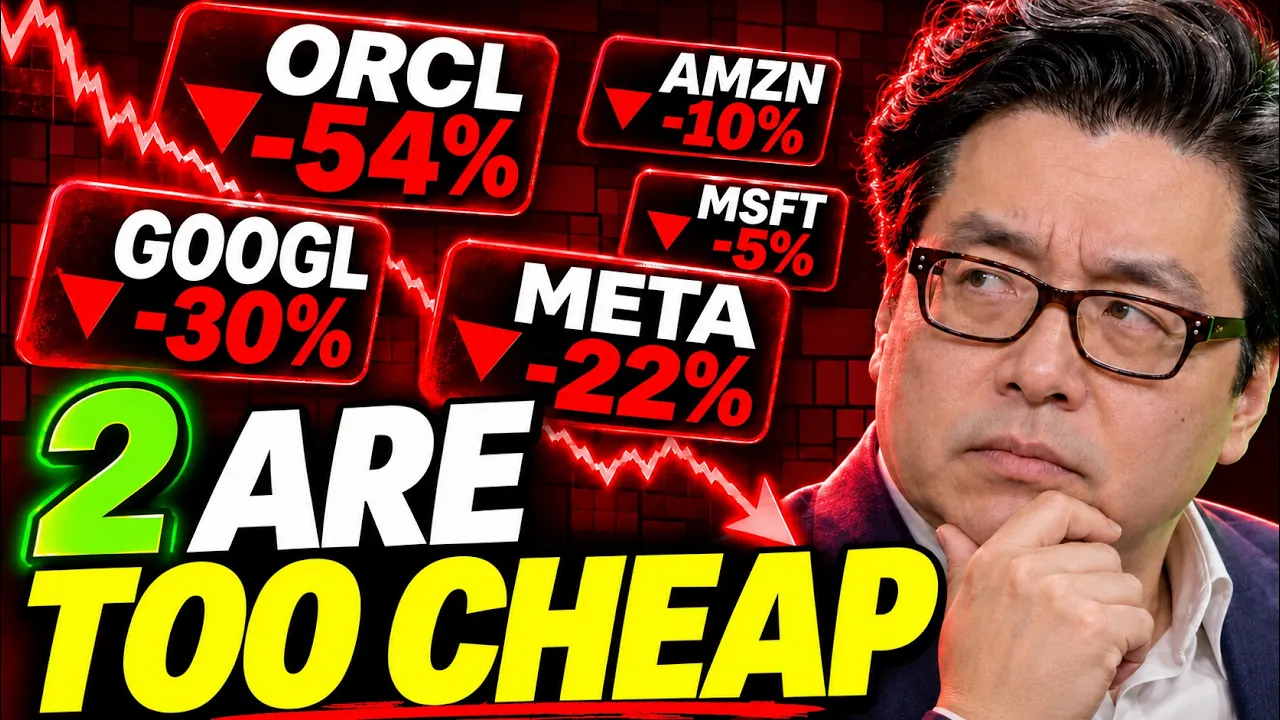
Yesterday, nearly $2 trillion was wiped off the NASDAQ in its worst session in 18 months. Today, I'm ranking five of the companies funding the AI buildout because the sell-off left them in very different places. We've got the semiconductor index that fell more than 12%. The VIX jumped from 16.6 to 28.2. When a move is that violent, the first thing I want to know is where the selling actually landed. Look at the oneweek heat map. Nvidia and Micron are red. While Microsoft, Alphabet, and Amazon are green. It was a brutal week for the chip trade. Several of the biggest customers, they actually gained ground. And then let's switch to draw down from the highs. Alphabet, well, that's down around 30%. Meta down 22%. Amazon 10, Microsoft 5, same market, same AI theme, four very different starting points for a buyer. And then if we look at the market this morning, it makes it even more interesting. chips, they're bouncing sharply here. Microsoft Red, Alphabet, and Meta, well, they're pretty much flat. What I want to do is separate that short-term bounce from the opportunity at today's price. I mean, if we take a look at Nvidia, it's trading 15 times forward earnings against a 5-year average near 35. That is a big reset. The stock though, it only stays that cheap on this measure if the earnings estimates do hold up. We've then got Micron that's trading under four times forward earnings. The number looks absurdly cheap until you ask what happens when memory earnings normalize. If profits half and the share price stays put, the multiple doubles. And this was the third largest 1-day percent gain for the VIX on the chart. It's a good reminder of how fast fear arrived. It also explains why today's price moves, they can look dramatic in both directions. I mean, if we take a look across 57 earlier 5% QQQ drops, the average 5-day rebound was positive. By 10 trading days, fewer than half were higher. Now, I use the history to set expectations for volatility. Then go back to the companies and we can see from this chart, data center construction spending that's climbing as office construction eases. These are physical projects, power, buildings, and equipment. They all have to come together before a cloud company can sell the capacity. When we look at how much AI related debt has been raised on just these two estimates, banks use different definitions, but both show a large jump for the investors funding the buildout access to capital that matters alongside demand. And it's how I separate four of the biggest spenders. Now, we can see this chart. It compares prices with operating cash flow. For this episode, I also want to know how much of this operating cash is actually left after investment. And when we look at the one month of the QQQ, well, it shows the other side of the story. Microsoft and Amazon, they've held up while much of the chip groups fallen. And Jessica Les makes a point about who could benefit if new compute gets harder to build. So people of the valley are calling their closest Democratic VC friends, right, and trying to make up for several years of having gone the other way. But, you know, I think the voters handed at least the big tech companies a gift by basically saying in the short term, it's going to be harder to get new compute. If you have it, it's way more valuable and your margins are going to be better. >> So, you think this for for the tech industry or at least those who have it, it's great. But if you're a supplier, for example, >> tough. Yeah. >> Tough. >> Tough. Nvidia tough obviously the Neocloud's tough um if sort of all your existing business is baked into your valuation tough >> scarce capacity it can help a company already selling compute it can also slow new orders for its suppliers for this ranking I want to know where that shortage could strengthen the business and where the price well already assumes it now let's start with Microsoft shares are trading around $535 now they're only a few% away from their all-time highs at $560 is definitely a small reset next to something like Alphabet and Meta. Wall Street though near all-time highs. They do give it a strong buy, seeing Alpha on the weaker side. And they're up 11% this year over the last year, minimal over the last five, sitting around 60%. But look at Azour. The revenue bars, while they've climbed quarter after quarter, and the latest growth reading is sitting around 48%. It gives Microsoft a direct way to earn revenue on the compute that it's already putting in place. And then we've got the comparison which puts Microsoft's commercial backlog at 677 billion. It covers more than Azour. A lot is contracted and timing still matters because those contracts, they turn into revenue over a period of years. And this is the cash flow image that I want you to see. Microsoft generated 58 billion in operating cash flow in the September quarter after $ 39.4 billion of cash capex. It had around 18.6 billion left. And cash capex is still rising. The red Microsoft bar was just under 20 billion a year earlier, about half of their latest level. I want to know how quickly the new capacity can start paying for itself. And then we move on to return on invested capital for Microsoft. It's sitting around 22%. I mean, that's down from the highs around the low 40s. It gives me a concrete metric to watch as the capital base expands. And they're currently trading around 26 times forward earnings against an average sitting closer to 30. Now, it is an improvement on price, potentially an undervalued signal, but I want to see what cash flow recovery I still need to justify. I mean, if we take a look at the blue tunnel from Simply Safe Dividends highlighting fair value, well, it's sitting just below the bottom end, potentially an undervalued signal over the last 5 10 years. Microsoft, I mean, for the majority of this 10-year period, it's trade at a premium. Investors throughout 2026 have been looking at this as a potentially undervalued level. Right now, is sitting towards the bottom end. Now, my DCF from 2027 to 2030 follows analyst estimates, rising from 50 billion to 180 billion. Now, I would say that's a fairly aggressive climb. I'd personally want a meaningful discount before putting my money behind it. And this comes to a total of $566. Against today's price, it's really only a margin of safety of 5%. Look, the business can do well, but it can also still give you a modest return. If we go back and we look for example at the lower case here 10% well that comes to $452 even though it keeps the strong early recovery. It's why a small gap to the central estimate it doesn't give me enough room to personally add. Now if we look at their leverage for Microsoft it's very low. We're talking.33. It can fund their plan. My decision though today is about the price. It's a hold here and I'd reassess around $510. Although I would say Wall Street with their strong buy rating, they disagree. They have this at $634 in the shorter term, implying upside around 18%. Now, before we jump into the next stock meta, we're going to listen to Tom Lee's response to the sector repricing. Listen for the distinction between the demand for AI and how quickly the industry can start to add capacity. This matters for both the chip companies and their customers. What's really being discussed here is a slowdown in the US, but that means a lot of opportunities are going to emerge for either states that embrace AI or other nations that have lower power. So I I think in some ways this is sort of a a speed bump question, but does that warrant the massive massive repricing of these stocks? I I think that's overly done. Tom Lee's case depends on demand holding up. You can buy that argument and still be selective. A lower chip multiple, it gives me a reason to look. The price of each customer still has to make sense on its own. Now we move on to Meta trading around $65. The company while trading towards 52- week lows, it's down more than 20% from its high at around $780. This is the first of the five where the size of the pullback really interests me. We get another strong buy from Wall Street, very weak buy from C Alpha where they're down year to date. Over the last year, also down 5%. Over the last five though, they're up 77. And Meta's ad revenue, it grew around 26% in the September quarter. Now, we can see here Amazon and Google's broader advertising, they're around 11%. It's a wide gap, even allowing for differences in what each of the company actually counts. And then if we move to the absolute numbers, well, meta ad revenue, that was around $63 billion, almost level with Google search revenue alone. And here's what I'd like about the model. A better recommendation can keep someone watching. Better targeting can make that attention worth more to an advertiser. Both can show up in products than Meta already sells. But look at this last bar. The chart has quarterly free cash flow around minus $1.2 billion. Ad sales and cash available to owners. They can move in opposite directions when investment is rising. And we can see this cross company comparison is highlighting that Meta spent slightly more on cash capex than it generated in operating cash in the September quarter. That's the cost I want to set against the improvement in ad performance. Now on the positive side, they're trailing net debt around 0.2. It leaves room to handle a heavy investment period, but I still want the returns for Meta from their advertising to translate into cash over time. Now using roughly 35 $36 the stock is trading around 17 times 2027 earnings it gives me a more forgiving starting point than what we just saw with Microsoft. Now simply save dividends they do use slightly different datas we can see here but the conclusion is that MED is trading below the 5-year average 18.8 today against the historical 21.7. Both the comparisons help and they do point to potential undervaluation. Now going to my DCF, we can see here it allows for -20 billion of free cash flow in 2027. Then it gets to 110 billion by 2030. Now it's a big assumption again in line with analyst expectations where we have been using a 9% discount rate throughout the stocks today. It gives us a value of $814 implying 35% upside margin of safety sitting at 26%. It's a much wider gap than Microsoft which is why I'm prepared to give Meta more time today. Now the low growth case that sits at $668 again keeping the early recovery. So the position size it has to account for the possibility that cash comes through more slowly than all three cases assume. Now Meta for me it's a core buy in stages around $600 under $580. I'd look to add if the ad trend holds a bigger decline will it gets me back into the numbers. Where Wall Street with their strong buy, they see around 40% upside in the shorter term. Although analysts still very bullish, still keeping a $1,000 target. Now Amazon closed yesterday $260. The shares actually when we take a look they're not that far off 52- week highs $287 where we get a double strong buy. Wall Street want respectable buy from seek Alpha. Now we can see up 13% year to date over the last 5 years up 48%. What I want to know with the company is how much of the good news is already priced in. Now if we start with the scale this graphic Amazon revenue per day if it was the latest quarter around $3 billion that's revenue hitting their company every single day for a business this large. The question is where the next dollar of growth comes from and how profitable it is. But look when we change it to Amazon's profit per day. Well, the latest one we can see for the quarter September 26, $35 million. The business has got much bigger, but it's also got much more profitable. That sets up the most surprising chart in this section. And that's their trailing operating profit that reached $104 billion. Trailing free cash flow, though, that fell to minus47 billion. These two lines tell very different stories about the exact same company. Now the company we can see operating cash flow it continues to rise and we can see their margins operating margins in fact they're rising to free cash flow that takes off capital investment that's where the cost of the buildout shows up for shareholders now here's the strongest part of the Amazon case we can see AWS backlog that's sitting at $578 billion now I take this as evidence of contracted demand for a lot of the capacity that Amazon's building and this is where the bottleneck meme earned this place. If demand is waiting for machines to come online, the pace of delivery can determine when Amazon starts billing customers for the commitments in the backlog. Obviously, I still want to know when those contracts convert into revenue and what Amazon earns after paying for the capacity. A 5-year commitment in cash received this quarter. They sit in very different places for our valuation. Now, Wall Street, they're expecting around 26% upside in the short term, $327 target. Range wide though as with most stocks 230 lower end 405 upper end and this is the table that shows why people are willing to wait. We can see trailing EBIT DAR that's sitting at 33% the underlining business is getting stronger that gives Amazon more room to absorb the cost of the buildout and analyst they have around $1067 of earning for 2027 at the price today you're paying around 24 times that number. Now in this DCF model free cash flow it goes from 5 billion then to 20 billion then to 60 to 120 for 2030 hitting 175 billion. That is a big big recovery from what we just saw on the trading basis. Now put that next to the starting point. The business has generated a lot of operating profit and I can see why investors expect a recovery. What I'm less certain about is the speed of that recovery. Now the low growth case that sits at $256. It still shares the same early recovery as the middle case. If the spending cycle lasts longer, I'd run a separate scenario with lower early cash flows and we get the central model $312 a day against the price 17% margin of safety. I personally want maybe a slightly wider cushion when the results depend on such a steep recovery. Now the balance sheet, that's the reassuring part. Net debt under one times EBIT DAR on the trading basis. Net debt to capital sitting around a quarter. There is room here to invest for a period of weak cash flow. My verdict is to hold here below 245. Perhaps I'd consider a starter around 230 to 235. That would get my attention. If the backlog and operating profit case still look sound. Now, keep in mind the balance sheet as we switch to Oracle. Both companies have big cloud ambitions. The amount of breathing room they have if a project slips, that's where these two investments really start to separate. Now, Oracle's trading $115. It was down 7% just yesterday. Now, I would say this price, it already reflects a lot of fear. What I want to work out is how much of it is truly justified. Down 41% year to date. Over the last 5 years, they're up only 21% pretty much trading at 52-E lows. Where we get just one buy rating, pretty much a strong buy from Wall Street, 4.46 out of five. And we can note forward multiples sitting 13 and a half times against a 5year of 20. The yield also above historical average on the usual first pass screens. There is plenty here to draw people in. And when we take a look at the blue tunnel also signaling a potential undervaluation signal. Look at the last 10 years like we see with other companies. This one very rarely enters into an undervalued signal. You'd pretty much need to go before 26 to the COVID drop in 2020. Now, earnings estimate for May 27 is coming in at $18.14. Following fiscal year, that's coming in around $11. If analysts are right about this jump, well, today's stock price is sitting around 10 times 28 numbers. And we can see where excitement comes from. For Oracle, revenue growth year, that was 22%. Forward figure, that's sitting around 32. Trailing EBIT DAR that was up 47%. Oracle is already growing rapidly and management slides it points to at least $90 billion of revenue this fiscal year and at least 225 billion by fiscal 2030. The bet here is about how much capacity Oracle can bring online. Now look at the cash flow bars. Fiscal 2026 it came in around 24 billion and the trading bar that's even worse. The chart even projects further cash outflows before it shows a positive fiscal year figure. And this is what makes Oracle different from Amazon. We can see debt and lease bars growing sharply. The buildup, it can still create value, but financing it has become a major part of the investment case. And then you've got trailing net debt. That's a little over three times. The next 12 months, yes, they're forecasted to improve to around 2.3, but that figure depends on the earnings in the denominator actually arriving. And here's management's cash flow road map. It points to positive free cash flow during the second half of fiscal 2028 and 30 billion or more in fiscal 2029. I want to see how the funding gets Oracle there. And then compare that road map with outside forecast. It shows a much smaller positive free cash flow figure in fiscal 29. The gap that's exactly what I'm trying to price in today. Now [clears throat] you also have debt and leases. They come with payment schedules. If a data center takes longer to fill, those bills can still come due on time. That makes delays more expensive for the equity holder than a revenue miss alone would just suggest. Now, the investor slide, it also shows $20 billion of additional capital split between equity and debt. Both matter for the model. Debt affects financing costs and equity affects how much of the upside belongs to every single share. Now, when I hear the headline earnings growth number, I check them per share. A company can sell more, earn more, and still give each share less of the improvement if it's issued a lot of new equity. Now, there's also political risks, too. We can see a report citing that a $7 billion chip lease with 10 cent was cancelled after the US officials raised concerns. I treat that as a reported setback and an example of the kind of risk that's involved. And net debt to capital, that's about 2/3 on the chart. The figure it helps explain why I've sized this differently from Meta or Alphabet. I want to be able to hold through a funding surprise. Now, my model allows for two more years of negative cash flow before it turns positive in 2029. It then gets around 31 billion by 2030. The valuation needs a recovery with real scale. Now, this central value, it comes to $179 implying 56% upside as well as a margin of safety of 36%. Now we can see the low case that's 10% growth moving forwards coming to $131 and that changes the later growth from 2030 onwards. A slower buildout or a much weaker early cash flow path it could put fair value below the figure. Now the average Wall Street target is $235. That implies here 104% upside more than a double. The low target well that's $110. So that is a wide range of expectations and one more reason to keep this position small. The cash test for me is whether the negative bars begin to shrink on the way to management's timetable. If the outflows widen or last longer, I need to rerun the model from that new starting point. Now, at around $115, I can see a specive entry. Below $110, the price would give me a little bit more room. Above $130, I'd wait for clearer evidence of the recovery. We then move on to Alphabet, trading around $280, is roughly 30% off the highs at $49, trading pretty much around 52- week lows. Incredible to see for a company that's been very strong this year. And it's got a strong buy rating from Wall Street. Weak buy from Seek Alpha. Year to date, down 10%. Over the last year, flat over the last five, up 90%. This is the biggest reset among the big four names. It comes with a real question though about search. Now we can see search is close to half of revenue. The share has fallen as other parts have grown. Search it can be growing in dollars at the same time as becoming a smaller share of alphabet. And the ad impressions chart it gives me something specific to watch. The latest growth rate is negative. I want to know whether better monetization can make up for few impressions especially as the search result page changes. Now cloud for Google that's the counterweight. We can see the comparison showing $30.7 billion of quarterly revenue up 103%. TPU system sales are part of the mix. So I'd be cautious about extrapolating that number. Then annualize the latest quarter and Google Cloud is getting close to Azour's run rate on the chart with AWS still ahead is a useful view of scale. But remember a run rate it's simply the quarter multiplied by four and cloud share of Alphabet's total income has gone from negative to around 20%. This segment has become a more important contributor. It matters more to me than a single quarter's growth comparison. And the backlog comparison, it puts Google at $561 billion. It also attributes a large share to anthropic. I want to see how quickly those commitments convert and how concentrated they are. And here's the other side. Alpha's free cash flow that was around minus $5.9 billion, then minus 9.1 billion in the following quarter. The Capex bar explains why I'm cautious about the timing of the payoff. Now, using the 2027 earnings estimate of around $14.95, the shares they're trading around a forward P of 19. I prefer to compare that year across the stocks when the nearear numbers are a lot more volatile. Now, if we look from Simply Safe Dividends, they've got the forward P around 20 below the 5year at 22. So, a potential undervaluation signal for which when we look at the blue tunnel, it's sitting right towards the bottom. Although notice we haven't seen it below this tunnel all of 2026 going back last time was around the beginning of 2025. Now the DCF assumes negative6 billion next year followed by just 1 billion in 2028 then a jump all the way to 200 billion by 2030. That's the forecast I challenge hardest from analyst expectations because so much of the value depends on it. With saying that the base value comes to $326, 16% upside margin of safety today sitting at 14%. It's enough for me to consider stalling, especially given the different ways that Alphabet can monetize the infrastructure. If we look at the lower case here, 10% will value comes to $272 near today's price. It's just a reminder that the base case still leaves less room for error of the meta even after Alphabet's bigger draw down. So, Alphabet for me is the second core buy around $280. I'd probably start buying gradually around $260 to $270. I'd look to add if search and cloud, they're still earning their investment. Now, for a quick recap in fifth, that would be Microsoft. The model we can see gives around 5% margin of safety. Even with a steep cash flow recovery, I like the Azure and software exposure, and I'd wait for a wider gap between price and value. In fourth place, we have Amazon. The upside is there. Margin of safety 17%. The low case though we can see it sits pretty much at today's price and I'd rather wait for the entry level that I outlined then assume that cash flow turns around quickly. Third up is Oracle. It's got the highest upside with a margin of safety of 36%. But I'd keep it smaller because the cash flow recovery and financing costs they leave more ways for the equity to disappoint. Second is Alphabet. The draw down gives me a better entry and the base case offers around 16% upside. I want searching cloud to translate that opportunity into more cash across the group. And first up, meta. The base case has around 35% upside margin of safety of 26% and I can follow what better recommendations and targeting do for the ad business overall. This is where I would start a core position. The ranking is the way I would allocate attention and risk across the five today. Now, it can change quickly if the share prices move or the cash flow evidence changes. Now, we're going to bring it back to the suppliers from yesterday. Now, markets open. We're going to do a very quick refresher of some of the stocks that we saw yesterday that were battered. First one, Nvidia is up 6%. Bit of a rebound from yesterday. Still trading below $200. Still year to date, not really great, heading towards 52- week lows. While both Wall Street and Quant do still give the company a strong buy rating and in fact Wall Street strong buy that indicates 70% upside in the shorter term. Again very wide range more bullish analyst 515 where it's trading at a full AP 16.1 still significantly below the 5year of 35 and our updated valuation based on today's price still hefty margin of safety 24%. We can also see with using a 15% growth rate, the reverse DCF is 8.6. This disconnect is where the upside here of 31% comes. So that was an update. Nvidia 24% margin of safety looking very strong in terms of an opportunity even after the slight rebound today. We then move on to Broadcom rebound as well up around 4% but nonetheless year to date still down double digits still trading towards 52- week lows where we get a double strong buy from both Wall Street as well as Quan. Now in terms of upside again very respectable very large after that massive drop we saw yesterday 74% upside price target $527 where the forward valuation still coming below the 5year average of 24. Although if you want to look at the lowest point, it was the end of 2022 trading at a forward P around 16. Not too far off it today. Now the valuation today, the updated margin of safety 41%. Remember that's using a growth rate of 20% pretty much around the 5-year KGA more conservative than the 10-year KGA where the reverse DCF that's pointing to 12.2% growth to justify today's price. Another potential strong opportunity. Then we move to ASML. This one rebounding up around 6% up double digit year to date 35% trading midpoint of the 52- week range weak buy from seek Alpha strong buy from Wall Street where analysts on average are seeing around 50% upside interesting to see the most bearish analysts they see this below $1,000 $867 more bullish heading towards $3,000 where current valuation is one of the lowest in the last 5 years at 22 5-year average sitting at 32. too. Now, out of the three that we've seen so far, ASML currently has the lowest margin of safety even after the drop around 6 to 7%. In terms of upside from the intrinsic value, 7% not massive really because the reverse DCF already baked in today is 14% growth where we have used 15%. If you believe ultimately that's too conservative at 20% while the value comes to $2,100, 48% upside. So, it will really depend as an investor where you see ASML in terms of the sensitivity table. Like I said, 7% margin of safety does make it the weaker one, at least from a valuation standpoint when looking at the previous two stocks. We then move on to Micron. Significant bounce up around 10% year-to- date up triple digit trading around the midpoint of the 52- week range of the 52-E low that was below $200. Double strong by Wall Street Quant weaker buy from Seek Alpha and analysts they see more than a double in the next 12 months. 117% upside although look at these incredibly bullish analysts they see it at $3,000 less bullish 360. Now the valuation with the updated numbers giving us a margin of safety of 45%. Now that's using 5% growth although bear in mind we've used a bit more conservative but still use a base of analyst projections for 2027. The reverse DCF is now implying 5% decline over the longer term. So for MU, we get a massive MOS as well as tripledigit upside from Wall Street expectations. We then move on to Lamb Research. Well, this one like MU that's up double digits there on the rebound 10 11% year to date up 20%. Nonetheless though, still trading towards 52- week lows. This at one point in 26 was trading above $400. Wall Street, they've given a strong buy. See Alpha though they see it as a hold where Wall Street they see this one as good consideration for the portfolio 78% implied upside range $250 to $500 where it's probably one of the first today where it's actually trading yes below the 5year 20 against 23 but the disconnect not as much as the others and you can see we had a 35% margin of safety in fact using a 15% growth rate which is lower than the 5year higher than the 10-year reverse ECF it's now in the single digits at 8.5%. So in terms of margin of safety, it is looking quite significant today. Then we move on to KAC. This one with a bounce 8% trading in the year in fact up 15 in terms of 52- week range right there towards 52- week lows. No strong buy from Wall Street but still respectable very weak from Cy Alpha where Wall Street anticipating 57% upside and in fact this one actually not too dissimilar from their 5year average 23 forward earnings valuation against 23 1/2 and actually like ASML very limited in terms of the margin of safety sitting at just 1%. Now we have used a growth rate of 15 in line with a 10-year KGA reverse DCF is actually not that dissimilar. Hence why we see very marginal margin of safety. So KLA probably within the same group as ASML for attractiveness today. Although ASML in my view is the higher quality company. We then got Advanced Micro Devices, the company with the largest bounce around 12% year to date still up triple digit. This company not long ago trading at $660. Double strong by Wall Street quant seek Alpha going the other way at a hold where Wall Street's expectations around 43% upside some sit at 1,250 in the next year. Now this one I see around a 14% margin of safety using a 15% growth rate not too dissimilar from the 5year KGA reverse DCF coming down as the price is dropping sitting at 10.8%. So AMD whilst being attractive in comparison to Nvidia slightly less so and then we can end on Sandis this one up around 8% today up $268% that's year to date even considering the fact that this one not long ago was trading over $2,300 very close to a strong buy from Wall Street respectable buy from Seek Alpha strong buy from Quan and well this is the second one I believe we've just seen where Wall Street anticipating more than double in terms of upside 132% higher end 3000 lower 870 where we have a near 50% margin of safety we're using no growth over longer term although considering analyst 2027 numbers reversed ECF implying negative 12% so that was just a quick run through of some of the stocks we covered in yesterday's episode however the draw down was even more hence the quick update let me know though your thoughts below what have you been buying today whether it's some of the companies we discussed at the beginning or maybe some of the semis that we had a quick recap. If you enjoyed the episode, smash the like button, hit the subscribe and bell so you're aware of future episodes. Don't forget to click on the pin comment where you can sign up to the newsletter, read the articles weekly basis covering severely undervalued stocks as well as what's going on in the market. As always though, and more importantly, have a great day. I'll see you all on the next

Comentários 0
Entre para participar da discussão.
EntrarAinda não há comentários. Seja o primeiro a compartilhar sua opinião!