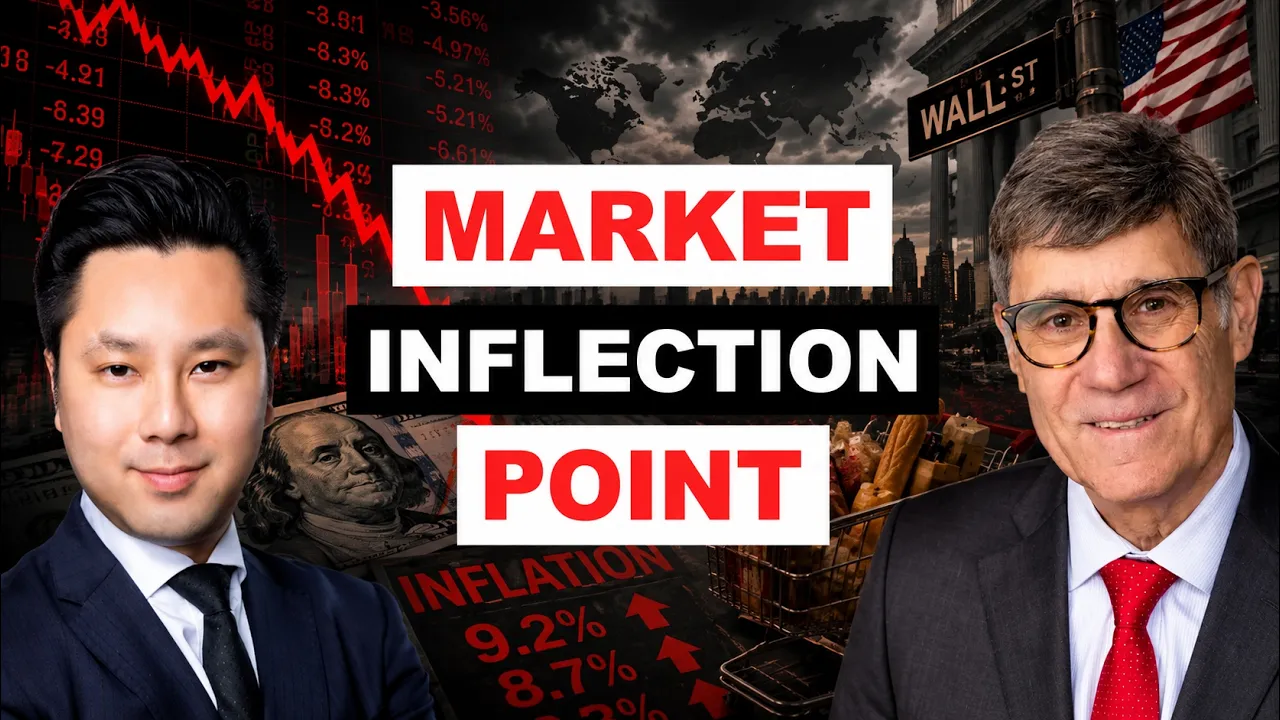
Stocks ‘Can Collapse At Any Time’ If The Fed Does This Warns Analyst | Milton Berg

- Video return
- -13.34%
- Calls
- 1
- Buy / Sell
- 0 1
- Published
Recommendations
Entry is the asset's closing price on the publication date. Current is the last close on record.
-
Entry $504.22 29 Jul 2026Current $578.90 07 Aug 2026Result −$74.68
We're short semiconductors, we're short the NDX and we're short the OEX.
Context "We're short semiconductors, we're short the NDX and we're short the OEX. Those are the three indices we're short for the institutional investors."
Full Transcript
It's Wednesday, July 29th, and we're recording this around 12:30 p.m. Eastern time, right before the FOMC meeting. The markets are down intraday. The NASDAQ is down as of 12:30 p.m. about 1.4% intraday. The S&P 500 is down. Why are markets sliding right before the FOMC conference? What are markets expecting out of the Fed, not just for this meeting, but long-term? We're going to answer much these questions and much more with Milton Burke, founder of MB Advisors. Milton spent decades on Wall Street, previously at Oenheimer as well. And he's been a fund manager for many, many years on Wall Street. Now he manages institutional clients. Check out his work link down below. Milton's going to give us not just a rundown of what we can expect today from the FOMC. Everyone's expecting rates to be unchanged, but what happens next? How many rate hikes can we expect later in the year? How will markets react to rate hikes? Will we get a major bare market like in 2022? Well, spoiler alert, Milton is tactically short right now. We're going to find out why. And this video is brought to you by Koshi. It's the largest prediction market in the United States. Unlike a sports book, you're trading peer-to-peer on real world events from economic data to political outcomes. And the price moves based on public opinion, not a house. Go to the link in the description down below or scan the QR code here to get started. And new users who use my code lin can get up to $500 when you trade $25. Kashi is CFTC approved and available in all 50 states including California and Texas. And right now there is a trade for the number of Fed rate changes before 2027. Traders are predicting that the there's 30% chance of exactly zero changes, exactly one rate change, 41% and exactly two rate changes, 19%. I want to stress that perhaps these are hikes, not cuts. No one's predicting a rate cut this year. If you place $50 down on exactly zero, for example, because that's what you believe, then your payout may be $142 if you turn out to be correct. Again, link down below or scan the QR code here. Milton, welcome back to the show. Good to see you. >> Thank you, Val. Great. >> Milton, last time you're on the show, um I believe we spoke before the Iran war started, so it it's been quite some time. Volatility has uh been the name of the game in the last couple months. And I want to ask you right now uh what the key variable is or number of variables if you can you know uh narrow it down to a few that you think are the most important for moving markets going forward. Now we're speaking right now at 12:00 p.m. Eastern time, roughly 12:00 p.m. Eastern time uh right ahead of the FOMC meeting. It's expected that no rate hike will happen today, but you told me offline that uh they are likely to rates raise rates later this year. So give us an expecta, give us a teaser on what we can expect later today at the FOMC and ultimately what you expect the Fed to do. >> First, I'd like to say I believe Kevin Walsh may prove to be the greatest Fed chairman in the history of the United States because he's very well educated. He understands monetary policy. He's not influenced by pol by politicians or by politics and he's serious about fighting inflation. Since he is serious about fighting inflation, it's highly unlikely that he'll do nothing at the current meeting because we're now in the midst of 5 years or so of inflation above the Fed's target of 2%. I happen to believe that Kevin Walsh will probably lower the target to 1% or lower sometime during his reign as the chairman because a 2% inflation really is not acceptable for savers. And I think Kevin Walsh really is interested in the American public and this the retail public to be able to um have the currency maintain value rather than have it lose 2% peranom. So today I think at least he's going to do something. I think he may uh do some quantitative tightening which would be sell which would be buying some which would be selling some uh some some of the bonds on the balance sheet. I think he may make an announcement by reducing the balance sheet. I also think it's likely they will raise rates even though the consensus they won't raise rates. I think it's likely they raise rates not because of oil prices or because of inflation, but I think they'll likely raise rates because the 2-year yield is now at a at a at a high and the Fed historically has always followed the two two-year yield. They never let the two-year yield get ahead of them. If two-year yield is rising, they're going to raise the short-term rates. So, I think I'm against the consensus. I think it's more than 50% likely they'll raise rates. And I think it's definitely likely 100% I'd say. They can never say 100% but they will definitely do something. >> Why is Kevin Walsh going to be the greatest Fed chair of all time? Fundamentally, what is different between this Federal Reserve and Jerome Powell's? >> Well, Kevin Walsh was a real Wall Streeter. He was involved in in in in markets, involved in asset classes, and I know from his background and just hearing him speak and knowing his education that he has a a total grasp of monetary policy. And I don't believe he's a Keynesian. I think he's more of a monitorist. He's more eclectic in his approach and therefore I think he will be one of the great one of the greatest. Why I say one of the greatest now maybe one of the greatest I think Paul Vulker was was was good as well but Paul Roker came within a major crisis and he knew exactly what to do. He had to get inflation down from 10% you know down to 65 43%. Now we're not in necessarily in a crisis. We're just in a situation where we have uh inflation is higher than it should be and that most Fed Fed pe Fed chairman would just sit back and be patient and wait and think rates are coming down or think inflation is coming down. But I think Kevin Marsh is a man of action. He's he's a man of integrity. And that's really what you need. You need a Fed chairman who will not be influenced by by uh by by Wall Street pressure or by political pressure and he'll do what's necessary to bring inflation down. And I think he stresses the most important part of his mandate is keeping inflation low. In other words, keeping our currency strong or keeping our currency keep keep allow savers to ultimately make money by saving the money. And I think the sec the the idea of um of uh of employment where the sec the Humphrey Hawkins mandate was to have low inflation low lower low unemployment. I think that's a secondary factor. I think he believes that once you have a stable economy with low inflation automatically the unemployment rate unemployment rate goes down and the employment rate goes up. Now actually we're in a very good economy currently because you know as you know you had the um the 187,000 people filed for unemployment. We had the lowest filing for unemployment since 1969. We're in really really in in a very very pretty good economy at this point. In a good economy, he doesn't have to worry about tightening a bit. If we if we rolled over into recession or a slowdown, maybe the Fed chim will have to worry about tightening. But in the current environment with um with inflation high, with the economy strong, there's really no reason he should hesitate. And I believe there'll be some action in two hours from now at the meeting. How would you as an investor or fund manager look at Fed's responses to data when Kevin Warts made it clear at the last FOMC conference that he is going to not give forward guidance and perhaps they won't even start they won't they won't even use dot plots anymore. So it's very difficult to see what he might do next. >> Well to see why he might do it you have to put yourself in his shoes and you have to look at the data yourself. And again, just looking at the data, you have a strong economy. No reason not to tighten. You're not going to cause a recession by starting to tighten. Inflation is higher than it should be for 5 years. You got to do something about it. And interest rates are moving up. And maybe they move up for positive reasons. They might be moving up because the economy is strong. And when interest rates move up, the Fed doesn't want to fall too far behind the the natural rate of the market. So, it's it's clear that uh put myself in Kevin Worsher's shoes and look at the data he looks at. Um that's all we really got to do and not worry about uh information that's really not relevant like oil prices are really not relevant to Fed policy. Fed should just ignore oil prices. Oil prices is a political issue and if oil prices go up, other prices should come down in a true in a true um uh in a true in a true um economy that's managed properly. >> All right. There's now a 41% chance the this is prediction Marcus. This is Kowi. Uh the prediction markets I like to look at it. It's they've been pretty accurate up until the uh uh close the closer you are to the actual event itself. Number of Fed rate changes before 2027. Exactly 0 30% exactly 1 41% exactly two 19%. Um uh know that the wording is Fed rate changes. So it could be up or down. But I looked at another prediction. No one's predicting the rates are going down. So exactly one rate hike is 41%. Does that seem a bit low to you? Yeah, I think it's a little bit low to me, but I think the key isn't the rate hikes. For Kevin Walsh and for myself, the key is really the balance sheet. The balance sheet is way, way, way too large. You have a balance sheet, you need in a in a war zone when the United States is at war. Now, they yes, they are at war, but the truth is uh you got to get that balance sheet down. And that's to me that's more important than raising the rates. raising the rates is more of a crude method of getting inflation down, but cutting the the balance sheet which is actually directly affecting money supply is is far greater uh has a far greater effect on the inflation rate. >> Okay, so exactly two rate hikes 20%. And no rate hikes. Let's take out the no rate hike situation. 20 What happens if we get two rate hikes, Milton? Is that a little bit aggressive as a policy? two, you know, there was once a famous market technician, Edson Gold, and he would claim you don't the market doesn't peak until you get two two Fed hikes. One is not enough to peak the market. So, as a as a technician looking back at history, you'd say the Fed raises rates twice, then you may have to worry about the a market peak. I I I it doesn't really work as well as it's worked in the past. But one thing we do know, no major bare market has ever occurred without a Fed hike. So, currently the Fed has not hiked. So, I I don't think it's highly unlikely that you're going to have a a major market peak. Now, even though it looks pretty bad, I I still think what we're seeing now is corrective action. And um on the other hand, if they if they raise rates once or twice this year, that might uh slow the economy and a slowing economy itself can cause a a a bare market. You don't need a recession to cause a bare market. A nice slowdown in economy, especially when the when the stock market is overvalued as it currently is, can cause a a correction. Now, I'm I'm more concerned about stock market than I am about the economy. I'm I'm I'm not an official economist, but I'm an official stock market tracker and technician and market analyst. And to me, I like to focus on markets. And I think that at this point, even if, as they say, Kevin Walsh may be the greatest Fed chairman in the history may prove to be doesn't mean he's going to prevent bare markets. You know, he shouldn't be worried about what the stock market does. He should worry about what inflation does and what the real economy does. And when you >> final question on the Fed before we move on to the markets when you say that he's going to be the greatest Fed chair, uh what metrics are we using to evaluate how good or bad a Fed chair is? >> Well, did number one is will he get inflation to below 2%. That's really the first thing. And secondly, how will he do it? Will he do it in a responsible way, in a way that doesn't affect the economy, doesn't shock the economy, or will he do it in a um in an irresponsible way where he'll let the market uh let the market tell him what to do? wait till inflation goes up a little more and then panic and start raising rates 3/4% 1% at a time. I think he's uh astute enough to to to uh to anticipate the future and rather than wait for uh wait for a certain wait for the the the inflation get ahead of itself. I think we'll anticipate and do what's necessary to bring rates down. You know, you want to have a a you don't want a heavy-handed Fed chairman. you want to have a a a a calm Fed chairman who who makes decisions from month to month and follows the data. And that's I think he'll do that. And again, he's been on Wall Street. He's been involved in markets and uh and that's something most Fed chairman didn't really have or weren't successful at. >> All right, let's look at how markets are behaving today and then I'll let you share I'll I'll share my screen very briefly and then I'll let you share yours. So today we're looking at uh a steep decline ahead of the FOMC meeting. The NASDAQ is down 1.4% and the S&P is down about 1.1%. Uh gold is actually also down uh about 60 basis points and Treasury yields are up slightly. So this is right before the FOMC meeting. I wonder why there's a sell off before the FOMC. Uh I wonder if that's related or related to maybe something else. Uh let's see what oil is doing right now. Uh oil is holding steady around $85 a barrel at for the WTI and uh I had up the SMH which is semiconductor ETF the Vanx semiconductor ETF that actually has been falling for quite some time now. It peaked in early uh late June and it's down already 25%. I'm just making the point that certain subsectors within tech have already experienced a bare market. Uh Intel is already down more than 40%. And across the pond SKH Highex in South Korea is down 50%. Um and Sandex just went down 14%. So I uh just a couple days ago. So while the overall tech uh index, the NASDAQ is holding up steadily close to its all-time highs, the semiconductors have already been selling off. I wonder if that's a leading indic indicator for anything else, but we can talk more about that. But broadly speaking, why are we seeing a selloff today right now at 12:00 p.m. 12:20 right now? >> Yes, please do. >> Well, today's selloff is just a continuation of a sell off that began in mid in mid June. I I don't put much uh weight in any one day's action because I believe that every single day's action is really is really random except the trend has been down since June at least for these uh indexes that you you've exhibited and therefore today's decline. Now there's something else we do. It's work that we do. It's interesting that that I'm meeting with you today. First of all, it's a Fed day which is a very important day. It's also a cycle day. Um we do some work based on the great technician uh Paul McCrae Montgomery and today actually the week starting Monday through Thursday was a clear cycle week where some markets worldwide should bottom. We actually took a 1% position in the Cosby this morning because we believe that it's it's a there's a higher probability than than random that that this decline will end at least for the short term and the mark will bottom. And one of the uh reasons we say that is because of the um is because of the cycle date currently. Let me show you a chart of the Cosby. This is a report we just sent out this morning. We're positioning long 1% in the Cosby. Now, let's look at the chart of the Cosby and see what we see. Okay, as you can see, the Cosby has declined some uh 38 I I don't I don't have the exact percentage. It's not here, but Caspia has declined significantly off its um off its highs. And it was a very speculative type of a market. It was a market in which um the people in South Korea were were leveraging themselves up to take advantage of the um of the high-tech um gains. However, you notice the decline was very very very orderly. You see, if you look at the decline, you don't see any gaps to the downside. You see a minor gap right here which is filled, but no major gaps to the downside until day before yesterday. You see? So, this this kind of action is often exhaustive. It's telling you that the market is setting up for a low and for a reversal. Considering that we're also at a cycle date and let me get the CSY up on here to exactly how it's how it's declined. Yeah, Ky declined 43.93% to this morning's low. So, we just took a shot today. And as I say, it's a cycle Montgomery cycle date. Now, the Montgomery cycle date, I don't want to take too much time with you, but it called the top in gold, which we we shared with our clients. We actually got out the day of the top on January 30th of this year. And it also called some um some of the um some of some something else. Let me give you another example. You see back over here we had we had a Montgomery cycle date from the 10th to the 15th. That was the recovery high. If this was the final high in the S&P on June 2nd, the recovery high was July 10th and July 15th. That was a cycle period from 10 to the 15th. You see? So this is a reason to believe that this this corrective action began in in June. We pulled back up to this cycle date, made a cycle peak, recovery peak into a cycle date, and now we're heading down. Now, the S&P is not really heading down that dramatically. It's really the NASDAQ and the um stocks is heading down dramatically, but these are the kind of things we look at, and this is why we we thought we're in a corrective pattern rather than a a continue up move. Now, we're not looking for a bare market at this point, and I'll tell you in a in a minute why. We're just looking for a correction, but a correction could be five, six, seven, eight, nine%. The S&P did decline 5.03% to the June 9th. At this point, you would not believe that's the final low of this correction, but that that that idea may change. This shows a an island reversal at the first recovery high, which is which is negative. And here you have a peak on cycle day is also negative. That's the S&P 500. to show you something interesting. The the S&P 100 S&P 100 which is the 100 biggest stock in the S&P 500 shows a little a different pattern on that July 15th Montgomery cycle date it gapped up which is exhaustive and that was the final recovery high for that index. So based on the technical things we look at we're looking for the markets to uh to decline. However, the Cosby which has declined so dramatically into the cycle age, we're willing to uh test the waters and go 1% long. The CSP, if it works, uh if we see if we see evidence of a turnaround, we'll probably add to the position. If the if the lows don't hold, we'll probably um we'll just get out of the position. But that's >> Sorry, what's a what's a Montgomery cycle? >> Okay, Montgomery, you have to follow the work of Paul Paul Montgomery. I don't want to tell you exactly what's involved, but he has generally every year there are two periods during the year in which markets are prone to top or bottom. It's it's a reversal cycle. You don't know if it's going to call a top or going to call a bottom. But in the current instance where the markets peaked in June and we knew there was a cycle in July, we told our clients it's highly likely you'll get a spike low into the July cycle, which is exactly what we're seeing. You're seeing spike lows. Whether these lows hold or not cycle work, no matter what kind of cycle work you use or whether it's seasonality, it's all highly speculative. Realize we're not claiming that cycle work is something you can uh get a PhD on. You understand? cycle work is highly speculative but you have to have be an expert to know how to use it. that every cycle is going to turn every market. But the reality was with the kind of action you see in this market. It's more than random. It's highly it's probable that you're going to see some sort of a turn. This is in the Philadelphia semiconductor index to show you interesting technically what you saw. You saw a double island top. You saw two-day island top into the exact peak. Island top means get a gap into the high and a gap off the high. In other words, it leaves an island leaves a space between the the on the way up and a space on the way down. You have a two-day island top in the um in the um in the stocks and you also have a um a um a uh a six day a fiveday island top right here. You see, in other words, it gapped up into here. It wasn't the final high, then it gapped down. So, you have a double island top, which is technically a sign of of a reversal. And then finally, the market declines, down 26.31%. And today's Montgomery data, right? Montgomery date low. Maybe this will be the low. I mean, as let's face it, the market's down 26%. And at the same time, the equal weighted S&P 500 is at a new all-time high. As you know, you may have heard this. If you look at the individual stocks of the S&P 500, they're at an all-time high, which tells you that perhaps the semiconductor decline is just a technical decline. It's a decline because it got overvalued and overchased to the upside. But maybe it's not reflective of what's going on with the market as a whole. And maybe it's not reflective what's going on with the um with the economy at all. So, anyway, this is what we're looking at. We're not we're still short. We're short. We're short semiconductors. We're short the NDX and we're short the OEX. Those are the three indices we're short for the institutional investors. We got short in June and we're looking to cover but we haven't covered yet. >> All right, you're short. But for now, uh if you're if you if you believe that perhaps maybe a technical decline, doesn't that indicate to you that it's a good buying opportunity of something just fell because it's overvalued or corrected? It uh it um went back to its mean. Um, doesn't that doesn't that mean that uh investors looking to get in now is a good time? >> That's a very good question and that's a very good question. A fundamentalist would ask that question but ignition would say well if it got overvalued and pulled back to the mean what's to tell you it won't get undervalued and go below the mean. We need evidence that the market is bottoming. The the main evidence we have now as I said it's a Montgomery date and you had in the Caspby you had the exhaustion in the Caspie right here. We had the exhaustive gap right here you know so far two days before the low. So, we're looking for evidence of a low. It's not enough if the market's corrected some. Now, of course, an institutional investor who's quite bullish on the semiconductors should start scaling in and buying it to weakness on an assumption that we're not in a bare market. Um, our assumption is we're not in a bare market. We'll get to that in a moment, but things could change. Maybe for some reason, you know, Kevin Walsh raises rates by 3% or or interest rates declined, raise rise dramatically and the economy unexpectedly turned into slowdown and maybe the June peak was the final peak. Now, we have some interesting things we saw at the June peak, which I I guess I can show you, but let's just look at a little bit individual stocks for a moment. Um, uh, we talked about the macro. Let me show you a chart from a friend of mine. Now, I I can't confirm. This is a f a fellow named Danny Perick, and he's he tracked all market crashes in history, and he's he's he's tracking it against the current NASDAQ 100, and he says we're right around here. You see, >> right? So sometime in the very near future if he's right the market should be start making lower lows and lower lows and lower lows and if you just look at today's action the markets are making lower lows will that continue I am not so short will continue but meantime we're short as well but this is an interesting uh chart I guess you can get on the internet his name is Danny Perick but um this is just a an interesting chart I you can't you can't trade based on this chart but just something to look at um I want to show somebody else very interesting at yesterday's close more than 50 of The S&P 500 stocks made new highs. Okay, yesterday the market was a low day. The S&P had been down some uh three 3% off its high. Yet 54 54 stocks more than 50 stocks made new one-year highs, which is kind of interesting. Actually, not no stocks made one-year low yesterday. Despite the fact that you had such a weak market in the in the NASDAQ and in the semiconductors, not one stock in the S&P 500 made a new 52- week low yesterday, which is which would be positive. But at the same time that the NAS S&P showed more than 50 new highs, the NASDAQ was down eight out of nine days. Now, did that tell you anything? You normally say, "This is so strange. How do you see 50 new highs in the S&P 500, but the NASDAQ down eight out of nine days?" Now, it only happened twice before, but I want to show you something fascinating because it happened once here in 1985 and the market declined another 4.5% before bottoming. Nothing to worry about. But the exact pattern took place in January 7th, 2022 at the market peak at that bull market peak. Bull market peak were on the 4th and on the 7th the S&P had 54 new highs and now have been down eight out of nine days. So this is something again you can't trade based on this. This is giving you a flavor to what's going on in the market. So while I'm telling you I still believe we're just corrective action. I'm going to show you the fact they had 54 new highs and many pundits have been saying wow there's so many new highs in the S&P it must be bullish. And I'm saying, well, look at January 7, 2022. There were 54 highs in the S&P. The NASDAQ had already peaked back in October, as you remember. October 2021 was when the NASDAQ peaked, and the S&P peaked in January of 2022. So, you could make the argument, wow, it's it's a positive divergence. 54 new highs in the S&P with the NASDAQ down for a month and a half, but it turned out to be a negative divergence. The NASDAQ won and the S&P went down another 24%. So, these are the kind of things we look at. Now the question you might want to know uh uh uh uh David is why am I not really very very am I very very bullish? Am I very bearish? Why am I saying that? I think it's just corrective action. I think it's a very legitimate question. I'm trying to I I think this action is corrective. We'll probably make higher rise later on in the year. And the question is why do I say that? Is that is that an interesting question? David, what do you think? >> I think uh yeah it is. And I I'd like to know also why you think uh the bottoms the markets haven't bottomed yet. You said we have to wait for confirmation the market is bottoming. What kind of confirmation would that be? >> So let's look at one of the reasons why it's not likely that we're seeing the low low at this point. Why you need more evidence? Let's look at the the socks index because sax index is leading leading to the downside and let's look at the volume. Let's look at the volume of this over here which is uh right here. Okay, now you see not much of a spike in volume. You see, usually when the market's down 23 24% and the market's going to bottom, you start seeing panic selling spikes in volume. You don't see any major gaps to the downside into the lows. You see, you see a minor there was a minor gap two days ago. Just a minor minor gap. Usually this is a minor gap. The low the prior day was 12 11 1217 and the high was 10799 a minor gap but usually you see a larger gaps into you see you see panics into a into a bottom you haven't seen the panic yet so that's one of the reasons I say I need more evidence also the majority of our models which which call market bottoms don't call the bottom to the exact day they call it one two three or four days after the low when you see reversal action so maybe maybe this market bottom today but maybe we will see the evidence of the of the reversal action, you know, one or two or three or four days from now. So, that's the answer to that question. Why even though even though I think we're in a correction, why we have bottomed yet, why I need more evidence, but let's let's face it, the S&P's low was on June 9th. The S&P has not declined below its June lows yet. So, if this is a correction, the S&P, it's it's kind of strange that just had about a six- day correction into June 9th and now it's way above that level. So, we think it's likely or possible the market will trade even lower. And um on the other hand, we don't think it's a bare market yet at this point. Now, I can give you some reasons why we don't think it's a bare market. And let's get to that. I might as well do that, right? >> Wait, you said we're not But but you're still short, though. >> I'm still short. Yeah, I'm short. It's called tactically short. >> Okay. >> We're short. Um we're tactically short where we're um Okay. The market bought on March 31st, 2026. Okay. From March 31st, we got a number of buy signals. Each thing on the left is another buy signal. You see? And these are the dates of the signals. March 31st, April 10th, April. Anyway, if you like, I'll show you the signals in a minute. But looking at the history of these signals, in other words, what has the market done in the past when these buy signals were generated. So, for example, this signal here saw a minimum return within 12 months of 19.70%. A median return of 26.47%. You see? So what we do is we we looked at all of the his all of the signals we got in April and we looked at what is it projecting for the market to do um currently if it follows the the the previous path. So the minimum projection based on the signals we had in April was is for 828621 in the um in the um S&P 500 which is a gain of 11.54% from the current current price level. The median gain would take us to 895823 which is a gain of 20.59%. So I built these models and these models work very well. Certainly work directionally because the market zoomed off the April lows as you know you know you have some stocks up 100%. And you certainly even the the semiconductor index itself was up 100%. And and all major averages gained the whether it's the S&P 500, S&P 400, S&P 600 or the rest of 2000 they all gained. So on a directional basis, our model worked, but we also expect the the the the projections uh to likely work. So we're not willing to call a bare market unless we see these projections failing. >> I see. >> Is this clear a little bit? If it's clear, then I can take it to the next step. >> Yeah. Got it. Yeah, that makes sense. Um I'd like to ask you some more fundamental questions to close off. Uh Milton, so ahead of the Federal Reserve, what do you think the Fed needs to say to turn markets around? In other words, right now like like we discussed earlier, the markets are still down about 1%, the NASDAQ's down more than 1% uh intraday. If by the end of the day markets are have to close up, what would the Fed have to do to turn this around? >> Turn it around on a short-term basis. >> Yeah. Let's say the Fed says something to turn the markets into the green by the end of the day. What would you anticipate that to be? Well, if if the market is anticipating increase in rates based on the two-year and the 10 year and the mark's increasing um anticipating a quantitative tightening, if that's the reason the market's declining, if the Fed announces uh they're going to sit on the hands and do nothing, that's likely to get a recovery rally in the market. I don't think that's likely to happen, but that that that that could happen. >> Okay. >> So, that that's what it would be that's it would take basically. >> I see. uh Milton, then wouldn't that basically confirm that uh inflation is no longer that much of a concern? >> If if the Fed does that, they say inflation is no longer concerned. I you know, you're asking a theoretical question and I believe inflation is still a concern. I think that the Federal Reserve believes inflation is a concern and I don't think they'll sit on the hands and do nothing. But if they do, you'll probably get a rally. >> I see. >> Probably get a rally. >> All right. Uh 2022 was the last time you got a Fed rate hike cycle. Is this going to be as bad as 2022 for the markets? >> 2022 is misinterpreted by most technicians and fundamentalists. >> All right. >> The bare market began before the Fed tightened. Bare market began in January when Putin went to war against the Ukraine. The Fed didn't begin tightening in May and the Russell 2000 bottomed in June. So the the reason for that bare market really wasn't based on Fed tightening. The reason the bare market was based on the fears that the the the the world would go to war and the fact of course that um I believe his inflation was increasing but the Fed didn't again didn't start fighting inflation until May and in June they went aggressive. I think it raised 75 basis points and in June is when the Russell 2000 bottomed and the S&V bottomed in June as well. It made a tested the low in October less than 3% below the low in June. So as I say, I think the the market misinterpreted that. Then the Fed continued tightening and the market continued rallying. You see the the from October of from October of 2022, the market all the market bottomed. The Fed was still tightening and the market continued higher. So I'm not so sure that you could just look at a previous Fed action and extrapolate for that to happen at this point. Um so that'll be the story. Of course, an aggressive Fed tightening that's going to cause a recession is going to cause a bare market. the tightening in 2022, even if you're going to suggest that the tightening is what took the market down, it did not create a recession. And people were banging the table looking for a recession. As you know, most economists at that time was looking at the inverted yield curve, calling a recession. And we using technical work, we said that the market bottomed in June and and tested it in October and we were bank pounding the table to go long and you know, we didn't we don't like to predict recession or not, but the likelihood was if the market's going to bottom and rally that there won't be a recession and there wasn't one. So in short um it would take more than one rate hike to to to top this market. But there may be other factors topping the market. You know I could let me show you some other factors that may be topping the market. Market is not necessarily a healthy market. Like let's look at uh let's look at uh here let's look at this one net credit balances. You see this is what supports market is is margin debt. And margin debt relative to cash is at the lowest level in history. Now, you can't trade based on this, but if the if if the market starts correcting and people who have margin debt are going to have to uh cover the margin, that could be that could put pressure on the on the stock market. He's at the lowest level in history. As you can see, the the 2000 market crash took place at this level and the 20078 was predicated on this level and right now we're at the lowest level in history, which means that the market is is on a tight wire. The market can can collapse at any time once investors lose confidence that they'll be able to cover their margin debt. That's one thing to keep in mind and realize one thing when rates go up mar it's much harder to cover the margin debt because margin rates go up as well. That's one of the reasons when the Fed raises rates or natural interest rates rise one of the reason it affects the market. In reality natural rates are rising. the the 30-year, the 10 year, and the and the 2-year all at one year highs. And if they're going to go higher, which I'm not I'm not going to project the bonds, but if they go higher, that should have an effect on margin. So, that's that's one of the things we would look at um as far as why the market might be topping. Um there's um and then we showed you all the various um charts that were suggesting that um that uh that the market uh may at least in a corrected mode. I want to show you something very fascinating and this is the market in the year 2000. I say this because every everyone's missing this currently. People are pointing out that the equal weighted market c equal weight index made a new high and that's very bullish. I I pointed out myself the S&P 500 equal weight index made a new all-time high yesterday as did the S&P equal weighted 1500 index. All 1500 stocks made a new high and people were arguing wow that must be the S&P must continue higher as well. Let's look what happened in the year 2000. It's just amazing and it's amazing that people don't follow this and even though I've I've I I put this on Twitter so anyone to see it. I don't I don't see anybody replicating this. This is the peak in 2000. Remember the SP went down some 46 or 50% off its peak in March 20 March 24th so 2000. Look at the the this is the red line and with the shaded blue. The dark the black line is the S&P unweighted index. You see the unweighted index rallied into May 21st 2001. The S&P peaked in March 2000. The unweighted got higher and higher into May of 2021. I think it gained I it's not here in the chart. I think it gained at least 18% from 2000 to 2001. So imagine throughout this bureau market, you know, and NASDAQ was really getting killed much worse than the S&P. Imagine technicians, the fundamentalist pounding the table and saying, "No, no, there's just a correction because the S&P equal weight index is making new highs. It's a meaningless meaningless data. It makes new highs because it doesn't take much to move the smaller stocks, the S&P 500, and the small stocks didn't get overvalued like the big stocks did. Now currently it's the semiconductor stocks, the technology stocks, the electronic stocks, meaning those that involved in data centers and so on that got overvalued and maybe the great bare market will be just those stocks going down with the investor market remaining flat for a while. The fact that you had 54 new highs yesterday and the fact that the S&P 500, 1500 on unweighted basis or equal weighted basis made new highs really doesn't tell you anything. It just tells you that those stocks are doing well while the rest of the market is doing poorly. what's going to happen in the future with the S&P 500 is B it has to be based on other other types of information. Um one thing we do we we we publish every any time the S&P is at a market peak. We publish what we call technicals at the high which shows the technical data that occurred at prior market highs if it's yellow means the the data is consistent with information seen at prior market highs. For example on on um on June 2nd there were 30 new highs in the S&P. Now, previous market highs, you know, you saw as high as um as as as 82 new highs. So, that was inconsistent. Anyway, this is what we look at. And they're all yellow, which means it's consistent with the final market peak. But again, you can't say that this is a guarantee that you're headed for a bare market because the market could correct and make another another high at other levels. There's um there's actually yeah >> anything that could uh in terms of sectors within the S&P or NASDAQ or commodities or any other asset classes that would do well during a rising interest rate environment. Milton, >> well I would tell you this. Well, this is the wrong one. This is just I showed I I got out of my gold my personal gold on January 29th, 2026. This is my check that I received just >> You got exactly on January 29th before the correction. Okay. I told my wife I woke up in the morning. I saw 19 trading at night. I told my wife, I got to go to the to the gold dealer. I got to sell them my gold. And that's what I did. So, people didn't believe me. I actually showed a copy of the check. But the point is, why why was it that we decided to uh >> That is the most remarkable example of timing I've ever seen on this show yet. I I I How did you know? I mean, you probably >> How did we know? Okay, let's look at go. How did we know? So, first of all, as you know, people going crazy about gold. They say, "Wow, now's the time to buy gold inflation." I showed this chart. I say, "Listen, this is gold um in by GDP weighted currencies." Right here, they're saying now is the time to buy gold. Look at the right here. I'm making this see right here. Now is the time to buy gold. You look at the chart, you can say, "Well, maybe this is the time to buy gold. Maybe now is the time to go. Even maybe now is the time to buy gold." But how could anyone just looking at charts say now is the time to buy gold. But everyone was saying it, number one. So basically, there's a mania, illogical mania. Secondly, I said the following. Gold is really just a commodity. Now people like to make it in some sort of religious object or or you know or holy some holy object but gold is really just a commodity of the commodity. This is the ratio of gold to crude. Now gold to crude in January got to its highest level in history. Now why if gold is a commodity that moves moves up with inflation? So too is oil a commodity that moves up with inflation. So the if gold is anticipating inflation why isn't oil anticipating the same inflation? So the fact that gold got way above its it it's its uh the ratio to to to oil where it's been history. I mean historically it should be down down here. You see? So anyway that was another reason to tell you this mania and gold makes no sense. Even if there will be inflation gold got ahead of itself. By the way this peak is when crude went down to zero. You recall during the COVID crisis for a couple of days they couldn't store any any crude. So crude went down to zero. That's this spike. This spike wasn't an increase in gold. It was a decrease in in crude. But this spike basically is an an increase in in in in gold relative to crude. That's another thing we looked at a gold relative to crude. Then we looked at something else. Let's say inflation. Well, doesn't inflation bring up housing prices as well? Inflation doesn't bring up gold. It brings housing prices. This in January, this is the ratio of gold to the typical median sales price of a home in the United States. And this was the peak in 1980. This is the peak in 2011. And this is where we were then. And I said to myself, if gold is truly moving because we're headed for hyperinflation like people were saying, then housing prices should also move up because we're heading in hyperinflation. You look at Zimbabwe, you look at Germany when they had the hyperinflation. It wasn't just gold that went up in price, it was housing that went up in price, it was oil that went up in price in the nominal currency. Anyway, this is another reason to tell us that uh and then the most important chart which I which I point out in my report at the time was the following was this chart. Um this is from the report January 29th. You see it's a day the day I sold my gold. >> They recommend our clients to go short. January 29th, 2026. >> Look at gold relative to CPI. If gold is telling you that inflation is going up, well in 1980, gold relative CPI is here. Now it's twice as high as it was relative to CPI than it was in 1980. Now why isn't CPI moving up? Now of course Peter Schiff will tell you that CPI is not measured properly. I'll agree CPI isn't measured properly. But I know that if I took an ounce of gold in January 30th 19 29th of 19 2025 and I wanted to buy a couple of cans of Coca-Cola, I'll buy many more cans of Coca-Cola ever would have bought in history because the price of gold relative to Coca-Cola was the highest in history. The price of gold relative to Hershey bars was the highest in history. The price of gold relative to loaf of bread was the highest in history. The price of gold relum relative to inflation was highest in history. The price of gold relative to oil was highest in history. Which told me that gold is not anticipating inflation. Gold is ahead of itself because everybody believes we're having inflation. Then we see the same thing with silver and that's why we get out. It was a very good call and that's really basically what we looked at at the time. Then there was there was something else. If I can bring up the chart. Oh boy. There was also gaps in spot gold which is a very very rare thing to see. Spot gold which trades 23 hours a day on the charts actually gapped up into that night's high on January 29th. That's when I said we got to get out. You don't see it gapped and reversed. That's what we got out. So there are many reasons. On a fundamental basis, we do not believe to that gold is any other than a commodity. All commodities should hedge against inflation one way or another, especially a commodity like gold which doesn't get consumed which uh which uh which is um which people do use as a monetary source which has a a very very very liquid market. So if if uh uh if gold is going to uh if gold's going to move up because of inflation, there's no reason for gold to actually outpace inflation. You look historically in the United States going back 100 years or so, gold has only outpaced inflation by about 1 and a half% peranom. So this was far more than 1 half% peranom. So you know we're likely to see gold back to this level at least, which means you know, you know, you should see pullback in gold. Now, we went long, we're long gold, long 5% gold, 5% silver, and 5% the GDX. And that's again based on the fact that they had such such large corrections. We're thinking maybe we'll just get a tactical rally, but we're not we're not changing our long-term view, which is basically bearish gold and bearish silver and bearish um and bearish gold stocks as well. >> Okay. So, uh just going back to my question then, when interest rates rise, are there sectors specific sectors that will do well? uh financial stocks for example the earnings of the last quarter of the big banks are fantastic. Uh what do you expect to happen? >> Well I I think the bank stocks have been doing well and if you think of interest rates rise bank stocks could continue doing well. I don't think there's any one any one um sector you can say will do well when interest rates rise. I really can't yeah >> think of any sector historically you can really pound the table and say if interest rates rise this sector will do well. Gold should not be a sector that does well when interest rates rise. Certainly technology should not be a sector that does well when interest rates rise. But companies technology stocks should be do better than non-technology stocks at least historically. Now this has changed historically the great technology companies had no debt or low debt. They didn't borrow money. They were just cash cows. They'd buy back the stock. This has changed in 2025 and 2026. is going to change in 2027 and 2028 because now these companies what you call them hypers scales they're involved in the um in AI and they're starting to borrow money trillions of dollars for the first time. So in that case as interest rates rise the cost to borrow money goes up to the extent that they're uh their their what they borrow is not fixed it's going to affect them and to the extent they have to borrow more money as rates go up they'll have to pay more for what they're borrowing. That's another reason to say that this time around interest rates should have a greater negative effect on technology stocks than has ever had in the past. That's what I would say. This is just a chart of uh it's not my chart, but this is Amazon, Microsoft, Google, the hyperscalers showing the cap x estimates and they're they're financing this through debt. So you're talking about, you know, trillions of dollars that's going to be um borrowed through, you know, through 2007, 2028. So as I say yes so maybe interest rates this time will have a a major negative effect on on these um technology stocks. I want to show something else which people are making mistake about and that has to do with the um with the PE of the um price earnings ratio of the NASDAQ. Let me see if I can find that chart here. See people are claiming the NASDAQ P is so high. You know this is the this is a a chart of the um blended forward 12 month forward P ratio. Now, you know, at the 2000 peak, look where the P ratios were. 80, 70, 60, 50. You know, now we're 24 times earnings. I'm not saying this is cheap. And people who just value stocks based on um uh based on um the, you know, present value or future returns, we'll say at 25 times P is high. But the market never values stocks based on present value, future returns. The market values stocks based on growth, potential growth. that is not necessarily included in the current price and also based on on on speculative sentiment. People want to own stocks because they don't want to hold cash. People won't own stocks because they think it can do better than than buying a house. So there's a lot of speculative elements and sent elements that go into stocks. So the fact that it's trading at 24 times earning to me is not a reason to worry about a bare market. Not at all. We've seen it much higher. And look at this. The bare market in 2008 began at a much lower PE. the beer market that began but the beer market that began in 2000 began at a much higher PE. These things fluctuate. You can't make any hard and fast rule as to what type of PE will will top the market. Just a side note, the famous um market analyst Benjamin Graham, the fundamentalist, never got it straight. Never ever got it straight. He always felt the market was overvalued based on his his measures of valuation. And that is because he was under the misconception that markets peak when they get overvalued and not understanding that markets can get overvalued and more overvalued and retain their overvaluation for years or even decades. There are some analysts out there have been bearish for decades strictly because the metrics they use is valuation metrics, historical valuation metrics. We we we were very careful not to use historical valuation metrics. rather use uh market data metrics and that's more flexible and that changes along with the market and that uh keeps you in bull markets and keeps you out of bare markets. Having said this, as you know, we we basically all my career I've been involved in institutional uh uh money money management. I I managed money for hedge funds. I managed the largest gold mutual fund at Oppenheimer. managed various equity funds and uh my clients in this business I'm in now Miltonberg advisers MB advisers basically are large family offices large hedge funds sovereign wealth funds and so on but we started a new product for retail investors and we started this in January this year and the goal here is basically to own the S&P 500 uh during bull markets just hold it not leverage buy and hold don't trade and to um get out not prior to a bare market once a bare market takes takes hold. Like say well the market's down 8% or so, we'll get the benefit of the doubt that there's a bare market coming unless we see some buy signals. So to show you a little bit about how this works, this is the number of trades for the retail model per year. As you can see, most some years had zero trades. Some years had only one or two trades. I think the most we saw were three trades in the year 2002. So this is for investors who don't want to have to look at their screen every day and and have their advisors call them up and tell them get in the market, get out of the market, buy stocks. These are for people who really just want to trade you know once every one and a quarter years and out from the market. The model historically has gained 18 18 and a half% peranom mainly by being out of the out of the market during bare markets and getting in within days of a bull market. Our buy signal in 2026 occurred on April 8th April 10th excuse me which is 8 days after the low which is really late. Most of our buy signals take place within one to five days of the low one to four days of the low. So we're a little late but yet the buy signal is working. The market has rallied. We're still long, 100% long for the retail clients. And I don't know if most of your people who watch your your your podcast are retail investors or individual investor. I'm sure they are. They should take a peek. Miltonberg.com and just because I think this is a this a you know, it's the end of my career. This is a fascinating product. I made it specifically for individual investors. I made it easy easy. Get in the market, buy the VU or the spy hold and only get out when there's a likelihood more than random likelihood of a bare market and wait for the next buy signal. This has worked very very very well for us. That's another thing I want to show you. I want to show you one other thing before we go. I guess we're going to have to go soon. I want to show you one other thing before we go. We said we had quite a number of buy signals in April. I made a folder of each buy signal and where projects the S&P to go. For example, on April 14th, we got a buy signal based on the fact that the SP was at a 30-day high just 10 days after a correction of 9%. That's all we needed. In the past, this has happened a number of times. In the past, the medium gain within 12 months is 28.40%. But this just shows where we are today. This is through yesterday's close. Right here, we're in line with historical returns. In other words, the gain of the S&P since this signal is in line with the historical returns which had a median gain of 28%. Like here's another signal again on April 14th. In this case, we're underperforming. You see, in this case, we're still in line with historical return. So, I'm tracking. I want to see if my April signals fail. I will see it right here. I see this is still in line, which tells me the April buy signals, which early in the day we said projects to anywhere between 8,200 in the S&P or 8,900 S&P. As long as we're still in line with historical returns, I make the assumption that these buy signals are still in effect. This signal for example um generates a median return of 21% and this is again still in line with historical norms um and this is underperforming. So right now twothirds of the signals are still performing as expected historically. So if you ask me why I I could give I could give reasons to be very very bearish and call for bare market even based on technical data. forget about fundamental data. Just looking at the action, the costy, the action in the semiconductors, the fact that the margin debt is so high, the fact you saw island reversals at the top. Um, all of these factors can tell you that there's a bare market ahead. But I'm not ready to pull the trigger and and claim bare market because I am very very confident in the models that I've created. And since most of the models are still following the historical returns, as you can see, we're not going to throw in the towel until we start seeing more underperforming. Like here's an underperforming one. This is a signal that that has signaled twice in the past. The return of 39.02% peranom in the medium return and we're underperforming. So that's the reason really why we're bullish. I understand all the bearish cases overvaluation. Some analysts saying interest rates are too high. Some say Fed's going to tighten. Some say that the borrowing by the technology companies. Some say AI is just a farce and these companies are going to get battered. But um we're going to stick with our models and our models are long. As I say, our retail clients are still long and institutional clients are short, but we're short tactically and we're looking to get in and um we'll see evidence when that evidence comes. >> Excellent. Okay. >> I appreciate your time, Milton. Good to see you again. Uh tell us where we can follow your work and uh and to subscribe to your services if we want. >> Retail investors can look at um uh milenbergedge.com. Miltonberg edgeed.com. And that we have a service $10 a month. It's an amazing service. is made specifically for the simple easy retail uh client who wants to know trade easily and not have headaches and not have to worry about the market each day and our institutional clients again uh who get all all of our work. >> It's uh miltonberg.com milenberg.com. >> All right. I enjoy it. Thank you. I hope this was a good interview. I think I I enjoyed it. I have so much more I can talk about. This should be it for now. >> I enjoyed it as well. I enjoy uh your commentary as always and we appreciate having you back on. Thank you very much. Please do follow Milton in the links down below. Thank you very much, Milton. Enjoy your summer. We'll speak again soon. >> Great. Thank you, David. >> Thank you for watching. Please do like and subscribe. Follow Miltonberg in the links down below. And don't forget to use my code lin when you sign up to Koshi. Remember, new users who use my code lin can get $500 when you sign up and trade $25.
Comments 0
Sign in to join the discussion.
Sign inNo comments yet. Be the first to share your thoughts!